. 2023 Nov 28;14(1):7820.
doi: 10.1038/s41467-023-43567-7.

The genetic relationships between brain structure and schizophrenia

Affiliations

The genetic relationships between brain structure and schizophrenia

Eva-Maria Stauffer et al. Nat Commun. .

Abstract

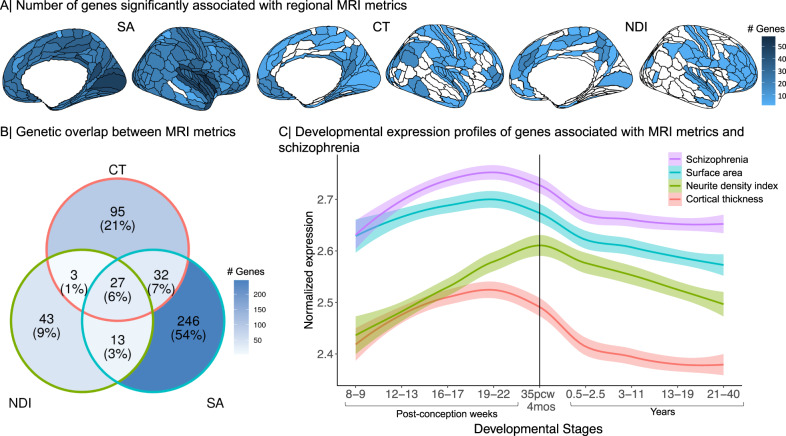
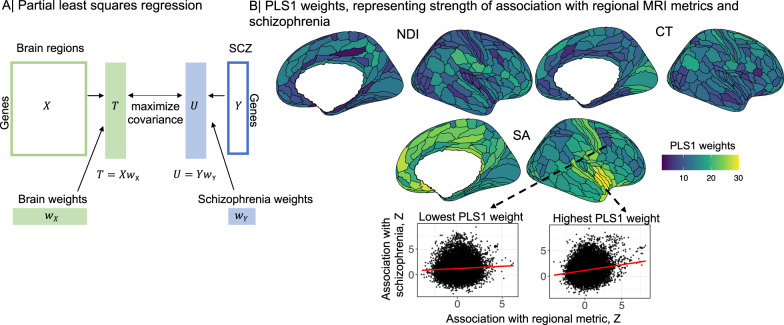
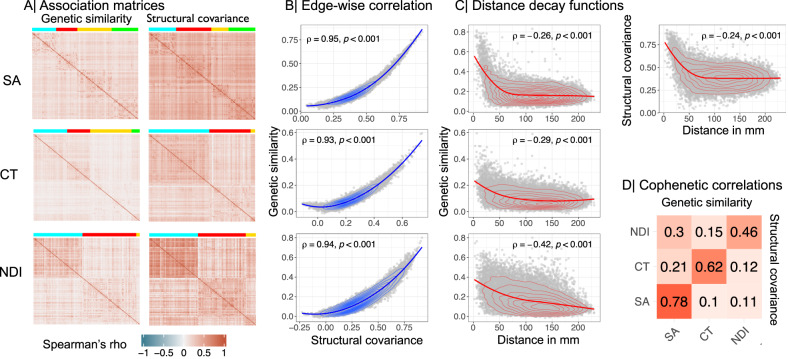
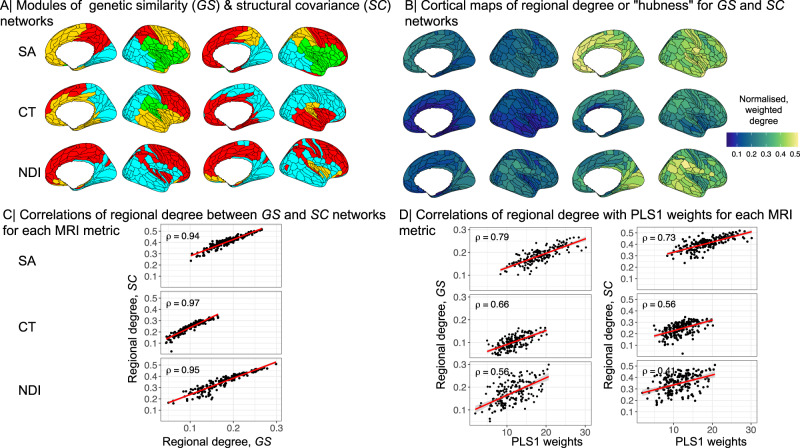
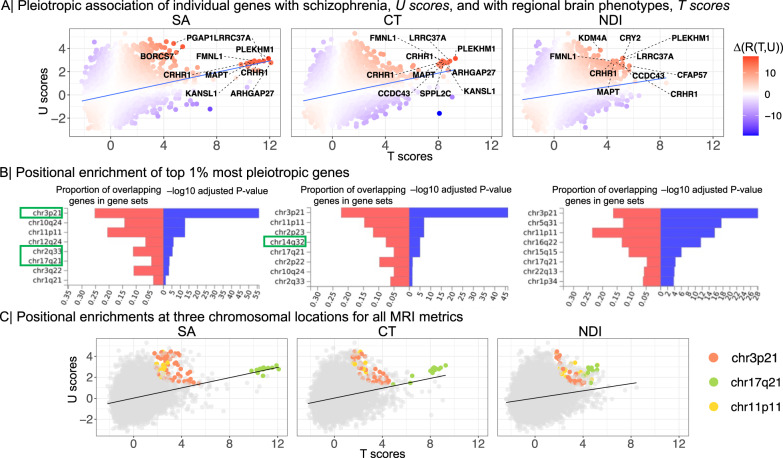
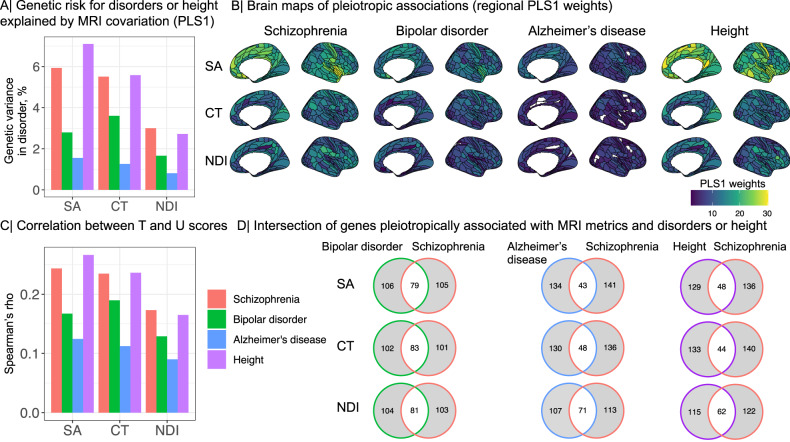
Genetic risks for schizophrenia are theoretically mediated by genetic effects on brain structure but it has been unclear which genes are associated with both schizophrenia and cortical phenotypes. We accessed genome-wide association studies (GWAS) of schizophrenia (N = 69,369 cases; 236,642 controls), and of three magnetic resonance imaging (MRI) metrics (surface area, cortical thickness, neurite density index) measured at 180 cortical areas (N = 36,843, UK Biobank). Using Hi-C-coupled MAGMA, 61 genes were significantly associated with both schizophrenia and one or more MRI metrics. Whole genome analysis with partial least squares demonstrated significant genetic covariation between schizophrenia and area or thickness of most cortical regions. Genetic similarity between cortical areas was strongly coupled to their phenotypic covariance, and genetic covariation between schizophrenia and brain phenotypes was strongest in the hubs of structural covariance networks. Pleiotropically associated genes were enriched for neurodevelopmental processes and positionally concentrated in chromosomes 3p21, 17q21 and 11p11. Mendelian randomization analysis indicated that genetically determined variation in a posterior cingulate cortical area could be causal for schizophrenia. Parallel analyses of GWAS on bipolar disorder, Alzheimer's disease and height showed that pleiotropic association with MRI metrics was stronger for schizophrenia compared to other disorders.


Conflict of interest statement

E.T.B. has consulted for GlaxoSmithKline, SR One, Boehringer Ingelheim, Sosei Heptares, and Monument Therapeutics. R.A.I.B. and E.T.B. are directors of and hold stock in CentileBio. All other authors declare no conflicts of interest.

Figures

Fig. 1
Fig. 1. Genetic associations with three MRI metrics of regional brain structure: surface area (SA), cortical thickness (CT) and neurite density index (NDI).
A Cortical surface maps representing the number of genes significantly associated with variation in each MRI metric at each of 180 cortical areas, from left to right: SA, CT, NDI. Regions without any significant gene associations are shown in white. B Venn diagram representing the number of genes that are specifically associated with each MRI metric or generically associated with two or three metrics. The percentages refer to the proportion of all genes associated with one or more MRI metrics represented in each segment of the Venn diagram. C Developmental trajectories of average gene expression from 8 post-conception weeks (PCW) to 40 years for the sets of genes significantly associated with each MRI metric or with schizophrenia (SCZ). The shaded region indicates 95% confidence intervals. The vertical line indicates the usual timing of birth. These results highlight mid-to-late fetal stages as a critical window for genetically controlled development of cortical regions and for expression of genes associated with risk of schizophrenia. Source data are provided as a Source Data file.
Fig. 2
Fig. 2. Partial least squares (PLS) analysis of genetic covariation between regional brain phenotypes and schizophrenia.
A The {1 × 18,640 } vector of unthresholded gene association statistics (Z-scores) derived by H-MAGMA analysis of the schizophrenia GWAS dataset was designated as the response variable, i.e., the dependent Y vector; and the {180 × 18,640} matrix of unthresholded gene association Z-scores for each of the MRI GWAS datasets was designated the predictor variable, i.e., the independent X matrix. The first PLS component (PLS1) defined the weighted functions of X and Y that were most strongly correlated overall weighted functions of the whole genome. The PLS1 weights for X (brain weights, w(X)i, i = 1, 2, 3, …180) multiplied by X constituted a {1 × 18,640} vector of T scores (genes weighted by association with brain phenotypes); whereas, the PLS1 weights for Y (schizophrenia weights w(Y)i) multiplied by Y constituted a {1 × 18,640} vector of U scores (genes weighted by association with schizophrenia). Thus genes with the highest absolute T and U scores can be regarded as the genes which contribute most strongly to the genetic covariation between schizophrenia and each regional brain phenotype,. B Cortical surface maps of PLS1 weights for neurite density index (NDI), cortical thickness (CT) and surface area (SA). Cortical regions with higher PLS1 weights (shades of yellow) have stronger genetic covariation with schizophrenia: for SA, regions of insular and medial prefrontal cortex; for CT, visual, premotor and inferior parietal cortex; and for NDI, inferior frontal, inferior parietal, posterior cingulate and posterior opercular cortex. Scatterplots (Spearman’s correlations, ρ) illustrate the genetic relationships between schizophrenia (y-axis, Z-scores from H-MAGMA analysis of schizophrenia GWAS dataset) and brain surface area (x-axis, Z-scores from H-MAGMA analysis of MRI GWAS datasets) in two cortical regions, one with a low PLS1 weight (left, dark blue, ρ = 0.04), and one with a high PLS1 weight (right, yellow, ρ = 0.17). In both plots each point represents one of 18,640 genes. Spearman’s correlations were two-tailed. Source data are provided as a Source Data file.
Fig. 3
Fig. 3. Genetic similarity and structural covariance of cortical networks.
A Genetic similarity (left) and structural covariance (right) matrices for surface area (SA), cortical thickness (CT), and neurite density index (NDI). Brain regions are ordered according to modular decomposition of each matrix; see Fig. 4. B Edge-wise Spearman’s correlation between genetic similarity (y-axis) and structural covariance (x-axis) matrices. C Spearman’s correlation between genetic similarity (y-axis) and geodesic distance in millimetres (x-axis). For SA, the correlation between structural covariance and geodesic distance is also shown in the top right panel. For genetic similarity, the correlations with geodesic distance were: SA, ρ = −0.26; CT, ρ = −0.29; NDI, ρ = −0.42; all P ≤ 0.0001. Whereas, for structural covariance, the correlations with geodesic distance were: SA ρ = −0.24; CT ρ = −0.3; NDI ρ = −0.4; all P ≤ 0.0001. Spearman’s correlations were two-tailed. D Cophenetic correlation matrix showing the similarity in hierarchical clustering of structural covariance and genetic similarity matrices. The upper triangle shows cophenetic correlations based on genetic similarity, the lower triangle is based on structural covariance, and the diagonal represents the similarity between dendrograms of structural covariance and genetic similarity of the same MRI metric. These results indicate that the hierarchical clustering of structural covariance and genetic similarity networks is strongly coupled for each MRI metric, and quite specifically organised for each of the MRI metrics. Source data are provided as a Source Data file.
Fig. 4
Fig. 4. Hubs of genetic similarity and structural covariance networks are co-located and associated with pleiotropic genes.
A Modular decomposition of genetic similarity matrices (left) and structural covariance matrices (right) for surface area (SA), cortical thickness (CT) and neurite density index (NDI). We used the Louvain algorithm to resolve the modular community structure of SC and GS networks for each MRI metric and found three (for NDI) or four (for CT, SA) spatially contiguous modules of the GS networks, and three (CT, NDI) or four (SA) modules of the corresponding SC networks (Methods). B Cortical surface maps of hub scores based on genetic similarity matrices (left) and structural covariance matrices (right). C Scatterplots showing positive Spearman’s correlations between hubness (weighted degree centrality) of nodes in genetic similarity (x-axis) and structural covariance networks (y-axis) for each MRI metric. D Scatterplots showing positive Spearman’s correlations between strength of pleiotropic gene association indexed by PLS1 weights (x-axis) and hub scores of nodes in genetic similarity networks (left) or structural covariance networks (right) (y-axis). The shaded region indicates 95% confidence intervals. Spearman’s correlations were two-tailed. Source data are provided as a Source Data file.
Fig. 5
Fig. 5. Genes pleiotropically associated with schizophrenia and regional MRI metrics.
A Scatterplot of T scores (x-axis) versus U scores (y-axis) for each of 18,640 protein-coding genes, derived from their PLS1 weights (Fig. 2). The T score is the weight of each gene on the MRI metric; the U score is the weight of each gene on the association with schizophrenia; and the correlation between T and U scores, R(T, U), quantifies the strength of genetic relationship between brain and schizophrenia phenotypes. Each gene is colour-coded according to its value of Δ(R(T, U)) which indicates the positive (red) or negative (blue) magnitude of its influence on the whole genome relationship between schizophrenia and each MRI metric. The top ten genes with the largest positive leave-one-out scores for Δ(R(T, U)) are annotated, including PLEKHM1, FMNL1, LRRC37A, MAPT, KANSL and CRHR1, all located within the 17q21.31 region. We note that these genes were also identified by the intersection analysis of genes significantly associated with both MRI metrics and schizophrenia (Fig. 1). B Significant positional enrichment of 185 genes (top 1%) with the highest Δ(R(T, U)) scores based on hypergeometric testing implemented in FUMA. For example, the genes most strongly contributing to genetic covariation between SA and schizophrenia were positionally enriched at chromosome 2q33, whereas genes contributing to covariation between CT and schizophrenia were enriched at chromosome 14q32. The red bars show the proportion of co-located genes according to the size of each gene-set; the blue bars indicate -log10 P-values adjusted for the number of tested gene-sets. Chromosomal locations showing significant local genetic correlations based on LAVA are highlighted in green boxes. C Scatterplot of T scores versus U scores, exactly as shown in (A) except that genes are colour-coded according to their location in the three genomic regions that were positionally enriched for all MRI metrics. Source data are provided as a Source Data file.
Fig. 6
Fig. 6. Specificity of pleiotropic associations between clinical disorders or height and regional brain phenotypes.
A Proportion of variance in the genetically predicted risk for each disorder and height (y-axis) explained by the genetic effects on regional MRI metrics (x-axis; SA surface area, CT cortical thickness, NDI neurite density index) based on the first PLS component, PLS1. B Cortical surface maps of PLS1 regional brain weights for schizophrenia (SCZ), BIP, AD and height. Higher positive weights (shades of yellow) indicate stronger genetic covariation with each disorder; regions with zero weight are shown in white. Mean absolute weights were lower for BIP (SA w¯ = 12.3, CT w¯ = 9.45, NDI w¯ = 8), and for AD (SAw¯ = 9, CT w¯ = 5.2, NDI w¯ = 5.4), than for schizophrenia (SA w¯ = 18.29, CT w¯ = 11.89, NDI w¯ = 11.37). Apart from SA, mean PLS weights for height were generally lower than for schizophrenia (SAw¯ = 20.4, CT w¯ = 12.1, NDI w¯ = 10.5). Fewer brain regions had significant PLS1 scores for BIP (NDI = 175) and AD (SA = 79, CT = 166, NDI = 170) than for schizophrenia (SA, CT = 180, NDI = 179). For height, all brain regions showed significant PLS1 scores. C Spearman’s correlations (ρ; y-axis) between T and U scores for schizophrenia, bipolar disorder, Alzheimer’s disease and height. The strength of pleiotropic association indexed by ρ was greater for schizophrenia (SA ρ = 0.24, CT ρ = 0.23, NDI ρ = 0.17), than for BIP (SA ρ = 0.17, CT ρ = 0.19, NDI ρ = 0.13), AD (SA ρ = 0.12, CT ρ = 0.11, NDI ρ = 0.09). For SA, the pleiotropic association with height was stronger compared to schizophrenia (SA ρ = 0.27, CT ρ = 0.23, NDI ρ = 0.16). D Venn diagrams showing the intersection of the top 1% most pleiotropic genes, with the highest Δ(R(T, U)) scores, for each MRI metric. Source data are provided as a Source Data file.

References

    1. Grasby, K. L. et al. The genetic architecture of the human cerebral cortex. Science367, eaay6690 (2020). - PMC - PubMed
    1. Warrier, V. et al. Genetic insights into human cortical organization and development through genome-wide analyses of 2347 neuroimaging phenotypes. Nat. Genet.55, 1483–1493 (2023). - PMC - PubMed
    1. Lee PH, et al. Partitioning heritability analysis reveals a shared genetic basis of brain anatomy and schizophrenia. Mol. Psychiatry. 2016;21:1680–1689. doi: 10.1038/mp.2016.164. - DOI - PMC - PubMed
    1. Smeland OB, et al. Genetic overlap between schizophrenia and volumes of hippocampus, putamen, and intracranial volume indicates shared molecular genetic mechanisms. Schizophr. Bull. 2018;44:854–864. doi: 10.1093/schbul/sbx148. - DOI - PMC - PubMed
    1. Stauffer, E.-M. et al. Grey and white matter microstructure is associated with polygenic risk for schizophrenia. Mol. Psychiatry26, 7709–7718 (2021). - PMC - PubMed

Publication types

LinkOut - more resources