. 2023 Nov 28;14(1):7794.
doi: 10.1038/s41467-023-43676-3.

The ELAVL3/MYCN positive feedback loop provides a therapeutic target for neuroendocrine prostate cancer

Affiliations

The ELAVL3/MYCN positive feedback loop provides a therapeutic target for neuroendocrine prostate cancer

Yiyi Ji et al. Nat Commun. .

Abstract

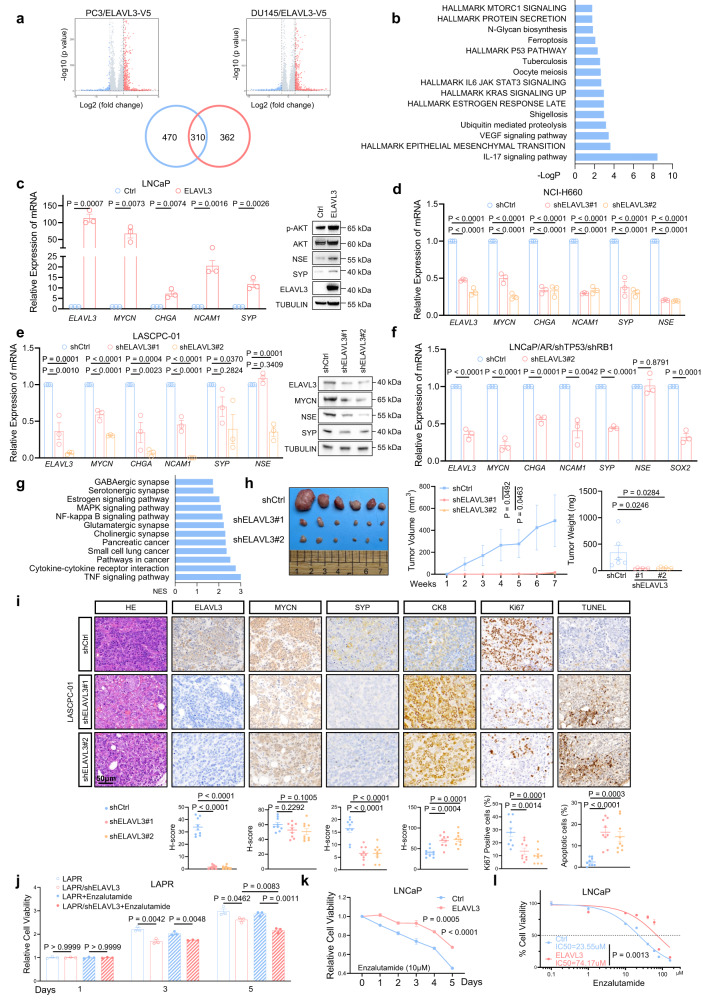
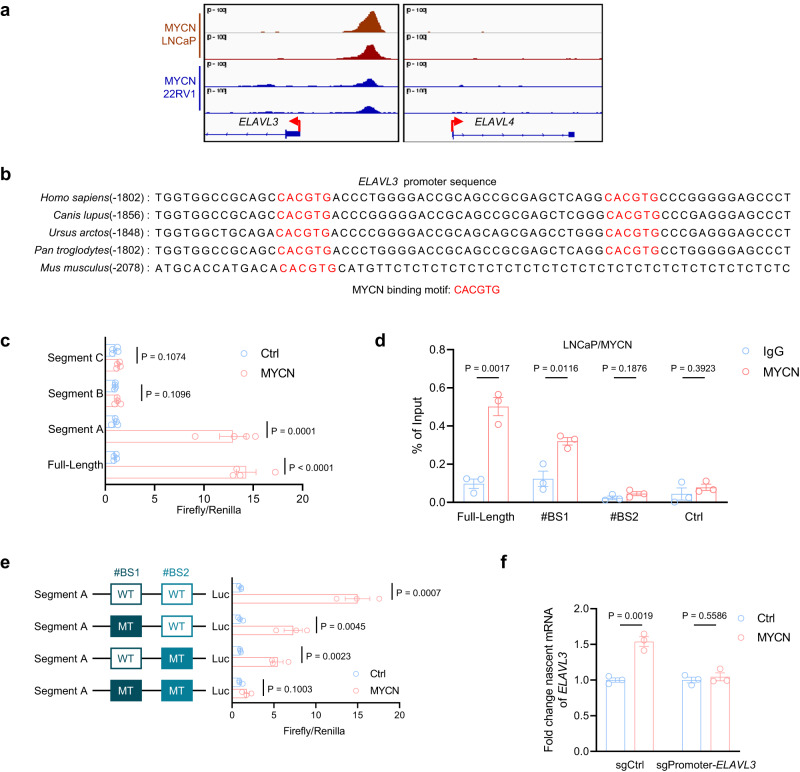
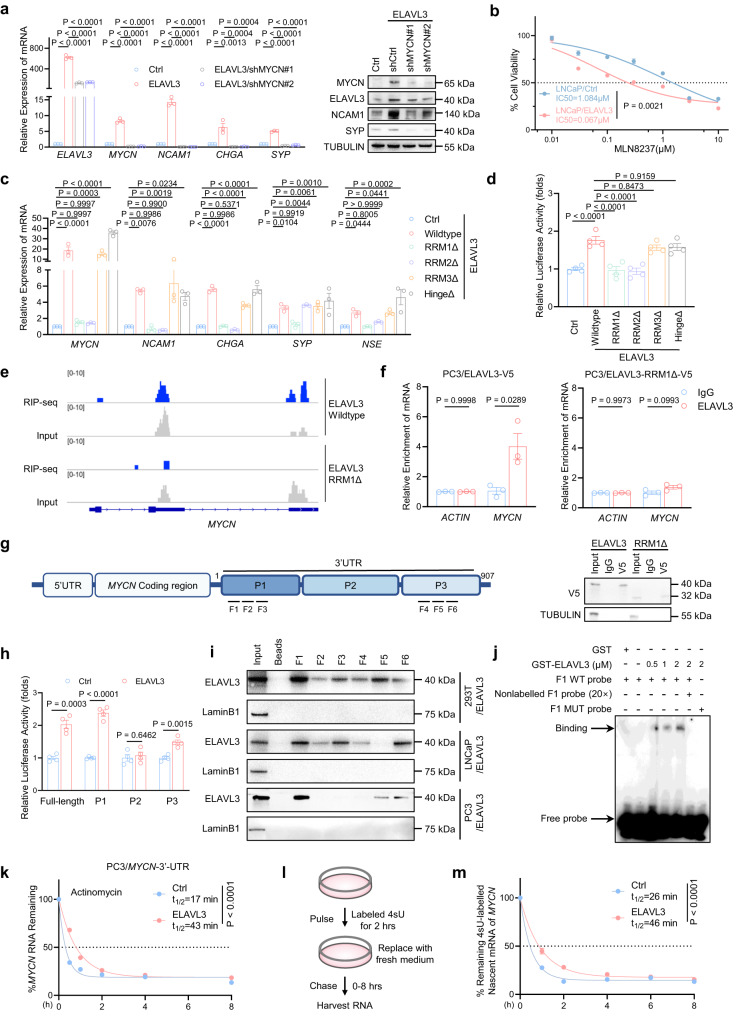
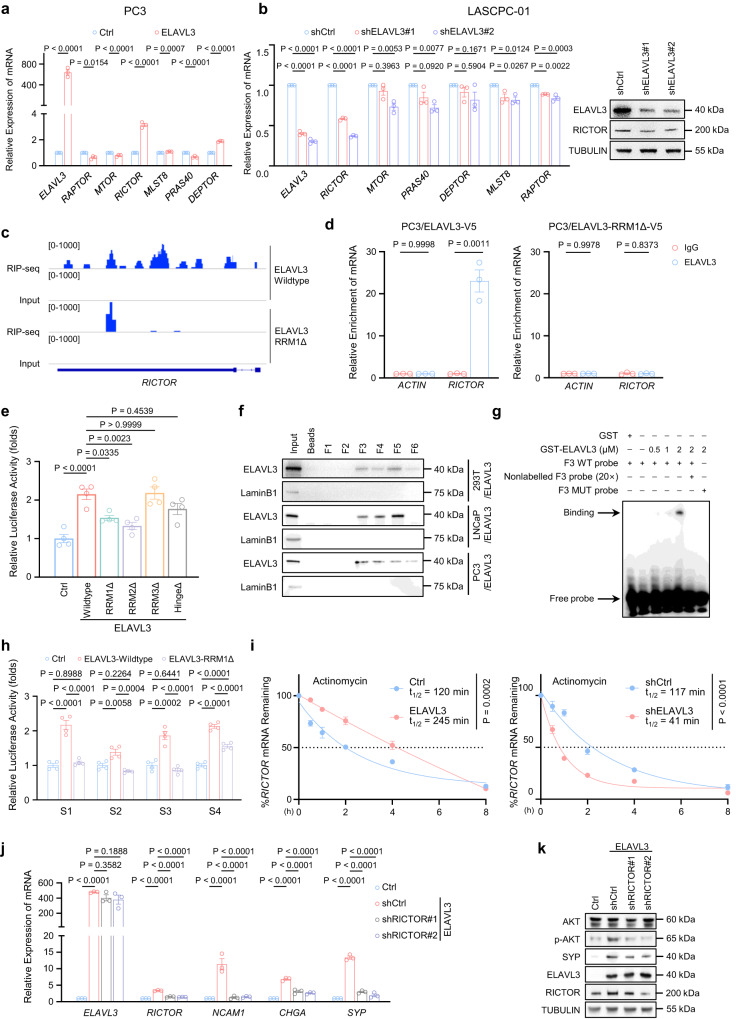
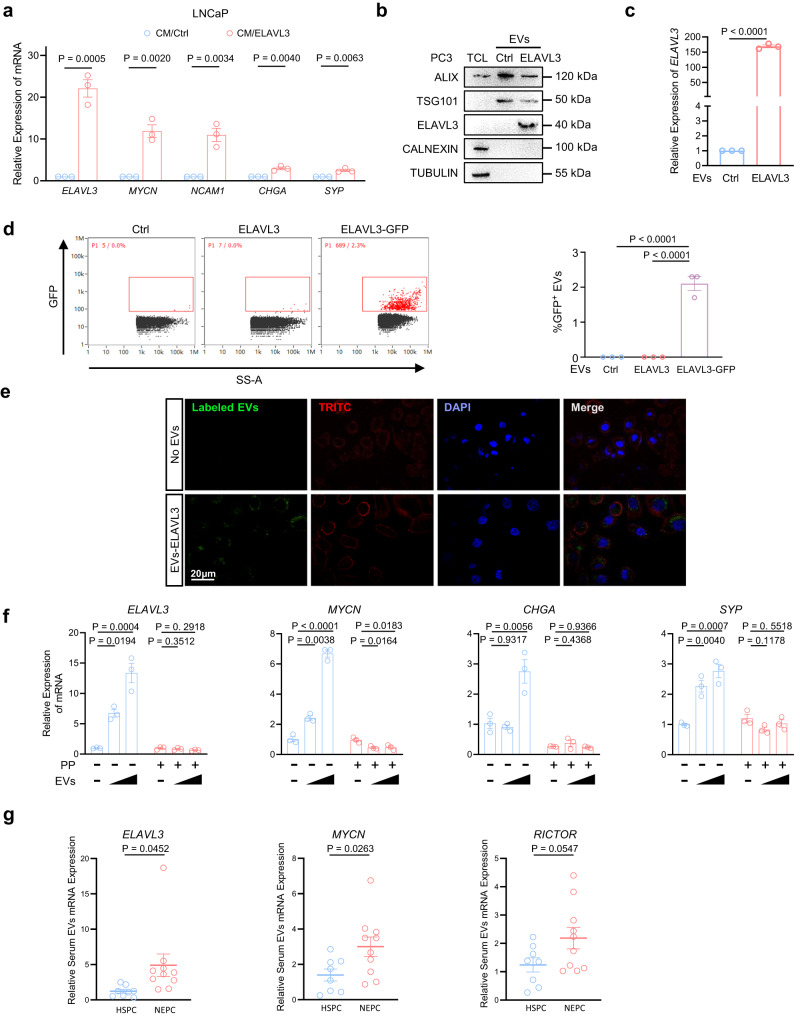
Neuroendocrine prostate cancer is a rapidly progressive and lethal disease characterized by early visceral metastasis, poor prognosis, and limited treatment options. Uncovering the oncogenic mechanisms could lead to the discovery of potential therapeutic avenues. Here, we demonstrate that the RNA-binding protein ELAVL3 is specifically upregulated in neuroendocrine prostate cancer and that overexpression of ELAVL3 alone is sufficient to induce the neuroendocrine phenotype in prostate adenocarcinoma. Mechanistically, ELAVL3 is transcriptionally regulated by MYCN and subsequently binds to and stabilizes MYCN and RICTOR mRNA. Moreover, ELAVL3 is shown to be released in extracellular vesicles and induce neuroendocrine differentiation of adenocarcinoma cells via an intercellular mechanism. Pharmacological inhibition of ELAVL3 with pyrvinium pamoate, an FDA-approved drug, effectively suppresses tumor growth, reduces metastatic risk, and improves survival in neuroendocrine prostate cancer mouse models. Our results identify ELAVL3 as a critical regulator of neuroendocrine differentiation in prostate cancer and propose a drug repurposing strategy for targeted therapies.


Conflict of interest statement

The authors declare no competing interests.

Figures

Fig. 1
Fig. 1. ELAVL3 expression is associated with neuroendocrine differentiation of prostate cancer.
a Venn diagram showing the overlap of upregulated differentially expressed genes for the four NEPC RNA-seq datasets: (1) neuroendocrine prostate cancer (NEPC) versus castration-resistant prostate cancer (CRPC), data obtained from Beltran 2016 cohort; (2) Pb-Cre4: Ptenf/f; LSL-MYCN+/+ versus Pb-Cre4: Ptenf/f; LSL-MYCN−/− organoids, data obtained from GSE86532; (3) Pb-Cre4: Ptenf/f; Trp53f/f; Rb1f/f versus Pb-Cre4: Ptenf/f, data obtained from GSE90891; (4) two NE-high single-cell clusters versus 14 NE-low single-cell clusters, data obtained from GSE137829. Common genes across all analytes are indicated. b Dot plots illustrating the Pearson correlation analysis between the expression of ELAVL3, NE-related genes, and AR-related genes. Data obtained from Beltran 2016 cohort. c Representative H&E and immunofluorescence staining of AR, SYP, CHGA, and ELAVL3 in prostate tissues from indicated patient groups (BPH (n = 15), HSPC (n = 144), CRPC (n = 15), and NEPC (n = 22)). Scale bar, 50 μm. d Quantification of ELAVL3 staining in prostate tissues from indicated patient groups, each dot represents tissue from an individual patient. e QPCR showing relative mRNA expression of ELAVL3, NE-related genes (MYCN, SOX2, CHGA, CHGB, NCAM1, SYP, and NSE), and AR in a panel of prostate cancer cells (n = 3 biologically independent experiments). f Western blot showing protein expression of ELAVL3 and NE-related genes (MYCN, NSE, SYP, and NCAM1) in a panel of prostate cancer cells. g Representative H&E and immunofluorescence staining of Elavl3, Syp, Ncam1, Ar, and Ki67 in tumors from mice of Pb-Cre4: Ptenf/f; Trp53f/f (n = 10) and Pb-Cre4: Ptenf/f; Trp53f/f; Rb1f/f (n = 10). Scale bar, 50 μm. h Quantification of Elavl3 staining in prostate tumor tissues from mice groups: Pb-Cre4: Ptenf/f; Trp53f/f (n = 10) and Pb-Cre4: Ptenf/f; Trp53f/f; Rb1f/f (n = 10); each dot represents tissue from an individual mouse. Data presented as mean ± s.e.m (d, e, h). Statistical significance was determined by two-tailed unpaired Student’s t-test (e, h) or one-way analysis of variance (ANOVA) with Dunnett’s multiple comparisons (d, e). Western blot experiments were repeated three times independently, with similar results (f). NE-related, related to neuroendocrine differentiation. AR-related, related to the androgen receptor pathway. BPH benign prostatic hyperplasia. HSPC hormone-sensitive prostate cancer. Source data are provided as a Source Data file.
Fig. 2
Fig. 2. ELAVL3 is essential for the development and maintenance of neuroendocrine prostate cancer.
a Volcano plots showing enrichment of RNA most significantly bound to ELAVL3-V5 in PC3 (left) and DU145 (right). Fold change >2; adjusted P-value < 0.05, calculated by wald test. Venn diagram showing overlap between putative ELAVL3 mRNA targets from PC3 and DU145. b Hallmark and KEGG pathway enrichment analysis of samples with transcripts simultaneously bound to ELAVL3-V5 from PC3/ELAVL3-V5 and DU145/ELAVL3-V5 using Metascape. c QPCR showing relative mRNA expression of indicated genes (left) and Western blot showing indicated protein expression (right) in LNCaP/Ctrl and LNCaP/ELAVL3. d QPCR showing relative mRNA expression of indicated genes in NCI-H660/shCtrl and NCI-H660/shELAVL3. e QPCR showing relative mRNA expression of indicated genes (left) and Western blot showing indicated protein expression (right) in LASCPC-01/shCtrl and LASCPC-01/shELAVL3. f QPCR showing relative mRNA expression of indicated genes in shELAVL3 versus shCtrl of LNCaP/AR/shTP53/shRB1 (LAPR). g KEGG pathway enrichment analysis of differentially expressed genes from shELAVL3 versus shCtrl in LAPR. h Photograph showing LASCPC-01 xenografts in nude mice with shCtrl and two independent shRNAs targeting ELAVL3 (left). Tumor volume was measured once a week at indicated time points (middle, n = 6 per group). Tumor weight was measured when sacrificed (right, n = 6 per group). i Representative H&E and immunohistochemistry staining (upper; scale bar, 50 μm) and quantification (bottom; n = 9) of indicated staining in LASCPC-01 xenografts. j Cell viability of LAPR/shCtrl and LAPR/shELAVL3 treated with 10 μM Enzalutamide at indicated time points (n = 3 biologically independent experiments). k Cell viability of LNCaP/Ctrl and LNCaP/ELAVL3 treated with 10 μM Enzalutamide at indicated time points (n = 3 biologically independent experiments). l Cell viability of LNCaP/Ctrl and LNCaP/ELAVL3 treated with increasing concentration of Enzalutamide for 48 h (n = 3 biologically independent experiments). Data presented as mean ± s.e.m. (cf, hl). Statistical significance was determined by one-way ANOVA with Dunnett’s multiple comparisons (e), or two-tailed unpaired Student’s t-test (c, d, f, hl). Western blot experiments were repeated three times independently, with similar results (c, e). QPCR experiments were conducted n = 3 biologically independent experiments. Source data are provided as a Source Data file.
Fig. 3
Fig. 3. MYCN transcriptionally upregulates ELAVL3 expression.
a ChIP-seq enrichment of MYCN at ELAVL3 and ELAVL4 promoter in prostate cancer cell lines (three independent samples; GSE117306). b MYCN binding motifs exist on ELAVL3 promoter across species. c Relative luciferase activities driven by full-length or indicated segments of ELAVL3 promoter in HEK293T (n = 3 independently transfected replicates per condition). d ChIP-qPCR of different locations on ELAVL3 promoter from LNCaP/MYCN with either MYCN antibody or IgG (three independent samples). e Relative luciferase activities driven by wildtype or indicated mutant Segment A of ELAVL3 promoter reporters in HEK293T (n = 3 independently transfected replicates per condition). f QPCR showing changes of nascent ELAVL3 mRNA in HEK293T with/without MYCN induction (n = 3 biologically independent experiments). The sgRNAs were designed to target the MYCN binding sites in the ELAVL3 promoter region and the non-targeting sgRNA was used as control. Data presented as mean ± s.e.m. (c, d, e, f). Statistical significance was determined by two-tailed unpaired Student’s t-test (c, d, e, f). BS, binding site. Source data are provided as a Source Data file.
Fig. 4
Fig. 4. ELAVL3 binds and stabilizes the mRNA of MYCN.
a QPCR showing relative mRNA expression of indicated genes (left) and Western blot showing indicated protein expression (right) in indicated LNCaP cell lines. b Cell viability of LNCaP/Ctrl and LNCaP/ELAVL3 treated with increasing concentration of MLN8237 for 48 h (n = 3 biologically independent experiments). c QPCR showing relative mRNA expression of indicated genes in PC3 expressing indicated constructs of ELAVL3. d Relative luciferase activities driven by full-length of MYCN mRNA 3’-UTR reporters in HEK293T transfected with indicated constructs of ELAVL3 (n = 4 independently transfected replicates). e Genome browser tracks showing representative ELAVL3-wildtype and ELAVL3-RRM1-deletion RIP-seq peaks at the MYCN gene. f Ribonucleoprotein immunoprecipitation (RIP) assay using either V5 antibody or IgG showing the relative enrichment of MYCN mRNA in PC3/ELAVL3-wildtype and PC3/ELAVL3-RRM1-deletion (upper, n  =  3 biologically independent experiments). Western blot showing ELAVL3 was pulled down by V5 antibody (bottom). g Schematic diagram showing putative ELAVL3 binding sites on MYCN mRNA 3’-UTR, segments (P1-P3) designed for luciferase reporter assay, and fragments (F1-F6) designed for RNA pull-down assays. h Relative luciferase activities driven by full-length or indicated segments of MYCN mRNA 3’-UTR reporters in HEK293T transfected with ELAVL3 or empty vector (n = 4 independently transfected replicates). i Western blot showing ELAVL3 expression in pull-downed lysates by indicated biotinylated RNA probes (F1-F6) in indicated cells. j RNA-EMSA showing the RNA-protein complex bands of purified GST-ELAVL3 protein and indicated RNA probes (n = 3 biologically independent experiments). k MYCN mRNA decay in PC3/MYCN-3’-UTR with/without ELAVL3 expression at indicated time points following 5 μg/mL Actinomycin D treatment (n = 3 biologically independent experiments). l Schematic diagram showing pulse-labeling of nascent RNA procedure. m RNA decay of 4sU-labeled nascent MYCN mRNA in PC3/MYCN-3’-UTR with/without ELAVL3 expression (n = 3 biologically independent experiments). Data presented as mean ± s.e.m. (ad, f, h, k, m). Statistical significance was determined by one-way ANOVA with Dunnett’s multiple comparisons (a, c), or one-way ANOVA with Sidak’s multiple comparisons (d), or two-tailed unpaired Student’s t-test (b, f, h, k, m). Western blot experiments were repeated three times independently, with similar results (a, f, i, j). QPCR experiments were conducted n = 3 biologically independent experiments. Δ, deletion. Source data are provided as a Source Data file.
Fig. 5
Fig. 5. ELAVL3 binds and stabilizes the mRNA of RICTOR.
a QPCR showing relative mRNA expression of ELAVL3 and mTORC2-related genes in indicated PC3 cells. b QPCR (left) and Western blot (right) showing indicated genes in LASCPC-01 with control shRNA and two independent shRNA targeting ELAVL3. c Genome browser tracks showing representative ELAVL3-wildtype and ELAVL3-RRM1-deletion RIP-seq peaks at the RICTOR gene. d RIP assay using either ELAVL3 antibody or IgG showing the relative enrichment of RICTOR mRNA in PC3/ELAVL3-wildtype and PC3/ELAVL3-RRM1-deletion (n = 3 biologically independent experiments). e Relative luciferase activities driven by full-length of RICTOR mRNA 3’-UTR reporters in HEK293T transfected with indicated ELAVL3 or control (n = 4 independently transfected replicates). f Western blot showing ELAVL3 expression in pull-downed lysates by indicated biotinylated RNA probes (F1-F6) in indicated cells. g RNA-EMSA showing the RNA-protein complex bands of purified GST-ELAVL3 protein and indicated RNA probes (n = 3 biologically independent experiments). h Relative luciferase activities driven by segments S1, S2, S3, and S4 of RICTOR mRNA 3’-UTR reporters in HEK293T transfected with indicated ELAVL3 or control (n = 4 independently transfected replicates). i RICTOR mRNA decay in LASCPC-01/Ctrl and LASCPC-01/ELAVL3 at indicated time points post-treatment with 5 μg/mL Actinomycin D (left). RICTOR mRNA decay in LASCPC-01/shCtrl and LASCPC-01/shELAVL3 at indicated time points post-treatment with 5 μg/mL Actinomycin D (right) (n = 3 biologically independent experiments). j QPCR showing the level of ELAVL3, RICTOR, and NE-related genes (NCAM1, CHGA, and SYP) in indicated PC3 cells. k Western blot showing the level of ELAVL3, RICTOR, SYP, p-AKT, and AKT in indicated PC3 cells. Data presented as mean ± s.e.m. (a, b, d, e, h, i, j). Statistical significance was determined by one-way ANOVA with Dunnett’s multiple comparisons (b, h, j), or one-way ANOVA with Sidak’s multiple comparisons (e), or two-tailed unpaired Student’s t-test (a, d, i). Western blot experiments were repeated three times independently, with similar results (b, c, f). QPCR experiments were conducted n = 3 biologically independent experiments. Δ, deletion. Source data are provided as a Source Data file.
Fig. 6
Fig. 6. Pharmacological inhibition of ELAVL3 blocks neuroendocrine differentiation of prostate cancer cell.
a Heatmap showing the relative mRNA expression of ELAVL3, MYCN, and NE-related genes in LASCPC-01 with indicated treatments. Data are normalized to 0 h. (n = 3 biologically independent experiments). b Cell viability of LASCPC-01 with indicated treatments (n = 6 biologically independent experiments). c Western blot showing the expression of ELAVL3, MYCN, RICTOR, NE-related genes, and apoptosis markers (PARP and cleaved-PARP) in LASCPC-01 treated with 100 nM PP at indicated time points. d Cell viability of LASCPC-01/shCtrl and LASCPC-01/shELAVL3 treated with increasing concentration of PP (n = 3 biologically independent experiments). e Relative luciferase activities driven by MYCN mRNA 3’-UTR reporters in HEK293T treated with PP or DMSO (n = 6 independently transfected replicates). f RIP assay using either ELAVL3 antibody or IgG showing the relative enrichment of MYCN mRNA in LNCaP/ELAVL3 treated with 100 nM PP or DMSO (upper, n = 3 biologically independent experiments). Western blot showing ELAVL3 was pulled down by V5 antibody (bottom). g RNA-EMSA showing the RNA-protein complex bands of purified GST-ELAVL3 protein and RNA probes with/without PP treatment (n = 3 biologically independent experiments). h Hallmark gene sets and KEGG pathway enrichment analysis of different expressed genes from NCI-H660 treated with PP versus with PBS. RNA-seq was performed on three independent samples. i Photograph showing xenografts of DU145/ELAVL3 from nude mice treated with PP or PBS (left, n = 5 per group; scale bar, 1 cm). Tumor volume was measured once a week at indicated time points (middle). Tumor weight was measured when sacrificed (right, n = 5 per group). j Representative H&E and indicated immunohistochemistry staining in DU145/ELAVL3 xenografts treated with PP or PBS. Scale bar, 100 μm. k Quantification of Ki67 staining in DU145/ELAVL3 xenografts treated with PP or PBS (n = 10 sections from each mouse used for statistical analysis). Data presented as mean ± s.e.m. (b, d, e, f, i, k). Statistical significance was determined by one-way ANOVA with Dunnett’s multiple comparisons (b), or two-tailed unpaired Student’s t-test (e, f, i, k). Western blot experiments were repeated three times independently, with similar results (c, f). PP, pyrvinium pamoate. DHTS, Dihydrotanshinone I. Source data are provided as a Source Data file.
Fig. 7
Fig. 7. Extracellular vesicles-mediated transfer of ELAVL3 induces neuroendocrine differentiation in recipient cancer cells.
a QPCR showing relative mRNA expression of NE-related genes (MYCN, NCAM1, CHGA, and SYP) in LNCaP treated with indicated conditioned medium (n = 3 biologically independent experiments). b Western blot showing protein expression of ELAVL3, the EVs markers (ALIX and TSG101), the reticular marker (CALNEXIN), and TUBULIN in total cell lysate (TCL) or in EVs purified from indicated PC3 cells. c QPCR showing relative mRNA expression of ELAVL3 in EVs purified from PC3 expressing ELAVL3 or vector control (n = 3 biologically independent experiments). d Flow NanoAnalyzer analysis showing the fluorescence signal of EVs purified from indicated PC3 cells (left). Quantification of fluorescent signal of Flow NanoAnalyzer analysis from indicated EVs (right, n = 3 biologically independent experiments). e Confocal immunofluorescence showing PC3 cells cultured with/without PKH26 labeled EVs purified from PC3/ELAVL3 (n = 3 biologically independent experiments). Scale bar, 20 μm. f QPCR showing relative mRNA expression of indicated genes in PC3 cultured with EVs (0, 1 × 1010, and 2 × 1010) and treated with 100 nM PP or PBS (n = 3 biologically independent experiments). g QPCR showing relative mRNA expression of ELAVL3, MYCN, and RICTOR in EVs purified from indicated patient groups (n = 8 HSPC samples, n = 10 NEPC samples). Data presented as mean ± s.e.m. (a, c, d, f, g). Statistical significance was determined by two-tailed unpaired Student’s t-test (a, c, g), or one-way ANOVA with Sidak’s multiple comparisons (d, f). Western blot experiments were repeated three times independently, with similar results (b). CM, conditioned medium. EV extracellular vehicle, PP pyrvinium pamoate, HSPC hormone-sensitive prostate cancer, NEPC Neuroendocrine prostate cancer. Source data are provided as a Source Data file.
Fig. 8
Fig. 8. Pharmacological inhibition of ELAVL3 suppresses tumor growth and promotes survival in NEPC mouse model.
a Photograph showing morphology of organoids from Pb-Cre4: Ptenf/f; Trp53f/f (DKO) and Pb-Cre4: Ptenf/f; Trp53f/f; Rb1f/f (TKO) prostate tumors treated with PBS or PP. Scale bar, 50 μm. b Cell viability of organoids from DKO and TKO prostate tumors treated with/without PP (n = 5 independent treated). c Schematic illustration showing the treatment and PET/CT imaging of TKO. d [18F]-FDG PET/CT imaging of TKO before and after indicated treatment. e Quantification of [18F]-FDG PET/CT signal by maximum standardized uptake value in TKO before and after indicated treatment (n = 3 per group). f Kaplan–Meier survival analysis of TKO treated with PP or PBS (PBS, n = 14; PP, n = 11). g, h Representative immunofluorescence staining and quantification of EdU and Elavl3 in tumors from TKO treated with PP or PBS. Scale bar, 50 μm. (PBS, n = 9; PP, n = 8). i, j Representative H&E, immunohistochemistry staining and quantification of Ki67 and cleaved-caspase 3 in tumors from TKO treated with PP or PBS. Scale bar, 50 μm. (n = 9 per group). k Representative H&E staining of lung and liver metastases from TKO treated with PP or PBS (n = 3 per group). Scale bar, 2 mm. l Summary of the liver and lung metastases from TKO treated with PP or PBS. m, n QPCR showing relative mRNA expression of indicated genes and western blot showing indicated protein expression in tumor tissues from TKO treated with PP or PBS (n = 3 per group). o Schematic showing that ELAVL3 is transcriptionally activated by MYCN, and then in turn binds to and stabilizes the mRNA of MYCN and RICTOR. ELAVL3 can be released into EVs and induce neuroendocrine differentiation of recipient cells. PP disrupts the interaction of ELAVL3 and MYCN, reduces ELAVL3-induced neuroendocrine differentiation, and provides a promising drug repurposing strategy for the treatment of NEPC. Data presented as mean ± s.e.m. (b, e, h, j, m). Statistical significance was determined by two-tailed unpaired Student’s t-test (b, e, h, j, m), or log-rank (Mantel-Cox) test (f). Western blot experiments were repeated three times independently, with similar results (n). Source data are provided as a Source Data file.

Similar articles

Cited by

References

    1. Davies AH, Beltran H, Zoubeidi A. Cellular plasticity and the neuroendocrine phenotype in prostate cancer. Nat. Rev. Urol. 2018;15:271–286. doi: 10.1038/nrurol.2018.22. - DOI - PubMed
    1. Watson PA, Arora VK, Sawyers CL. Emerging mechanisms of resistance to androgen receptor inhibitors in prostate cancer. Nat. Rev. Cancer. 2015;15:701–711. doi: 10.1038/nrc4016. - DOI - PMC - PubMed
    1. Chen CD, et al. Molecular determinants of resistance to antiandrogen therapy. Nat. Med. 2004;10:33–39. doi: 10.1038/nm972. - DOI - PubMed
    1. Dardenne E, et al. N-Myc induces an EZH2-mediated transcriptional program driving neuroendocrine prostate cancer. Cancer Cell. 2016;30:563–577. doi: 10.1016/j.ccell.2016.09.005. - DOI - PMC - PubMed
    1. Wang W, Epstein JI. Small cell carcinoma of the prostate: a morphologic and immunohistochemical study of 95 cases. Am. J. Surgical Pathol. 2008;32:65–71. doi: 10.1097/PAS.0b013e318058a96b. - DOI - PubMed

Publication types

Associated data