. 2023 Nov 28;14(1):7802.
doi: 10.1038/s41467-023-43282-3.

Proteomic characterization of epithelial ovarian cancer delineates molecular signatures and therapeutic targets in distinct histological subtypes

Affiliations

Proteomic characterization of epithelial ovarian cancer delineates molecular signatures and therapeutic targets in distinct histological subtypes

Ting-Ting Gong et al. Nat Commun. .

Abstract

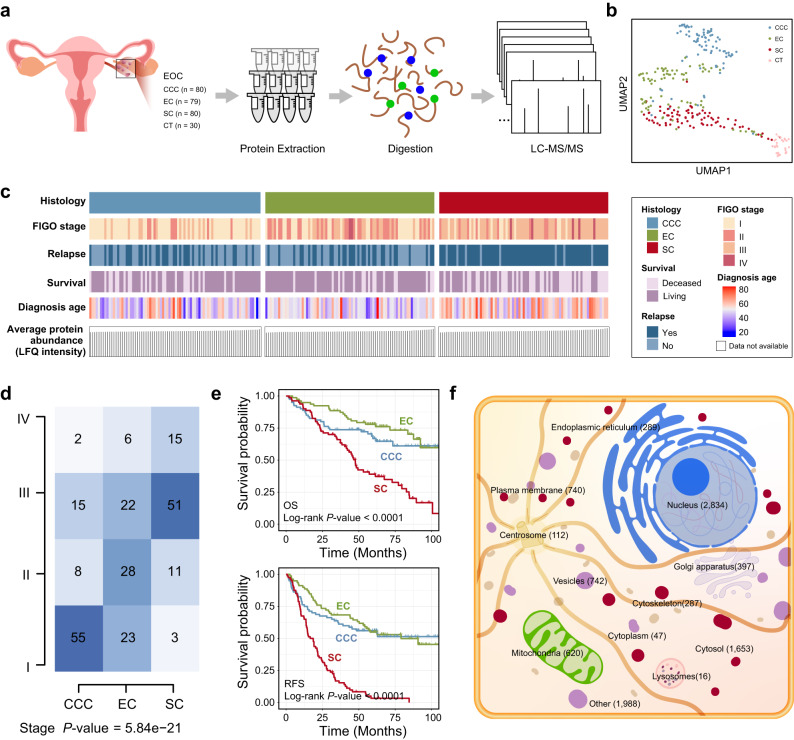
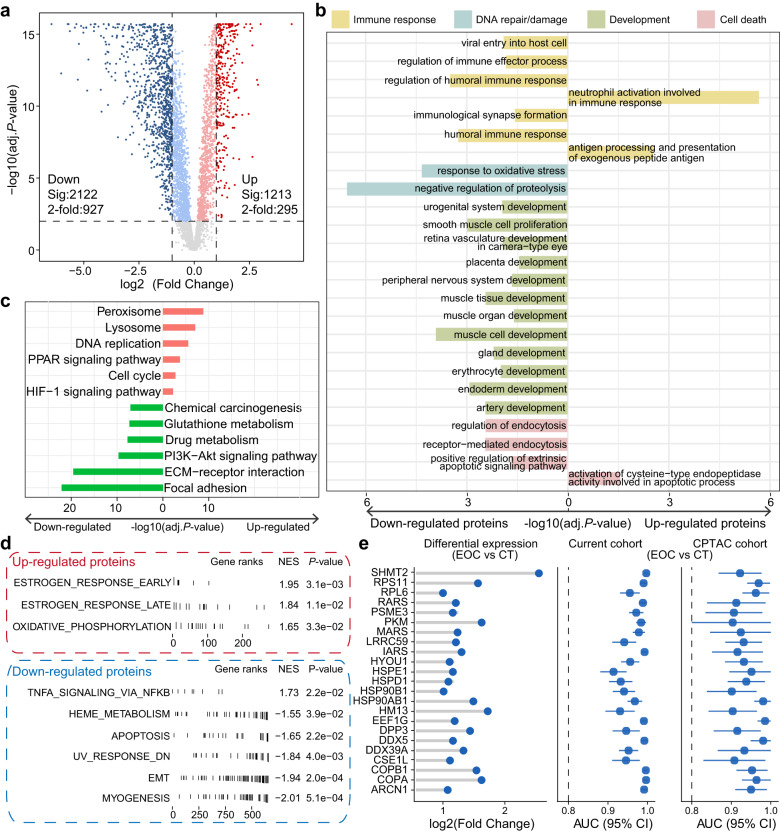
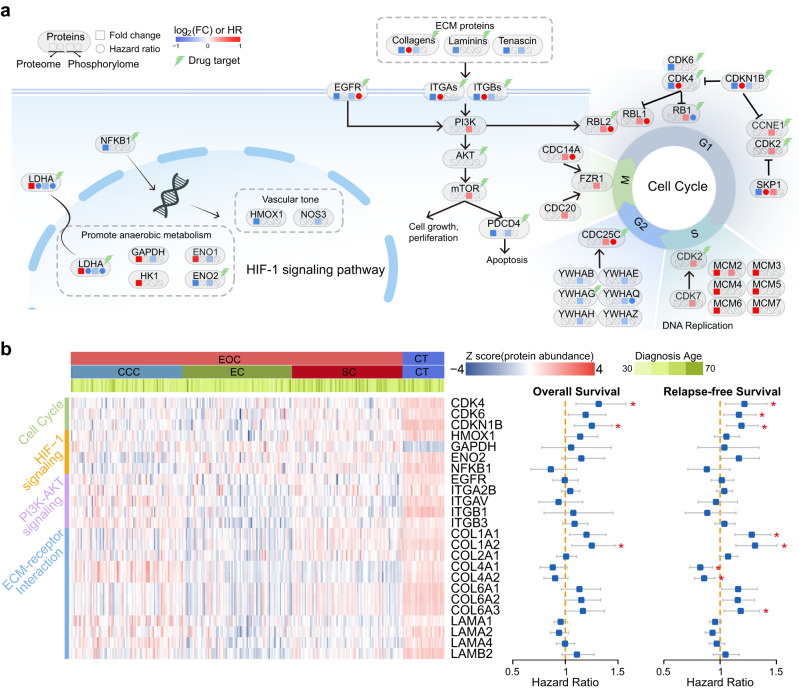
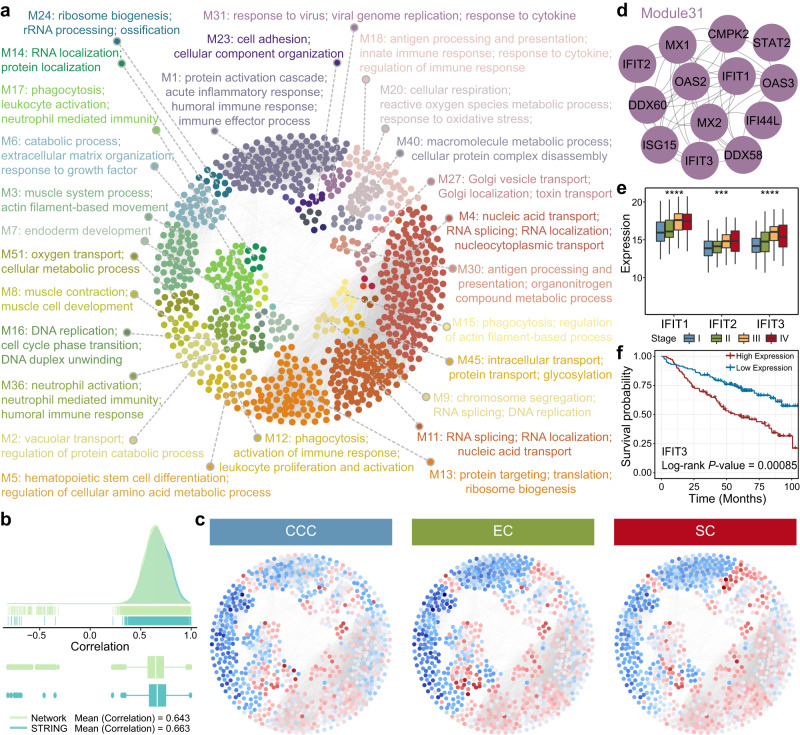
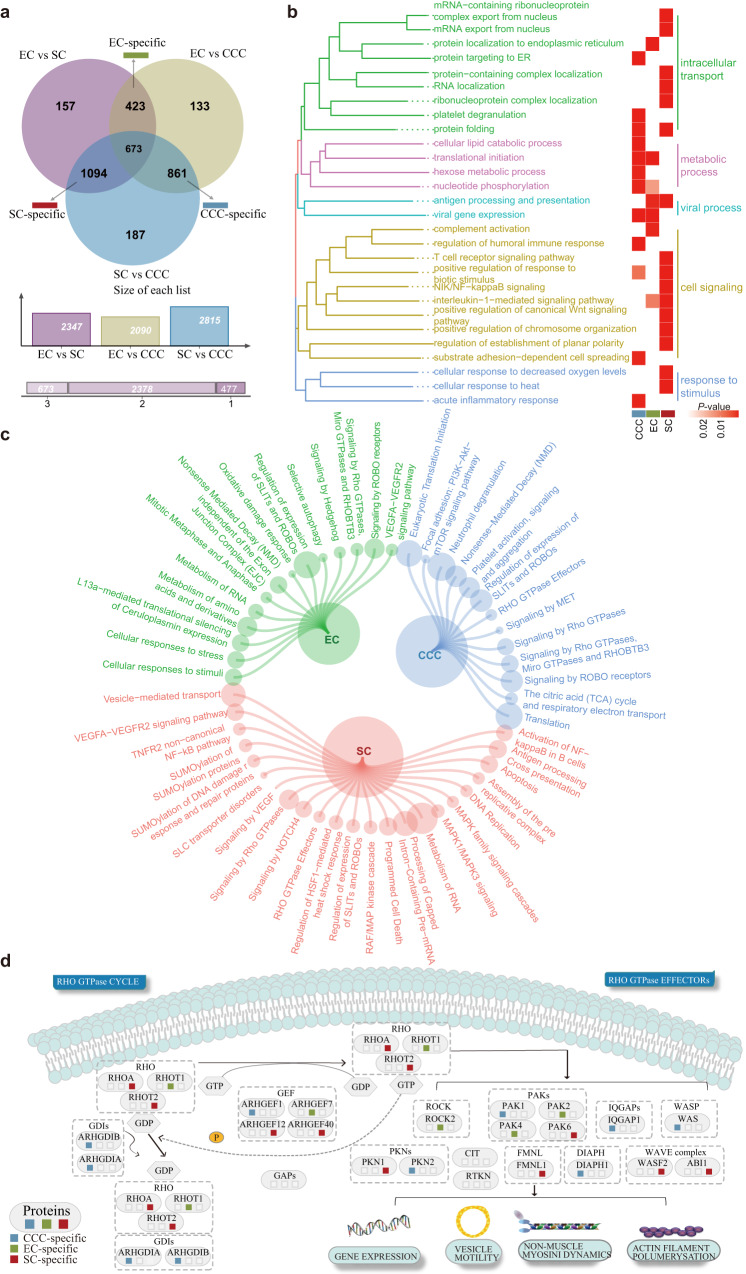
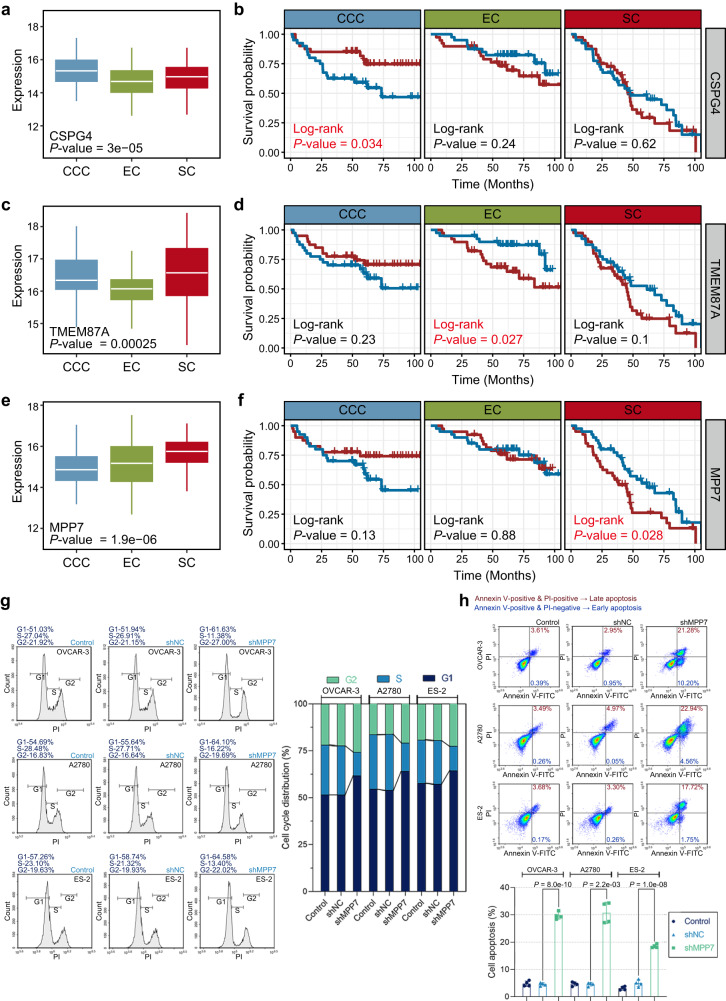
Clear cell carcinoma (CCC), endometrioid carcinoma (EC), and serous carcinoma (SC) are the major histological subtypes of epithelial ovarian cancer (EOC), whose differences in carcinogenesis are still unclear. Here, we undertake comprehensive proteomic profiling of 80 CCC, 79 EC, 80 SC, and 30 control samples. Our analysis reveals the prognostic or diagnostic value of dysregulated proteins and phosphorylation sites in important pathways. Moreover, protein co-expression network not only provides comprehensive view of biological features of each histological subtype, but also indicates potential prognostic biomarkers and progression landmarks. Notably, EOC have strong inter-tumor heterogeneity, with significantly different clinical characteristics, proteomic patterns and signaling pathway disorders in CCC, EC, and SC. Finally, we infer MPP7 protein as potential therapeutic target for SC, whose biological functions are confirmed in SC cells. Our proteomic cohort provides valuable resources for understanding molecular mechanisms and developing treatment strategies of distinct histological subtypes.


Conflict of interest statement

The authors declare no competing interests.

Figures

Fig. 1
Fig. 1. Proteome landscape in EOC histological subtypes.
a Overview of the experimental setup for MS-based proteome profiling. b UMAP plot of epithelial ovarian cancer (EOC) tumor and control tissue (CT) samples, color-coded by EOC histological subtypes. c Heatmap showing the clinical information and mean protein abundance of samples. d Differences in the abundance of EOC histological subtypes in terms of tumor stage. CCC samples (n = 80), EC samples (n = 79), and SC samples (n = 80). P values were calculated by two-sided Fisher’s exact test. e Kaplan–Meier plots of overall survival (OS) (Log-rank P value = 4e-08) and relapse-free survival (RFS) (Log-rank P value < 2e-16) for EOC histological subtypes. CCC samples (n = 80), EC samples (n = 79), and SC samples (n = 80). f Schematic diagram of protein subcellular localization. Icons were made by Freepik (https://www.freepik.com/home). Source data are provided as a Source Data file.
Fig. 2
Fig. 2. Dysregulated proteins and pathways were identified by proteomic analysis.
a Volcano plot showed the dysregulated proteins upregulated or downregulated in tumors. The adj.P values are calculated using two-sided Wilcoxon test (Benjamini & Hochberg (BH) adjusted P values). Pink and light blue colors represent proteins with adj.P values < 0.01, whereas dark red and blue represent proteins with adj.P values < 0.01 and |log2 (fold change)| >1. b Barplot colored by different categories show enriched biological processes (BPs) of dysregulated proteins. The adj.P values are calculated using hypergeometric test (BH adjusted P values). Left bars indicate BPs enriched in the downregulated proteins. Right bars indicate pathways enriched in the upregulated proteins. c Barplot of enriched KEGG pathways, with pink bars indicating pathways enriched in the upregulated proteins and green bars indicating pathways enriched in the downregulated proteins. The adj.P values are calculated using hypergeometric test (BH adjusted P values). d GSEA results show signatures evaluated in the context of marker sets representative for hallmarks of cancer. The statistical significance (nominal P value) of the enrichment score was calculated using an empirical phenotype-based permutation test procedure. e Lollipop plots show the fold-change value of proteins and forest plots show the area under curve (AUC) of these proteins. Current cohort: EOC samples (n = 239) and CT samples (n = 30). CPTAC cohort: EOC samples (n = 83) and CT samples (n = 20). The points and error bars show the AUC and 95% confidence interval (CI). Source data are provided as a Source Data file.
Fig. 3
Fig. 3. Signaling pathway disturbances in EOC suggest therapeutic opportunities.
a Abnormal proteins in the KEGG pathway. b Heatmap showing the expression of proteins in four pathways, and forest plots showing HRs of proteins using Cox analysis (BH adjusted P values). The asterisks represent Cox adj.P values, *adj.P values < 0.05 (adj.P values are shown in Supplementary Data 6). CCC samples (n = 80), EC samples (n = 79), SC samples (n = 80), and CT samples (n = 30). The points and error bars show the hazard ratio (HR) and 95% CI. Source data are provided as a Source Data file.
Fig. 4
Fig. 4. Protein co-expression network and tumor progression landmarks.
a Protein co-expression network of 896 nodes and 13,574 edges. Nodes are color-coded according to module membership. Representative enriched biological terms are shown for distinct modules. b Density plots of the pairwise protein–protein correlations for the interactions shown in the network. Number of interactions in Network (n = 13,574) and number of interactions in STRING (n = 5611). Boxplots show median (central line), upper and lower quartiles (box limits), min to max range. c Aberrant protein expression levels were superimposed on the network for each histological subtype. The red and blue dots represent up- and downregulated differentially expressed proteins, respectively. d Sub-network of Module31. e Boxplots illustrated the abundances of IFIT1 (P value = 3.3e-05), IFIT2 (P value = 8.7e-04), and IFIT3 (P value = 9.5e-07) in the different histological subtypes. The P values are calculated using Kruskal–Wallis test. The asterisk character represents the significance of the expression discrepancy, ***P value < 0.001 and ****P value < 0.0001. Stage I samples (n = 81), Stage II samples (n = 47), Stage III samples (n = 88), and Stage IV samples (n = 23). Boxplots show median (central line), upper and lower quartiles (box limits), min to max range. f The Kaplan–Meier survival curve for IFIT3. Source data are provided as a Source Data file.
Fig. 5
Fig. 5. Comparison and characterization of subtype-specific proteins.
a Venn diagram shows the overlap of differentially expressed proteins reported in different subtypes of EOC. b, c GO categories and molecular pathways enriched in differentially expressed subtype-specific proteins. CCC-specific proteins (n = 861), EC-specific proteins (n = 423), and SC-specific proteins (n = 1094). GO categories were grouped according to functional theme. The P values are calculated using hypergeometric test. d Subtype-specific proteins were enriched in the pathway of Signaling by Rho GTPases. Source data are provided as a Source Data file.
Fig. 6
Fig. 6. Potential therapeutic targets for distinct histological subtypes.
a, c, e Expression levels of CSPG4, TMEM87A, and MPP7 among the respective histological subtypes. CCC samples (n = 80), EC samples (n = 79), and SC samples (n = 80). The P values are calculated using the Kruskal–Wallis test. Boxplots show median (central line), upper and lower quartiles (box limits), min to max range. b, d, f Kaplan–Meier survival curves for patients expressing CSPG4, TMEM87A, and MPP7 in CCC, EC, and SC patients, respectively. CCC samples (n = 80), EC samples (n = 79), and SC samples (n = 80). Among them, the red line represents highly expressed protein and the blue line represents lowly expressed protein. g OVCAR-3, A2780, and ES-2 cells were infected with lentiviral vectors carrying shMPP7 or shNC. Cell cycle distribution was analyzed by flow cytometry at 48 h after infection. h Cell apoptosis was measured by Annexin V-FITC/PI staining at 48 h after infection. The count of Annexin V-FITC-positive and PI-positive cells (Late apoptosis) and Annexin V-FITC-positive and PI-negative cells (Early apoptosis) was assessed by flow cytometry. Data are presented by mean ± standard deviation and analyzed by the one-way analysis of variance (ANOVA) followed by Tukey’s tests or the Brown–Forsythe and Welch ANOVA tests followed by Tamhane T2 tests. The flow cytometry experiments were repeated four times. Source data are provided as a Source Data file.

References

    1. Desai A, et al. Epithelial ovarian cancer: an overview. World J. Transl. Med. 2014;3:1–8. doi: 10.5528/wjtm.v3.i1.1. - DOI - PMC - PubMed
    1. Hohn AK, et al. 2020 WHO classification of female genital tumors. Geburtshilfe Frauenheilkd. 2021;81:1145–1153. doi: 10.1055/a-1545-4279. - DOI - PMC - PubMed
    1. Siegel RL, Miller KD, Jemal A. Cancer statistics, 2018. CA Cancer J. Clin. 2018;68:7–30. doi: 10.3322/caac.21442. - DOI - PubMed
    1. Cancer Genome Atlas Research N. The Cancer Genome Atlas Pan-Cancer analysis project. Nat. Genet. 2013;45:1113–1120. doi: 10.1038/ng.2764. - DOI - PMC - PubMed
    1. Cancer Genome Atlas Research N. Integrated genomic analyses of ovarian carcinoma. Nature. 2011;474:609–615. doi: 10.1038/nature10166. - DOI - PMC - PubMed

Publication types

LinkOut - more resources