. 2023 Nov 28;14(1):7816.
doi: 10.1038/s41467-023-43440-7.

Label-free identification of protein aggregates using deep learning

Affiliations

Label-free identification of protein aggregates using deep learning

Khalid A Ibrahim et al. Nat Commun. .

Abstract

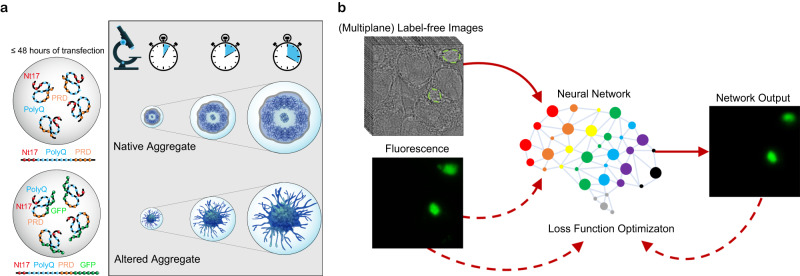
Protein misfolding and aggregation play central roles in the pathogenesis of various neurodegenerative diseases (NDDs), including Huntington's disease, which is caused by a genetic mutation in exon 1 of the Huntingtin protein (Httex1). The fluorescent labels commonly used to visualize and monitor the dynamics of protein expression have been shown to alter the biophysical properties of proteins and the final ultrastructure, composition, and toxic properties of the formed aggregates. To overcome this limitation, we present a method for label-free identification of NDD-associated aggregates (LINA). Our approach utilizes deep learning to detect unlabeled and unaltered Httex1 aggregates in living cells from transmitted-light images, without the need for fluorescent labeling. Our models are robust across imaging conditions and on aggregates formed by different constructs of Httex1. LINA enables the dynamic identification of label-free aggregates and measurement of their dry mass and area changes during their growth process, offering high speed, specificity, and simplicity to analyze protein aggregation dynamics and obtain high-fidelity information.


Conflict of interest statement

H.A.L. has received funding from the industry to support research on neurodegenerative diseases, including from Merck Serono, UCB, and Abbvie. These companies had no specific role in the conceptualization, preparation, and decision to publish this work. H.A.L. is also the co-founder and Chief Scientific Officer of ND BioSciences SA, a company that develops diagnostics and treatments for neurodegenerative diseases based on platforms that reproduce the complexity and diversity of proteins implicated in neurodegenerative diseases and their pathologies. All remaining authors declare no competing interests.

Figures

Fig. 1
Fig. 1. Label-free identification of NDD-associated aggregates (LINA).
a The NDD-associated Httex1 protein forms aggregates in cells within 48 h. When the protein is unlabeled, these aggregates have a core and shell ultrastructure. Labeled Httex1 (e.g., with GFP) forms altered aggregates that lack this structure, instead resembling a mesh of fibrils, and have altered biochemical and biophysical properties (e.g., different proteome composition, stiffness, and fibril length). b To enable label-free imaging of unaltered Httex1 aggregates, we trained a neural network to map between label-free transmitted-light (brightfield or quantitative phase) image inputs (single or multiple planes) and fluorescence images, such that the network is then able to identify aggregates using only the label-free input. Dashed arrows represent training-only steps.
Fig. 2
Fig. 2. Validation of deep learning models for label-free identification of Httex1 protein aggregates.
a Convolutional neural networks for both pixel classification and regression have been trained using pixel-registered pairs of eight-plane quantitative phase images and maximum-projected eight-plane fluorescence images or corresponding segmented masks. The eight-plane input images are represented by a color-coded maximum z-projection image; the aggregate in the image is highlighted by the dashed square and is shown magnified. The phase signal was thresholded (T = 0 rad) prior to color-coding to enhance the contrast. The labels used are generated as the maximum z-projection of the fluorescence images in the eight planes for the pixel regression network and the corresponding segmented masks (Otsu thresholding) for pixel classification. b Test set prediction example, with images of the phase, fluorescence, network output, and a merge of all three, showing where the three images colocalize in white. This example is representative of the other examples in the test set (n = 105 acquisitions from three independent experiments). c Quantitative validation of the pixel regression model using the Pearson correlation coefficient (r), showing a high correlation with the ground truth (~0.96 mean). d The regression network was further validated on label-free Httex1 aggregates. Despite being trained only on a 72Q-GFP construct of Httex1, the model works well on label-free constructs of different polyQ repeat lengths (39Q, 72Q) and types (72Q with a truncated Nt17 domain). This validation was repeated over three independent experiments. Scale bars: 5 µm.
Fig. 3
Fig. 3. Generalizability of LINA to a different cell line.
a Pearson correlation coefficient (r), computed only on the regions where there are aggregates. The metric is computed for the eight-plane-QPI pixel-regression model. b Normalized mean squared error, computed only on the regions where there are aggregates. The metric is computed for the eight-plane-QPI pixel-regression model. Both metrics show that LINA is able to accurately recognize aggregates expressed in a different cell line (HeLa). c, d Example images visualizing the model’s performance on aggregates expressed in HeLa cells. c The example with the best r-value is shown. d The example with the lowest r value is shown. Scale bars: 5 µm.
Fig. 4
Fig. 4. Automatic image acquisition, identification, and dry mass quantification of different kinds of label-free Httex1 aggregates.
a A motorized piezo nano-positioning stage is controlled using software to scan the sample in the x and y directions and collect images at various fields of view (FOVs) for different label-free constructs of Httex1 (39Q, 72Q, ΔNt17-72Q) and a GFP-labeled construct (72Q-GFP). b The images are post-processed and our trained model is used to identify FOVs that contain aggregates. c The dry mass of aggregates produced by different constructs of Httex1 is extracted from the quantitative phase images, as shown in the inset image (n = 39 for 39Q, n = 29 for 72Q, n = 30 for ΔNt17-72Q, and n = 64 for 72Q-GFP). ΔNt17-72Q and 72Q had similar dry mass distributions (unpaired, two-sided t-test resulted in a p-value of 0.40), however, both label-free constructs had smaller dry masses on average than 39Q (unpaired, two-sided t-test p-values of 0.0008 and 0.0085 for 72Q and ΔNt17-72Q, respectively), and all three had smaller dry masses than the labeled 72Q-GFP (unpaired, two-sided t-test p-value = 0.00012 for 39Q, 2.8e−12 for 72Q, and 2.1e−10 for ΔNt17-72Q). ns: p > 0.05, **p ≤ 0.01, ***p ≤ 0.001, ****p ≤ 0.0001. White dots represent the medians, thick bars represent the interquartile ranges, and thin lines represent 1.5× the interquartile ranges. Scale bars: 5 µm.
Fig. 5
Fig. 5. Live, label-free identification and analysis of Httex1 protein aggregation.
a Time-lapse images, acquired every 2 min, of Httex1-72Q-GFP in a HEK cell, starting from a diffuse protein state and aggregating over time. LINA is able to distinguish between the diffuse protein and the aggregated state, correctly predicting the aggregate as it grows in size and moves along different subcellular localizations. Scale bar: 5 µm. b Normalized mean intensity of the network output images as the aggregate grows, following a three-regime sigmoidal behavior. c Dry mass and area changes extracted from the network output images, split into the same three regimes. b, c Error bars represent the standard deviation in each image. The data shown is for one field of view as the aggregate forms.

References

    1. Forman MS, Trojanowski JQ, Lee VM-Y. Neurodegenerative diseases: a decade of discoveries paves the way for therapeutic breakthroughs. Nat. Med. 2004;10:1055–1063. doi: 10.1038/nm1113. - DOI - PubMed
    1. Hansson O. Biomarkers for neurodegenerative diseases. Nat. Med. 2021;27:954–963. doi: 10.1038/s41591-021-01382-x. - DOI - PubMed
    1. Soto C. Unfolding the role of protein misfolding in neurodegenerative diseases. Nat. Rev. Neurosci. 2003;4:49–60. doi: 10.1038/nrn1007. - DOI - PubMed
    1. Ross CA, Poirier MA. Protein aggregation and neurodegenerative disease. Nat. Med. 2004;10:10–17. doi: 10.1038/nm1066. - DOI - PubMed
    1. Goedert M. Alzheimer’s and Parkinson’s diseases: the prion concept in relation to assembled Aβ, tau, and α-synuclein. Science. 2015;349:1255555. doi: 10.1126/science.1255555. - DOI - PubMed

Publication types