. 2023 Nov 27;13(1):20922.
doi: 10.1038/s41598-023-48100-w.

A multiscale accuracy assessment of moisture content predictions using time-lapse electrical resistivity tomography in mine tailings

Affiliations

A multiscale accuracy assessment of moisture content predictions using time-lapse electrical resistivity tomography in mine tailings

Adrien Dimech et al. Sci Rep. .

Abstract

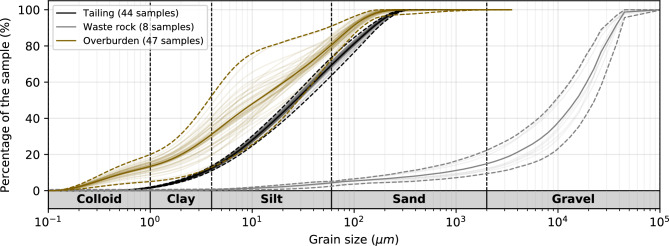
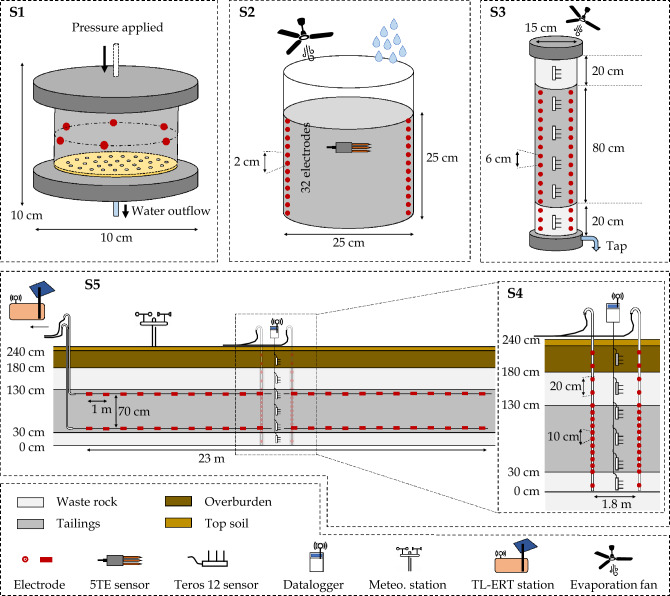
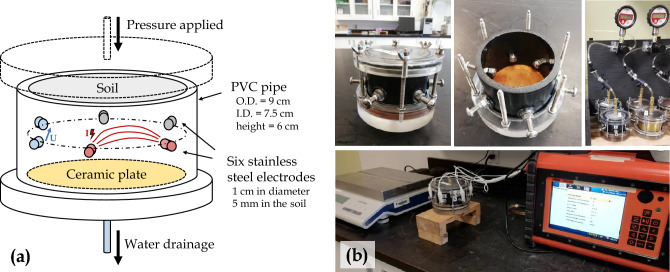
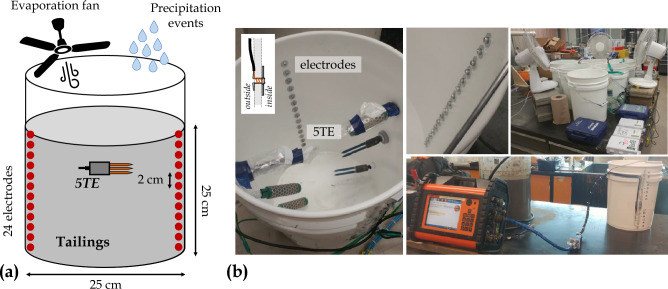
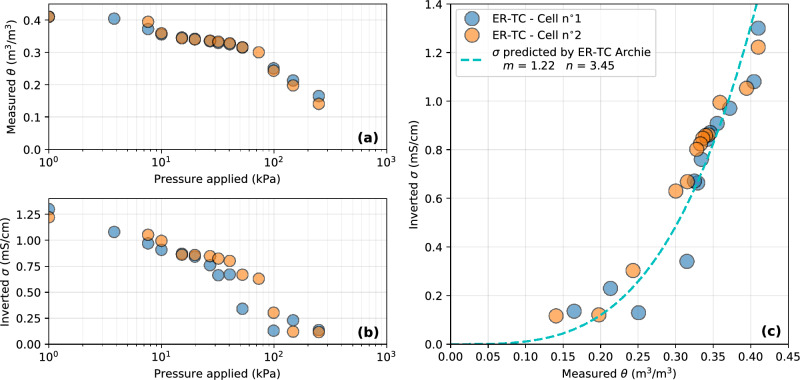
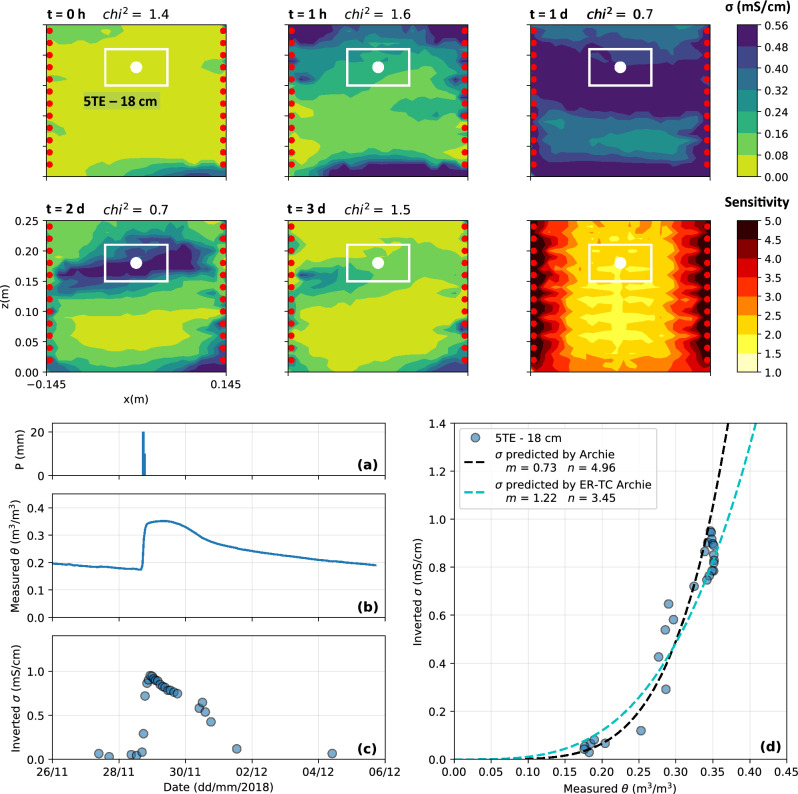
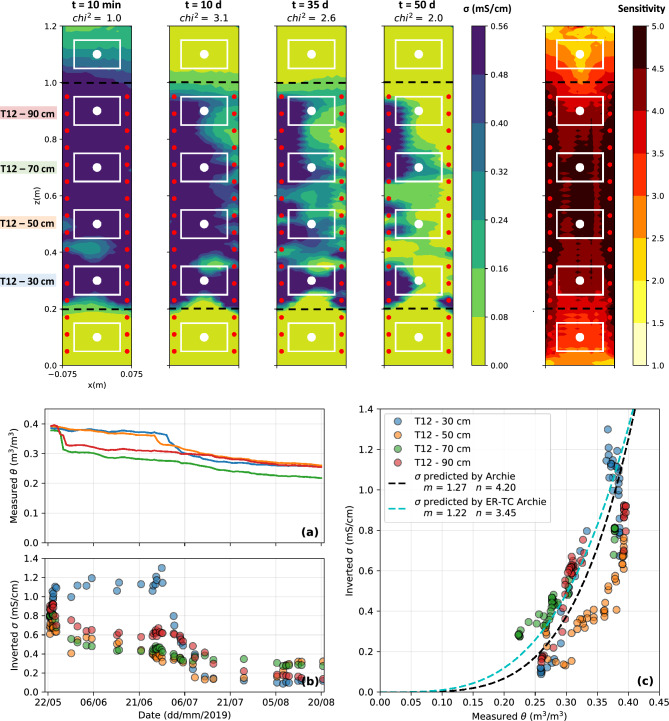
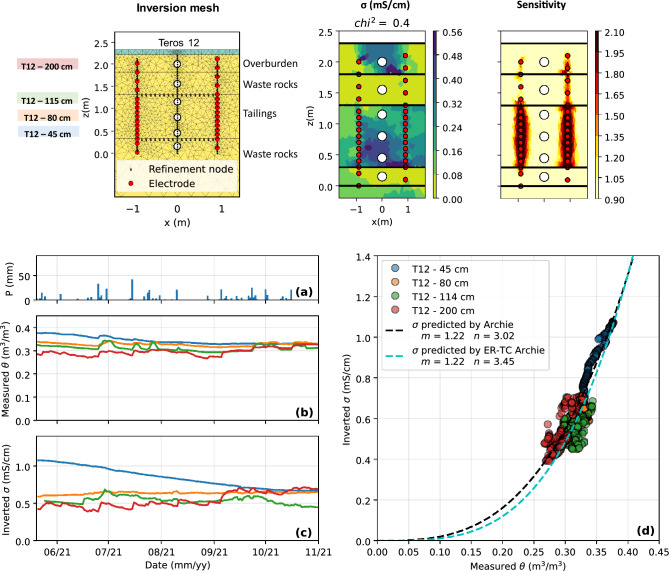
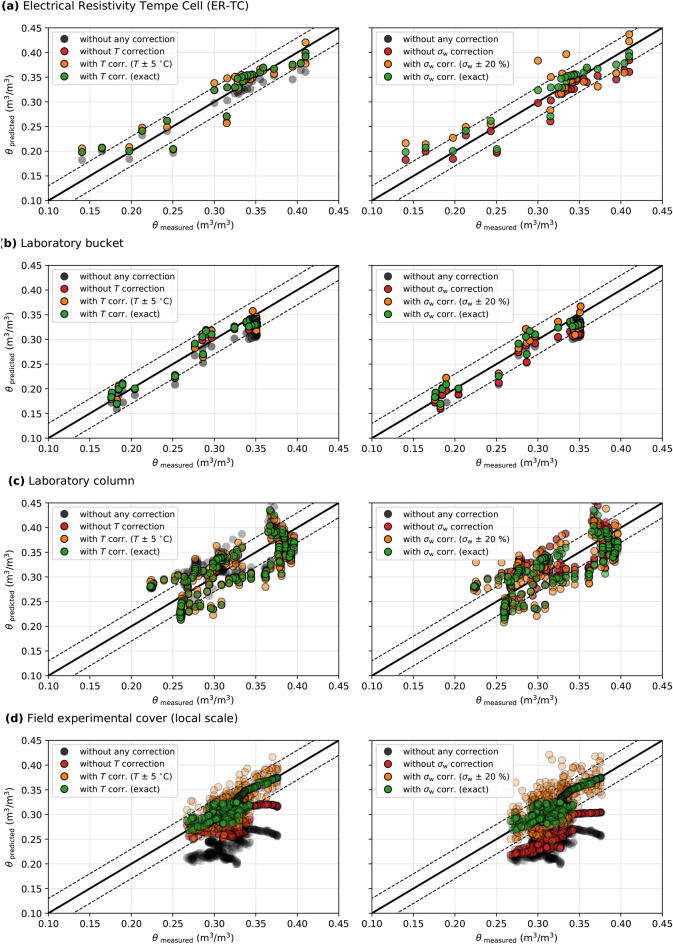
Accurate and large-scale assessment of volumetric water content (VWC) plays a critical role in mining waste monitoring to mitigate potential geotechnical and environmental risks. In recent years, time-lapse electrical resistivity tomography (TL-ERT) has emerged as a promising monitoring approach that can be used in combination with traditional invasive and point-measurements techniques to estimate VWC in mine tailings. Moreover, the bulk electrical conductivity (EC) imaged using TL-ERT can be converted into VWC in the field using petrophysical relationships calibrated in the laboratory. This study is the first to assess the scale effect on the accuracy of ERT-predicted VWC in tailings. Simultaneous and co-located monitoring of bulk EC and VWC are carried out in tailings at five different scales, in the laboratory and in the field. The hydrogeophysical datasets are used to calibrate a petrophysical model used to predict VWC from TL-ERT data. Overall, the accuracy of ERT-predicted VWC is [Formula: see text], and the petrophysical models determined at sample-scale in the laboratory remain valid at larger scales. Notably, the impact of temperature and pore water EC evolution plays a major role in VWC predictions at the field scale (tenfold reduction of accuracy) and, therefore, must be properly taken into account during the TL-ERT data processing using complementary hydrogeological sensors. Based on these results, we suggest that future studies using TL-ERT to predict VWC in mine tailings could use sample-scale laboratory apparatus similar to the electrical resistivity Tempe cell presented here to calibrate petrophysical models and carefully upscale them to field applications.


Conflict of interest statement

The authors declare no competing interests.

Figures

Figure 1
Figure 1
Grain size distribution of the materials used in the experiment. In total, 44 different samples of tailings (black), 8 samples of waste rocks (grey) and 47 samples of overburden (brown) have been analyzed. Each individual grain size distribution is shown using shaded lines. The mean, minimum and maximum grain size distributions are shown in solid line and dashed lines.
Figure 2
Figure 2
Illustration of the five scales investigated in this study to assess petrophysical relationships in mine tailings in the laboratory (S1—cell scale, S2—bucket scale and S3—column scale), and in the field (S4 - local scale and S5 - pilot scale).
Figure 3
Figure 3
(a) Schematic view of the electrical-resistivity tempe cell (ER-TC) used in the experiment. (b) Photographs showing the ER-TC, the porous ceramic plate, the six stainless steel electrodes and the ABEM Terrameter LS resistivity meter.
Figure 4
Figure 4
(a) Schematic view of the laboratory bucket used in the experiment. (b) Photographs show the electrodes and 5TE sensor location in the bucket as well as the monitoring devices (EM50 dataloggers and ABEM Terrameter LS). Several fans were used to accelerate evaporation and precipitation events were carried out to mimic realistic meteorological conditions.
Figure 5
Figure 5
(a) Schematic view of the laboratory column used in the experiment. (b) Photographs showing the different steps of column assembling, the connection of the Teros 12 hydrogeological sensors to the ZL6 datalogger and the connection of electrodes to Terrameter LS.
Figure 6
Figure 6
(a) Schematic description of the experimental cover at local scale. Location of hydrogeophysical monitoring instruments (moisture sensors and electrodes in red). (b) Photographs show the cover construction and instrument installation within the different materials. The meteorological station and the hydrogeological dataloggers at the surface are also shown (top right).
Figure 7
Figure 7
(a) Schematic description of the pilot-scale experimental cover and location of hydrogeophysical monitoring instruments. The electrodes along horizontal profiles in the tailings are represented in red. (b) Photographs show the cover construction, electrode design and instrument installation within the different materials. The bottom right photographs show the PRIME instrument located in a container which is used to carry out autonomous remote hydrogeophysical monitoring.
Figure 8
Figure 8
Workflow of hydrogeophysical data acquisition and processing used to recover petrophysical relationships from multi-scale experimental setups. The laboratory column (scale 3) is used as an example.
Figure 9
Figure 9
Results from the monitoring of the Electrical Resistivity Tempe Cells (scale 1). Evolution of (a) measured VWC and (b) inverted bulk EC in the tailings for several pressure steps. (c) Relationship between VWC and bulk EC in the ER-TC.
Figure 10
Figure 10
Top panel: 2D slices of the 3D inverted bulk EC distribution and sensitivity for the laboratory bucket (scale S2) at selected time steps. The VWC sensor location is indicated by a white dot and the white rectangle corresponds to its volume of investigation, where inverted bulk EC is extracted to be compared with VWC measurements. Bottom panel: evolution of (a) artificial precipitations, (b) VWC and (c) inverted bulk EC in the tailings during the artificial precipitation event and (d) petrophysical relationship between VWC and bulk EC in the bucket.
Figure 11
Figure 11
Top panel: 2D slices of the 3D inverted bulk EC distribution and sensitivity for the laboratory column (scale S3) at selected time steps. The VWC sensor location is indicated by white dots and the white rectangles correspond to their volumes of investigation. Bottom panel: evolution of (a) VWC and (b) inverted bulk EC in the tailings during the artificial precipitation event and (c) petrophysical relationship between VWC and bulk EC in the bucket.
Figure 12
Figure 12
Top panel: inversion mesh, 2D inverted bulk EC distribution and sensitivity in the experimental field cover at local scale (scale S4) for a representative time step. The VWC sensors are indicated by white dots and electrodes correspond to red dots. Bottom panel: evolution of (a) precipitations, (b) VWC and (c) inverted bulk EC in the tailings from May to November 2021 and (d) relationship between VWC and bulk EC in the experimental CCBE cover at local scale.
Figure 13
Figure 13
Top panel: inversion mesh, 2D inverted bulk EC distribution and sensitivity in the experimental field cover at pilot scale (scale S5) for a representative time step. The VWC sensors are indicated by white dots and electrodes correspond to red dots. Bottom panel: evolution of (a) precipitations, (b) VWC and (c) inverted bulk EC in the tailings from May to November 2021 and (d) relationship between VWC and bulk EC in the experimental CCBE cover at pilot scale.
Figure 14
Figure 14
Influence of temperature and pore water EC corrections on the accuracy of ERT-predicted VWC for (a) Scale S1 - Electrical Resistivity Tempe Cell, (b) Scale S2 - laboratory bucket, (c) Scale S3 - Laboratory column and (d) Scale S4 - Field cover at local scale (similar results for scale S5 not shown here). The 1:1 line indicates a perfect match between ERT-predicted and measured VWC and the black dashed lines indicate an error of ±0.03m3/m3.
Figure 15
Figure 15
Assessment of the scale influence on petrophysical models and on the accuracy of ERT-predicted VWC. Top left - Comparison of the petrophysical models calibrated using hydrogeophysical datasets from scales S1 to S5. Top right - Histograms of the error between measured and ERT-predicted VWC using data and petrophysical models from different scales. Bottom panel - RMSE, bias and standard deviation of VWC prediction errors using ERT data and petrophysical models from different scales.

References

    1. Robinson DA, et al. Advancing process-based watershed hydrological research using near-surface geophysics: A vision for, and review of, electrical and magnetic geophysical methods. Hydrol. Process. Int. J. 2008;22(18):3604–3635. doi: 10.1002/hyp.6963. - DOI
    1. Beff L, et al. Three-dimensional monitoring of soil water content in a maize field using Electrical Resistivity Tomography. Hydrol. Earth Syst. Sci. 2013;17(2):595–609. doi: 10.5194/hess-17-595-2013. - DOI
    1. Vereecken, H. et al. On the value of soil moisture measurements in vadose zone hydrology: A review. In: Water resources research, 44(4), (2008). ISSN: 1944-7973.
    1. Brocca L, et al. Soil moisture estimation through ASCAT and AMSR-E sensors: An intercomparison and validation study across Europe. Remote Sens. Environ. 2011;115(12):3390–3408. doi: 10.1016/j.rse.2011.08.003. - DOI
    1. Dorigo W, et al. ESA CCI soil moisture for improved earth system understanding: State-of-the art and future directions. Remote Sens. Environ. 2017;203:185–215. doi: 10.1016/j.rse.2017.07.001. - DOI