. 2023 Nov 28;13(1):20888.
doi: 10.1038/s41598-023-48213-2.

Single cell and spatial transcriptomics analysis of kidney double negative T lymphocytes in normal and ischemic mouse kidneys

Affiliations

Single cell and spatial transcriptomics analysis of kidney double negative T lymphocytes in normal and ischemic mouse kidneys

Sepideh Gharaie et al. Sci Rep. .

Abstract

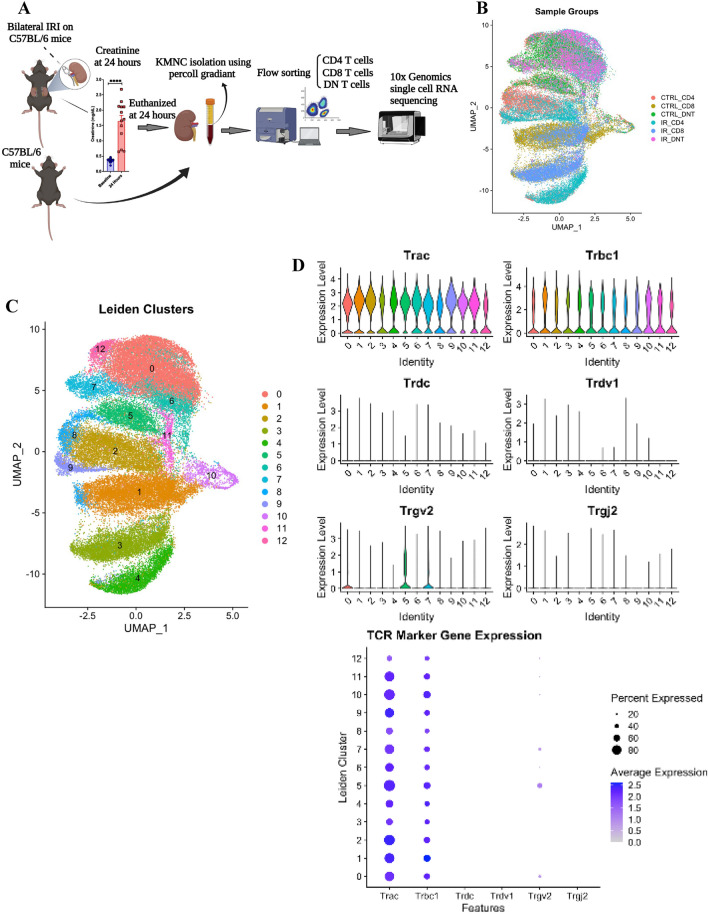
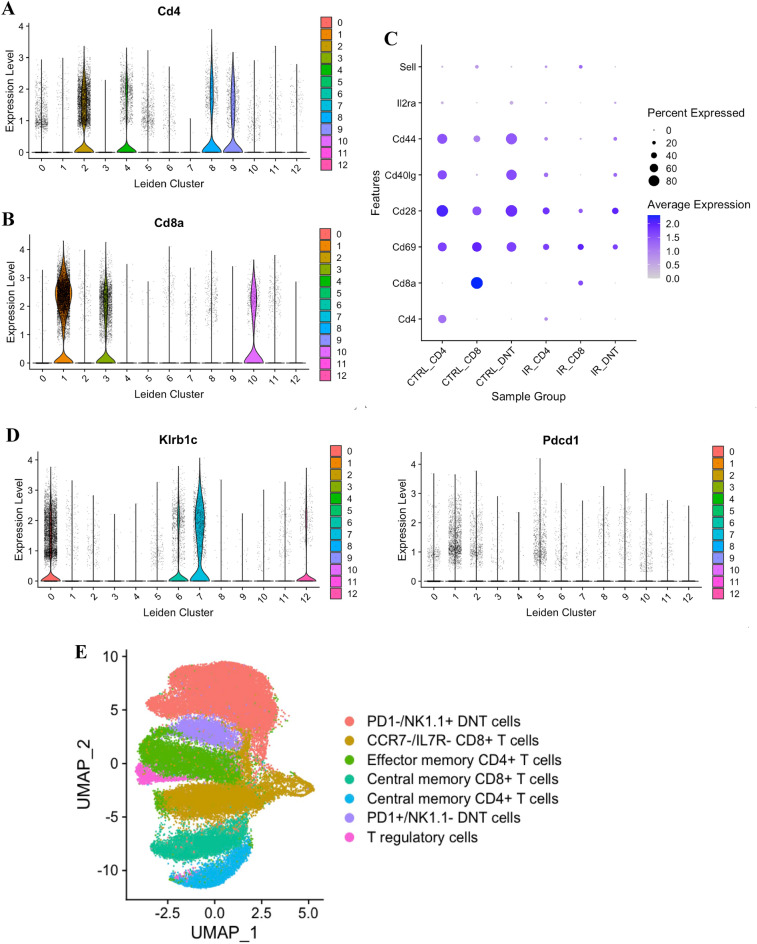
T cells are important in the pathogenesis of acute kidney injury (AKI), and TCR+CD4-CD8- (double negative-DN) are T cells that have regulatory properties. However, there is limited information on DN T cells compared to traditional CD4+ and CD8+ cells. To elucidate the molecular signature and spatial dynamics of DN T cells during AKI, we performed single-cell RNA sequencing (scRNA-seq) on sorted murine DN, CD4+, and CD8+ cells combined with spatial transcriptomic profiling of normal and post AKI mouse kidneys. scRNA-seq revealed distinct transcriptional profiles for DN, CD4+, and CD8+ T cells of mouse kidneys with enrichment of Kcnq5, Klrb1c, Fcer1g, and Klre1 expression in DN T cells compared to CD4+ and CD8+ T cells in normal kidney tissue. We validated the expression of these four genes in mouse kidney DN, CD4+ and CD8+ T cells using RT-PCR and Kcnq5, Klrb1, and Fcer1g genes with the NIH human kidney precision medicine project (KPMP). Spatial transcriptomics in normal and ischemic mouse kidney tissue showed a localized cluster of T cells in the outer medulla expressing DN T cell genes including Fcer1g. These results provide a template for future studies in DN T as well as CD4+ and CD8+ cells in normal and diseased kidneys.


Conflict of interest statement

The authors declare no competing interests.

Figures

Figure 1
Figure 1
Single-cell transcriptomic analysis of T lymphocyte cells in murine normal and ischemic kidneys. (A) Experimental design and serum creatinine at the baseline and 24 h after bilateral ischemia reperfusion (IR) injury. (B) Uniform manifold approximation and projection (UMAP) graph from six cell types: control (ctrl) CD4+, ctrl- CD8+, ctrl- DN cells, IR- CD4+, IR- CD8+, and IR- DN T cells. (C) Detection of expression of T cell receptor (TCR)αβ+ in all clusters using Trac and Trbc1 markers. (D) Detection of expression of TCRδ and TCRγ in some clusters using Trdc, Trdv1, Tcrg-c, Trgj2, and Trgv2 markers.
Figure 2
Figure 2
Identification of kidney T cell subtypes. (A) Expression of CD4+ and (B) CD8+ in different UMAP clusters. (C) Expression of T cell markers on control and ischemic CD4+, CD8+, and double negative (DN) T cells. (D) Identification of natural killer (NK)1.1+ and programmed cell death protein 1 (PD1+). (E) Final annotated UMAP for different cell types.
Figure 3
Figure 3
Comparison of gene expressions between the cell types. (A) Heat map of top differentially expressed genes for control CD4 vs CD8 vs DNT. (B) Validation of gene expression in control CD4, CD8, and DN T cells with a significantly higher expression in potassium voltage-gated channel subfamily Q member 5 (Kcnq5) and killer cell lectin like receptor B member 1 C (Klrb1c) DN T cells compared with CD4+ and CD8+ T cells. (C) Heat map of top differentially expressed genes for control DN vs ischemic DN T cells. (D) Validation of gene expression in control DN and ischemic DN T cells with significantly higher expression of Kcnq5 and Klrb1c genes in control DN T cells compared to the ischemic DN T cells. Data in C displayed as mean ± SEM.; multiple comparisons by one-way ANOVA *P < 0.05 and **P < 0.01, data in (D) displayed as mean ± SEM.; multiple unpaired t test *P < 0.05.
Figure 4
Figure 4
Spatial organization of putative DNT cells in normal and ischemic injury kidney samples. (A). Schematic showing the workflow of generating each 10X Visium spatial dataset. (B). Deconvolved cell type spot proportions for Visium data of normal (top) or ischemic (bottom) kidney tissue sections represented as pie charts. (C). Heatmap of scaled gene expression for Fc Epsilon Receptor Ig (Fcer1g) and Cd44 across the deconvolved cell types. (D). Spot proportions of normal kidney cell type 10 and 11 (top) and ischemic injury cell type 4, 7, and 12 (bottom). (E). Counts per million normalized gene counts in each spot of the normal and ischemic kidney Visium datasets for Fcer1g and Cd44.

References

    1. Lee SA, Cozzi M, Bush EL, Rabb H. Distant organ dysfunction in acute kidney injury: A review. Am. J. Kidney Dis. 2018;72:846–856. doi: 10.1053/j.ajkd.2018.03.028. - DOI - PMC - PubMed
    1. Chertow GM, Burdick E, Honour M, Bonventre JV, Bates DW. Acute kidney injury, mortality, length of stay, and costs in hospitalized patients. J. Am. Soc. Nephrol. 2005;16:3365–3370. doi: 10.1681/asn.2004090740. - DOI - PubMed
    1. Tang C, et al. Mitochondrial quality control in kidney injury and repair. Nat. Rev. Nephrol. 2021;17:299–318. doi: 10.1038/s41581-020-00369-0. - DOI - PMC - PubMed
    1. Nath KA, Norby SM. Reactive oxygen species and acute renal failure. Am. J. Med. 2000;109:665–678. doi: 10.1016/s0002-9343(00)00612-4. - DOI - PubMed
    1. GharaieFathabad S, et al. T lymphocytes in acute kidney injury and repair. Semin. Nephrol. 2020;40:114–125. doi: 10.1016/j.semnephrol.2020.01.003. - DOI - PubMed