. 2024 Mar;38(3):557-569.
doi: 10.1038/s41375-023-02095-5. Epub 2023 Nov 28.

Chronic lymphocytic leukemia patient-derived xenografts recapitulate clonal evolution to Richter transformation

Affiliations

Chronic lymphocytic leukemia patient-derived xenografts recapitulate clonal evolution to Richter transformation

Heribert Playa-Albinyana et al. Leukemia. 2024 Mar.

Abstract

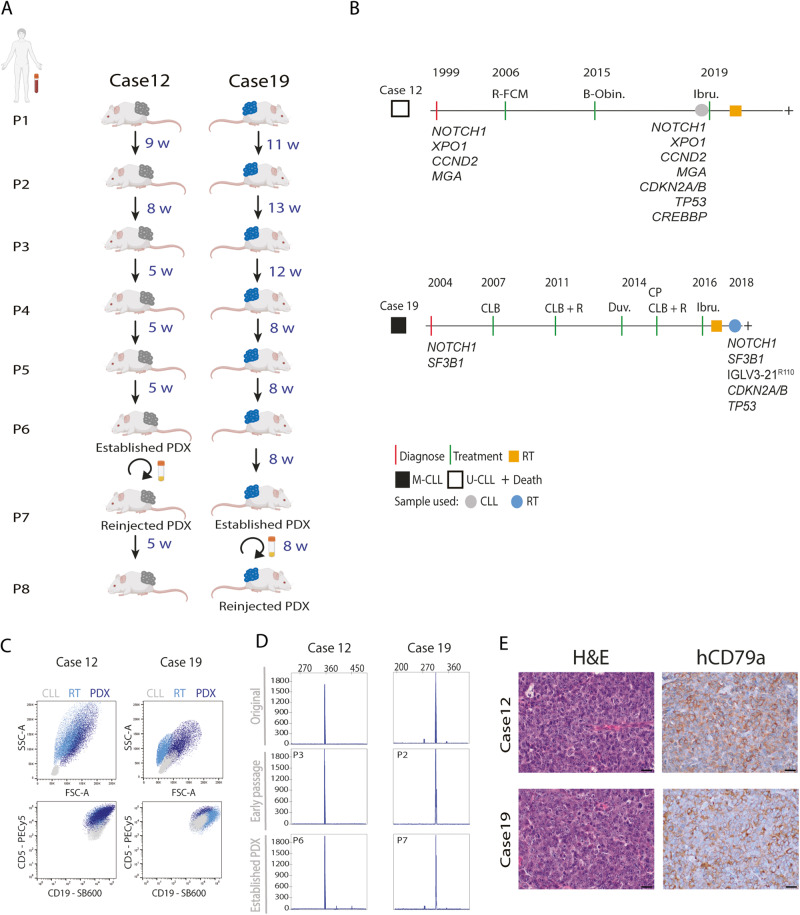
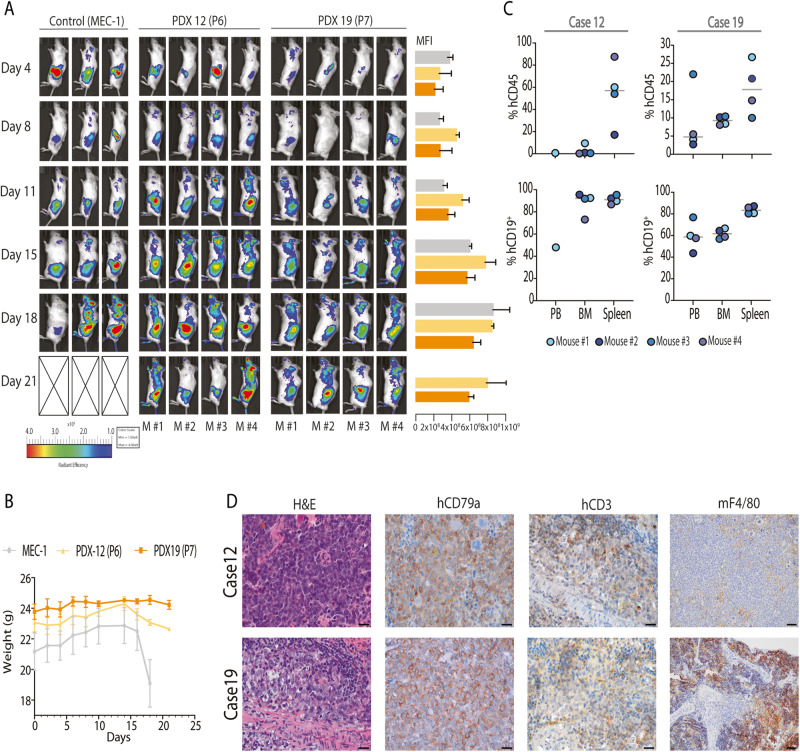
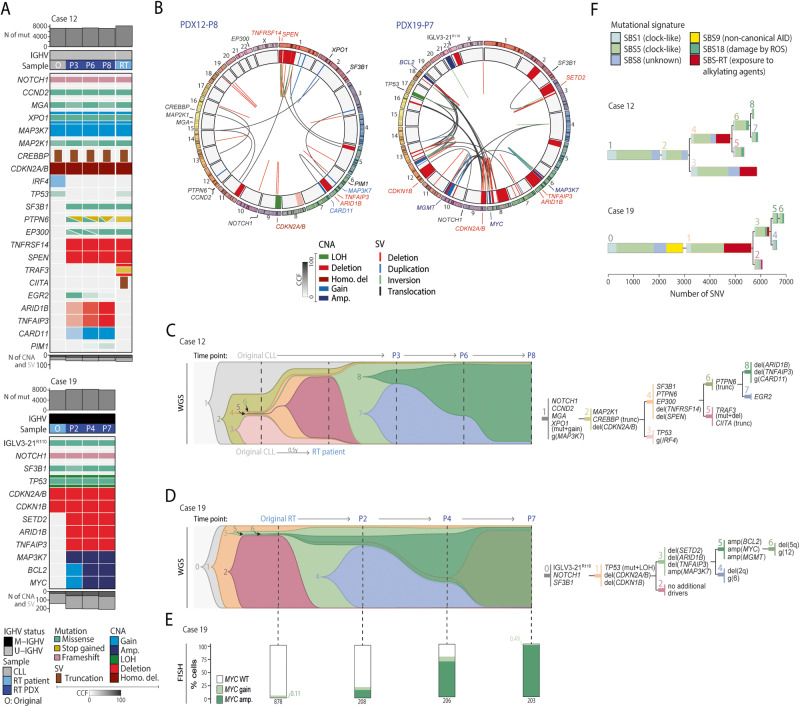
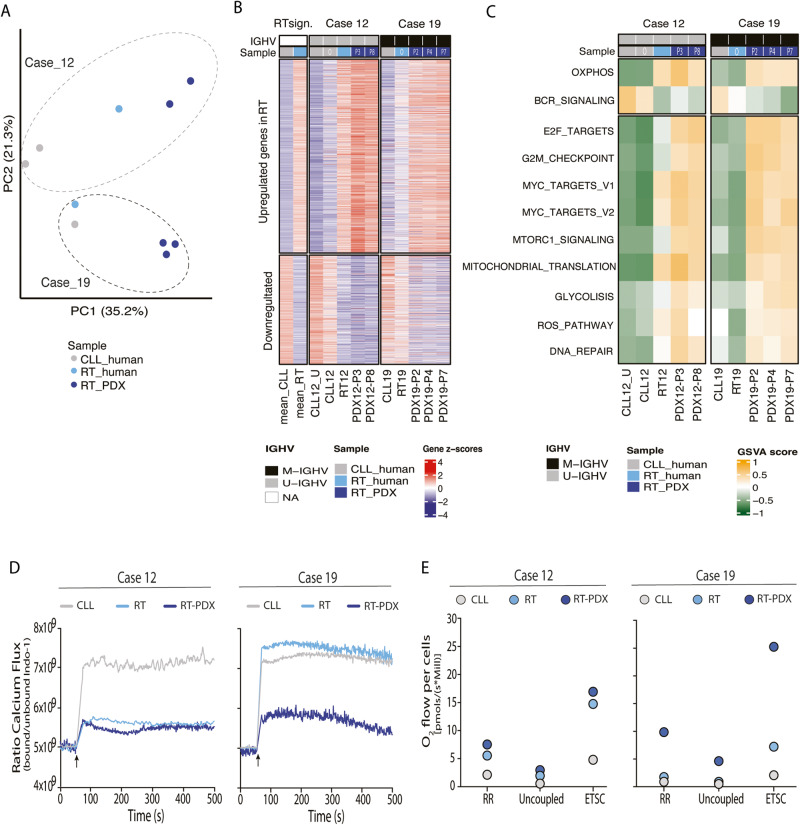
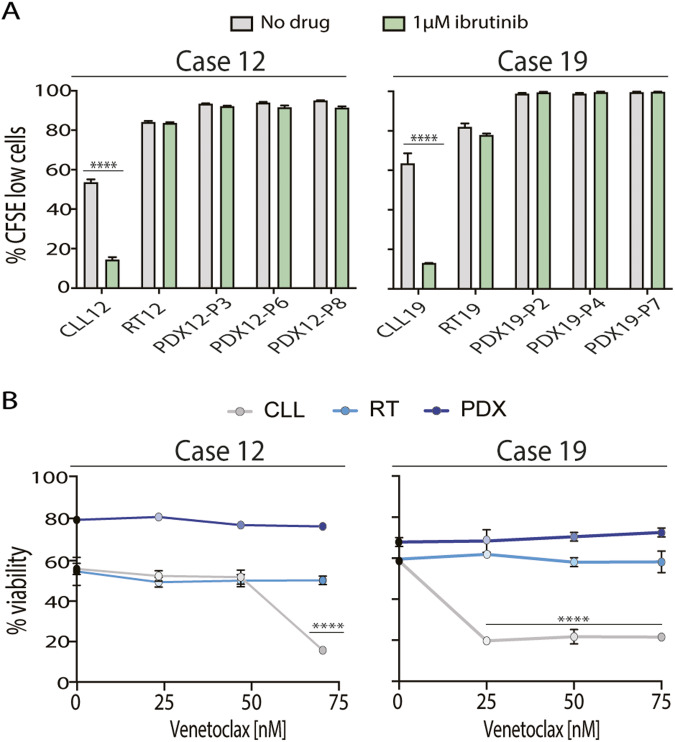
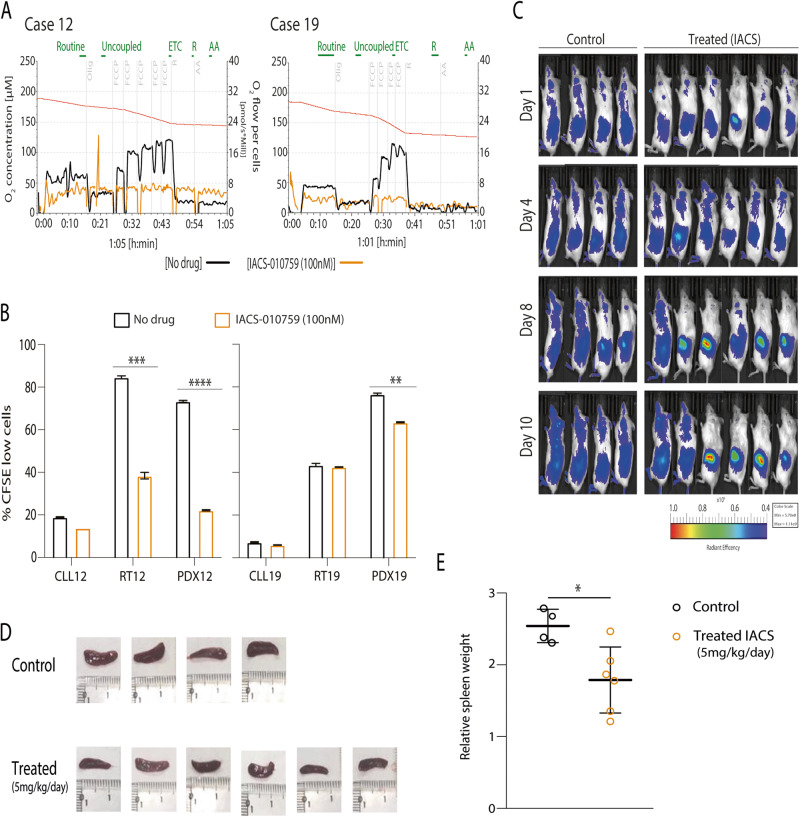
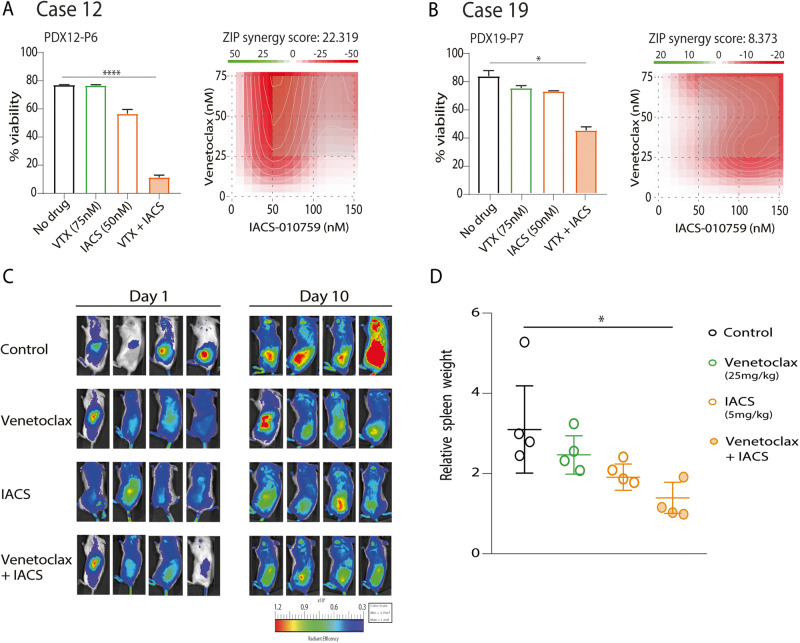
Chronic lymphocytic leukemia (CLL) is a B-cell neoplasm with a heterogeneous clinical behavior. In 5-10% of patients the disease transforms into a diffuse large-B cell lymphoma known as Richter transformation (RT), which is associated with dismal prognosis. Here, we aimed to establish patient-derived xenograft (PDX) models to study the molecular features and evolution of CLL and RT. We generated two PDXs by injecting CLL (PDX12) and RT (PDX19) cells into immunocompromised NSG mice. Both PDXs were morphologically and phenotypically similar to RT. Whole-genome sequencing analysis at different time points of the PDX evolution revealed a genomic landscape similar to RT tumors from both patients and uncovered an unprecedented RT subclonal heterogeneity and clonal evolution during PDX generation. In PDX12, the transformed cells expanded from a very small subclone already present at the CLL stage. Transcriptomic analysis of PDXs showed a high oxidative phosphorylation (OXPHOS) and low B-cell receptor (BCR) signaling similar to the RT in the patients. IACS-010759, an OXPHOS inhibitor, reduced proliferation, and circumvented resistance to venetoclax. In summary, we have generated new RT-PDX models, one of them from CLL cells that mimicked the evolution of CLL to RT uncovering intrinsic features of RT cells of therapeutical value.


Conflict of interest statement

E.C. has been a consultant for Takeda, NanoString, AbbVie and Illumina; has received honoraria from Janssen, EUSPharma and Roche for speaking at educational activities and research funding from AstraZeneca and is an inventor on 2 patents filed by the National Institutes of Health, National Cancer Institute: “Methods for selecting and treating lymphoma types,” licensed to NanoString Technologies, and “Evaluation of mantle cell lymphoma and methods related thereof”, not related to this project. F.N. has received honoraria from Janssen, AbbVie, AstraZeneca and Sophia Genetics for speaking at educational activities. D.C. has received honoraria from AbbVie, Sophia Genetics, Thermofisher and AstraZeneca for speaking at educational activities. The remaining authors declare no competing financial interests.

Figures

Fig. 1
Fig. 1. Description and characterization of PDX models.
A Schematic representation of PDX generation from cases 19 (RT, cells in blue) and 12 (CLL, cells in gray). In dark blue is depicted the weeks (w) between passages. The circular arrow indicates that the cryopreserved PDX cells were reinjected and regrown. Cryopreserved established PDXs were able to engraft after eight weeks for case 19 and after five weeks for case 12, similar to defined time for PDX establishment. B Clinical evolution and main mutations detected in case 12 (white square) and case 19 (black square). Gray (CLL) and blue (RT) dots depict the time-point when cells were collected for PDX generation. Orange square indicates the time of RT diagnosis. Abbreviations: B-Obin bendamustine + obinutuzumab; CLB clorambucil, CLL chronic lymphocytic leukemia, Duv duvelisib, CP cyclophosphamide, Ibru ibrutinib, M-CLL immunoglobulin heavy chain mutated CLL, R rituximab, R-FCM rituximab + cyclophosphamide + fludarabine + mitoxantrone, RT Richter transformation, U-CLL, immunoglobulin heavy chain unmutated CLL. C Flow cytometry analyses of primary samples (CLL [gray] and RT [light blue]) and PDXs (dark blue) from cases 12 and 19. Forward scatter (FSC) vs. side scatter (SSC) plot for cell size and CD19 (SuperBright600) vs. CD5 (PE-Cy5) plot for tumor cell identification. D Detection of clonal rearrangement by PCR of immunoglobulin heavy chain (IGH) FR1 region analyzed by GeneScan in purified (hCD19+) cells. Original: DNA from patient sample used for PDX generation; Early passage: third PDX12 passage (PDX12-P3) and second PDX19 passage (PDX19-P2); Established PDX: sixth PDX12 passage (PDX12-P6) and seventh PDX19 passage (PDX19-P7). All PDX samples were clonally related as presented the same peak, identically to the original counterpart. E Morphology of sections from PDX12 and PDX19 tumor masses stained with hematoxylin/eosin (H&E) and human CD79a. All images were acquired at ×60 magnification.
Fig. 2
Fig. 2. Generation of an in vivo RT model.
A Tumor infiltration was tracked using IVIS® imager with fluorescent probe XenoLight 2-DG-750 every 3-4 days in NSG mice (11 cases): control (MEC-1 cell line) (n = 3), PDX12 (P6) (n = 4) and PDX19 (P7) (n = 4). Median Fluorescence Intensity (MFI) is depicted in a bar chart as a mean of each group: MEC-1 control (light gray), PDX12 (P6) (light orange) and PDX19 (P7) (dark orange). B Mice weight evolution from PDX12 (light orange), PDX19 (dark orange) and MEC-1 control (light gray). Data is presented as mean values ± SD. C Organ infiltration was determined by flow cytometry in peripheral blood (PB), bone marrow (BM) and spleen. First, hCD45 population was identified [top] and after gating the population, tumor cells (CD19+ CD5+/-) were selected [bottom]. Tumor B-cell infiltration in PB was 41.3% (only one mouse) for PDX12 and 59.4 ± 13.6% [PDX19]; in BM was 88.2 ± 10.2% [PDX12] and 61.6 ± 4.5% [PDX19], and in the spleen was 91.0 ± 3.6% [PDX12] and 83.5 ± 3.5% [PDX19]. Data from Control (MEC-1) is not shown. Data is presented as mean values ± SD. D Sections from NSG spleens from PDX12 and PDX19 stained with H&E, human CD79a, human CD3 and mouse F4/80. All images were acquired at ×60 magnification except mF4/80 images acquired at ×20 magnification.
Fig. 3
Fig. 3. Genomic profile and clonal evolution in PDX.
A Oncoprint showing driver alterations found in PDXs (dark blue) and/or CLL/RT original samples (gray and light blue, respectively). Each column represents a sample and genes are depicted in rows. The total number of mutations are shown at top, and the number of copy number alterations (CNAs) and structural variants (SVs) at bottom. The color transparency of the mutations and CNAs indicates the cancer cell fraction (CCF). CNAs and mutations are colored by type. O: original cells used for PDX generation; RT: original Richter transformation’s sample; P2 PDX passage 2, P3 PDX passage 3, P4 PDX passage 4, P6 PDX passage 6, P7 PDX passage 7, P8 PDX passage 8. IGHV status, type of sample and type of mutation and CNA are colored by type. B Circos plots from last passage from case 12 (PDX12-P8) and case 19 (PDX19-P7). Plots displays the SVs (links) and CNAs (inner circle). Driver genes altered are annotated. Chromosomes are depicted in the outer circle. CNAs and SV are colored by type. C Clonal evolution along the PDX generation inferred from whole-genome sequencing (WGS) in case 12. Each subclone is depicted by a different color and number. The height of each subclone in each time point (vertical dashed line) is proportional to their CCF. The phylogeny of the subclones with the main driver alterations is shown [right]. D Clonal evolution along the PDX generation inferred from WGS data in case 19. Data is represented as described in panel C. E Percentage of MYC gains (light green) or amplifications (dark green) from case 19 in each time-point determined by FISH. The total number of cells per sample is shown at the bottom of the bar chart. The number of cells for each subgroup is detailed in Table S10. F Phylogenetic reconstruction of subclones and contribution of the mutational signatures to their mutational profile. Each mutational signature is colored by type.
Fig. 4
Fig. 4. PDXs have a transcriptomic profile of RT and showed an OXPHOShigh–BCRlow phenotype.
A Principal components analysis based son RNA-seq data from original CLL/RT and PDX samples from both cases. B Heatmap showing the 2,244 differentially expressed genes (DEG) between RT and CLL according to Nadeu et al. [11] in samples from cases 12 and 19. RT sign: signature described in Nadeu et al.12 Case 12: a CLL sample collected prior any therapy (CLL12_U), the CLL sample used to develop the PDX (CLL12), the RT sample (RT12) and two PDXs (PDX12-P3 and PDX12-P8); for case 19: CLL19 (CLL sample), the original RT sample (RT19) and the three PDXs (PDX19-P2, PDX19-P4 and PDX19-P7); NA: not applicable. C Heatmap showing gene set variation analysis (GSVA) score of gene sets modulated in RT according to Nadeu et al.12 in samples from cases 12 and 19. D Calcium kinetics of tumor cells (CD19+ CD5+) from original CLL/RT and PDX from case 12 and 19. Basal calcium was adjusted at 5×10⁹ Indo-1 ratio (bound/unbound) for 60 seconds prior cell stimulation with F(ab’)2 anti-human IgM + H2O2 at 37 °C and 4-hydroxytamoxifen (4-OHT). Then, Ca2+ flux was recorded up to 500 seconds. Black arrow indicates the time cells were stimulated. E Oxygen (O2) flux from original CLL/RT and PDX cells from case 12 and 19 at routine respiration (RR), oligomycin-inhibited leak respiration (Uncoupled), and after exogenous uncoupler stimulation. (ETSC). CLL samples are represented in gray, RT samples in light blue and PDX samples in dark blue.
Fig. 5
Fig. 5. RTs and PDXs are resistant to ibrutinib and venetoclax treatment.
A CLL/RT primary cells and PDX cells from cases 12 and 19 were cultured in enriched medium (EM) with ODN2006 + IL-15 and without (gray) or with (green) 1 µM ibrutinib for 6 days. Percentage of proliferating alive cells was determined by carboxyfluoresceinsuccinimidyl ester (CFSE) cell tracer. B Cells were treated with increasing doses of venetoclax (25, 50 or 75 nM) for 48 h and cell viability was determined by Annexin-V staining. Error bars: SD (n = 3). Statistical significance was considered when P value * <0.05; ** <0.01; *** <0.001 and **** <0.0001.
Fig. 6
Fig. 6. IACS-010759 inhibits proliferation on RT-PDX cells in vitro and in vivo.
A PDX cells were treated with IACS-010759 for one-hour prior respirometry assays. Analysis of oxygen (O2) flow were done in samples without (green) or with 100 nM of IACS-010759 (orange). Initially, baseline cellular O2 is measured from basal respiration (routine). Next oligomycin (Olig.), a complex V inhibitor, is added analyzing the ATP-linked respiration and proton leak respiration (uncoupled). After, the protonophore carbonyl cyanide-p-trifluoromethoxyphenyl hydrazone (FCCP) is added to collapse the inner membrane gradient, allowing the electron transfer system capacity (ETC) to function at its maximal rate. FCCP is added until no more ETC is detected. Then, rotenone (R), inhibitor of complex I, and antimycin A (AA), inhibitor of complex III, are added to shut down ETC function, revealing the non-mitochondrial respiration. B Cell proliferation was analyzed in the original CLL/RT and PDX samples after 72 h without (green) or with 100 nM of IACS-010759 (orange). Percentage of proliferating cells was determined by CFSE cell tracer. Two technical replicates of original CLL/RT samples were performed and for PDXs samples, three technical replicates. Error bars: SD. Statistical significance was considered when P value * <0.05; ** <0.01; *** <0.001 and **** <0.0001. C In vivo effect of IACS-010759 in the RT-PDX12 NSG model. Ten NSG mice were used (4 untreated [Control] and 6 Treated [IACS]). Cells were injected IV and tumor infiltration was tracked with IVIS® imager using 100 nM of fluorescent probe XenoLight 2-DG-750. Whole body fluorescence of lateral decubitus was detected by imaging. Mice were sacrificed after 10 days of treatment (vehicle, n = 4) or IACS-010759 (n = 6) and spleens sizes D and weights E were analyzed. Spleens weights are relative to mice body from treated with vehicle (green) or IACS-010759 (orange). Statistical significance was considered when P value * <0.05.
Fig. 7
Fig. 7. IACS-010759 circumvent venetoclax resistance in vitro and in vivo in RT and PDX cells.
A Percentage of alive cells (Annexin V-) from PDX12, after 48 h of treatment with 75 nM of venetoclax (VTX) alone, 150 nM of IACS-010759 (IACS) alone and the combination of VTX + IACS. Drug interaction landscape and synergy score for the two drugs was calculated according to ZIP model. ZIP score 0–10 reflects an additive effect. B Percentage of alive cells (Annexin V-) from PDX19, after 48 h of treatment with 75 nM of VTX alone, 50 nM of IACS alone and the combination of VTX + IACS. Drug interaction landscape and synergy score for the two drugs was calculated according to ZIP model. ZIP score >10 reflects a synergistic effect. C In vivo effect of IACS-010759 5 mg/kg, venetoclax 25 mg/Kg and the combination in the RT-PDX12 NSG model. Tumor infiltration after one week of cell injection was tracked by optical in vivo imaging using fluorescent probe IRDye® 800CW 2-DG Optical Probe in NSG mice (4 per group). D Mice were sacrificed after 10 days of treatment and spleens sizes (n = 4) were analyzed. Statistical significance was considered when P value *<0.05; **<0.01; ***<0.001 and ****<0.0001 after one-way ANOVA statistical test. Error bars: SD (n = 3 or 4).

Similar articles

Cited by

References

    1. Nadeu F, Diaz-Navarro A, Delgado J, Puente XS, Campo E. Genomic and epigenomic alterations in chronic lymphocytic leukemia. Annu Rev Pathol: Mech Dis. 2020;15:149–77. - PubMed
    1. Delgado J, Nadeu F, Colomer D, Campo E. Chronic lymphocytic leukemia: from molecular pathogenesis to novel therapeutic strategies. Haematologica. 2020;105:2205–17. - PMC - PubMed
    1. Kulis M, Heath S, Bibikova M, Queirós AC, Navarro A, Clot G, et al. Epigenomic analysis detects widespread gene-body DNA hypomethylation in chronic lymphocytic leukemia. Nat Genet. 2012;44:1236–42. - PubMed
    1. Puente XS, Beà S, Valdés-Mas R, Villamor N, Gutiérrez-Abril J, Martín-Subero JI, et al. Non-coding recurrent mutations in chronic lymphocytic leukaemia. Nature. 2015;526:519–24. - PubMed
    1. Landau DA, Tausch E, Taylor-Weiner AN, Stewart C, Reiter JG, Bahlo J, et al. Mutations driving CLL and their evolution in progression and relapse. Nature. 2015;526:525–30. - PMC - PubMed

Publication types

MeSH terms