. 2023 Nov 28;13(1):20978.
doi: 10.1038/s41598-023-48115-3.

Rhythmic profile of memory T and B-cells along childhood and adolescence

Affiliations

Rhythmic profile of memory T and B-cells along childhood and adolescence

Joaquim Pedro Brito-de-Sousa et al. Sci Rep. .

Abstract

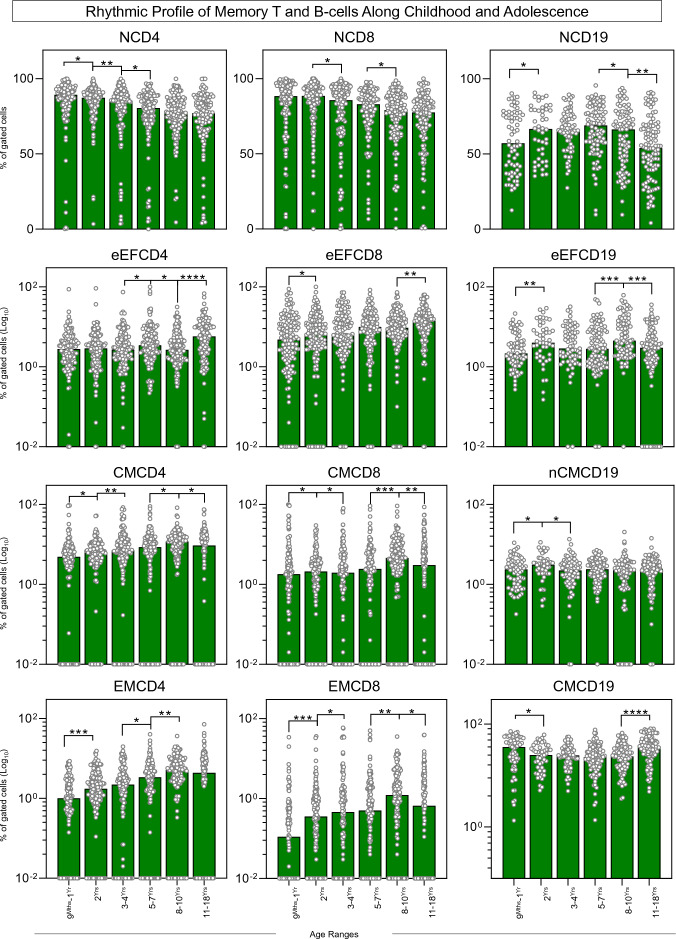
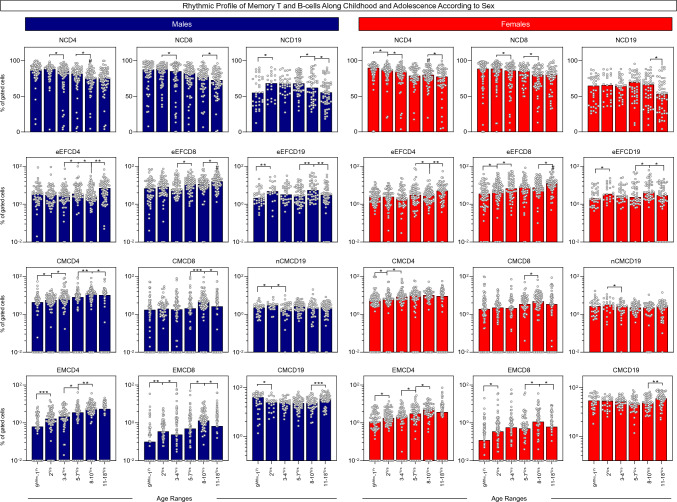
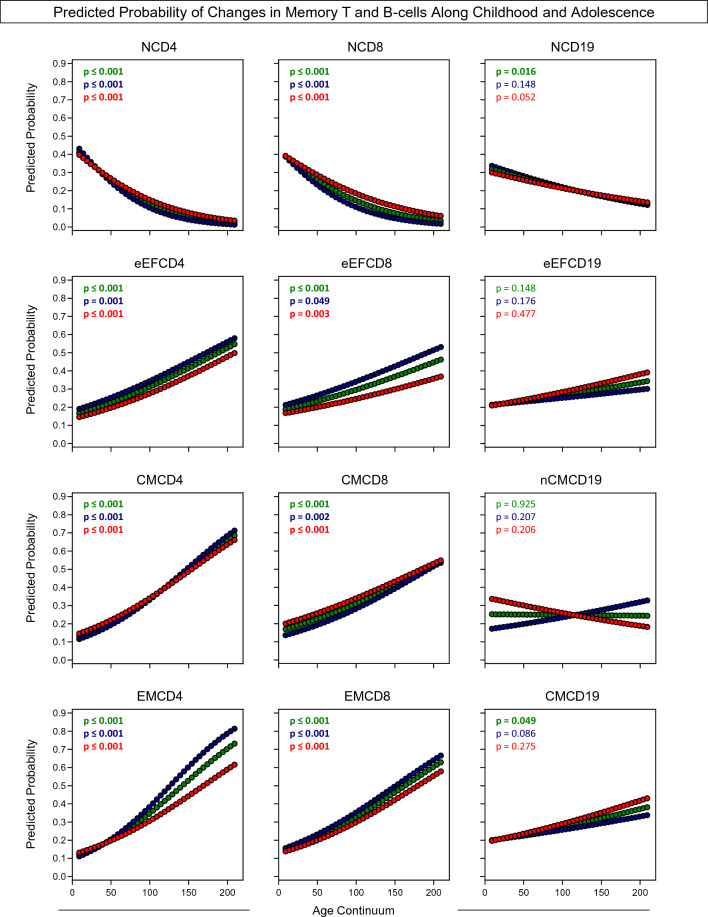
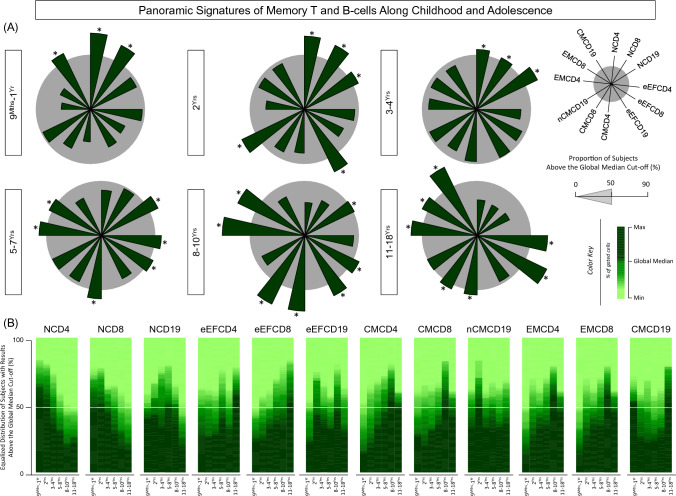
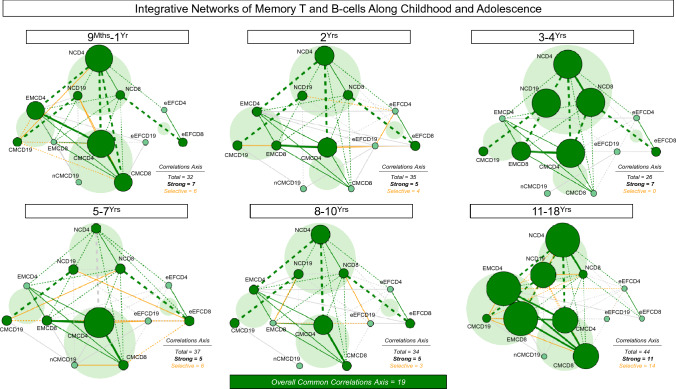
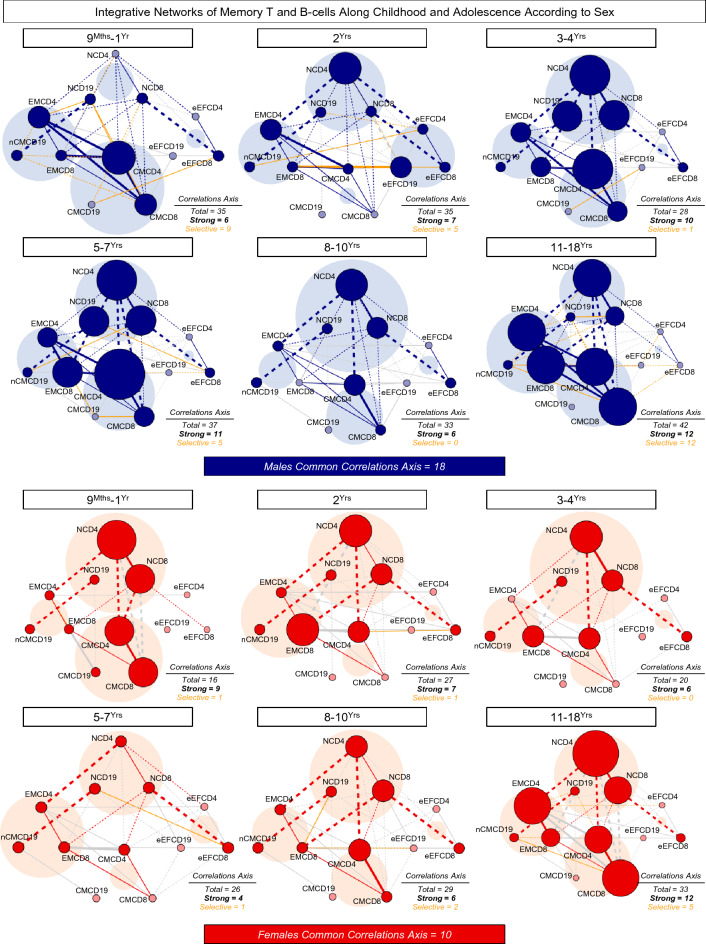
Immunobiography describes the life-long effects of exogenous or endogenous stimuli on remodeling of immune cell biology, including the development of memory T and B-cells. The present study aimed at investigating the rhythms of changes in phenotypic features of memory T and B-cells along childhood and adolescence. A descriptive-observational investigation was conducted including 812 healthy volunteers, clustered into six consecutive age groups (9Mths-1Yr; 2Yrs; 3-4Yrs; 5-7Yrs; 8-10Yrs; 11-18Yrs). Immunophenotypic analysis of memory T-cell (CD4+ and CD8+) and B-cell subsets were performed by flow cytometry. The results pointed out that memory-related biomarkers of T and B-cells displayed a bimodal profile along healthy childhood and adolescence, regardless of sex. The first stage of changes occurs around 2Yrs, with predominance of naive cells, while the second and more prominent wave occurs around the age 8-10Yrs, with the prevalence of memory phenotypes. The neighborhood connectivity profile analysis demonstrated that the number of correlations reaches a peak at 11-18Yrs and lower values along the childhood. Males presented higher and conserved number of correlations when compared to females. Altogether, our results provide new insights into immunobiography and a better understanding of interactions among the cellular subsets studied here during childhood and adolescence.


Conflict of interest statement

The authors declare no competing interests.

Figures

Figure 1
Figure 1
Rhythmic profile of memory T and B-cells along childhood and adolescence. The overall profile of memory T-cell subsets (CD4+ and CD8+) and B-cells was characterized in peripheral blood samples from healthy children and adolescents (ALL (Green color bar), n = 812), categorized into distinct age groups (9Mths–1Yr, n = 135; 2Yrs, n = 147; 3–4Yrs, n = 129; 5–7Yrs, n = 133; 8–10Yrs, n = 140 and 11–18Yrs, n = 128). Immunophenotypic analysis of NAIVE (N), Early EFFECTOR (eEF), CENTRAL (CM) and EFFECTOR MEMORY (EM) T-cell subsets as well as NAIVE (N), Early EFFECTOR (eEF), NON-CLASSICAL MEMORY (nCM) and CLASSICAL MEMORY (CM) B-cells was carried out by flow cytometry as described in Material and Methods. The results are shown as scattering distribution of individual data of relative frequency of gated cells (% within CD4+, CD8+ or CD19+ gated cells) over bars of median values for each age range. Comparative analysis between pairs of adjacent age groups was carried out by Mann–Whitney test and significant differences at p < 0.05 underscored by connecting lines for comparisons with the immediately earlier age range and the statistical significance identified by *, **, ***, and **** for p values ≤ 0.05; ≤ 0.01, ≤ 0.001, and ≤ 0.0001, respectively.
Figure 2
Figure 2
Rhythmic profile of memory T and B-cells along childhood and adolescence according to sex. The overall profile of memory T-cell subsets (CD4+ and CD8+) and B-cells was characterized in peripheral blood samples from healthy children and adolescents, categorized according to sex (Males (Blue color bar), n = 408 and Females (Red color bar), n = 404) followed by age stratification into distinct groups (9Mths–1Yr, n = 62, n = 73; 2Yrs, n = 67, n = 80; 3–4Yrs, n = 67, n = 62; 5–7Yrs, n = 72, n = 61; 8–10Yrs, n = 71, n = 69 and 11–18Yrs, n = 69, n = 59, respectively). Immunophenotypic analysis of NAIVE (N), Early EFFECTOR (eEF), CENTRAL (CM) and EFFECTOR MEMORY (EM) T-cell subsets as well as NAIVE (N), Early EFFECTOR (eEF), NON-CLASSICAL MEMORY (nCM) and CLASSICAL MEMORY (CM) B-cells was carried out by flow cytometry as described in Material and Methods. The results are shown as scattering distribution of individual data of relative frequency of gated cells (% within CD4+, CD8+ or CD19+ gated cells) over bars of median values for each age range. Comparative analysis between males and females at matching age ranges was carried out by Mann–Whitney test and significant differences at p < 0.05 underscored by #. Comparative analysis between pairs of adjacent age groups was carried out by Mann–Whitney test and significant differences at p < 0.05 underscored by connecting lines for comparisons with the immediately earlier age range and the statistical significance identified by *, **, ***, and **** for p values ≤ 0.05; ≤ 0.01, ≤ 0.001, and ≤ 0.0001, respectively.
Figure 3
Figure 3
Predicted probability of changes in memory T and B-cells along childhood and adolescence. The association between memory T-cell subsets (CD4+ and CD8+) and B-cells with childhood and adolescence was carried for healthy children and adolescents (ALL (Green circle), n = 812), further categorized according to sex (Males (Blue circle), n = 408 and Females (Red circle), n = 404). Data categorization was performed based on cut-offs established at the 75th percentile of each data set empirical distribution. The strength of association between the frequency of memory T-cell subsets and B-cells and age as well as putative variations by sex was assessed by logistic regression model as described in Material and Methods. Predicted probabilities were estimated by age and the final data shown as scattering distribution of changes in memory T-cell subsets and B-cells along age continuum (months) and significant differences considered at p < 0.05. The p values for the general population (ALL) and data stratification by sex (Males and Females) are provided in the figure. Significant p values are underscored in bold.
Figure 4
Figure 4
Panoramic signatures of memory T and B-cells along childhood and adolescence. (A) The overall signature of memory T-cell subsets (CD4+ and CD8+) and B-cells was assembled for healthy children and adolescents (ALL (Green color bar), n = 812), categorized according to distinct age groups (9Mths–1Yr, n = 135; 2Yrs, n = 147; 3–4Yrs, n = 129; 5–7Yrs, n = 133; 8–10Yrs, n = 140 and 11–18Yrs, n = 128). Immunophenotypic analysis of NAIVE (N), Early EFFECTOR (eEF), CENTRAL (CM) and EFFECTOR MEMORY (EM) T-cell subsets as well as NAIVE (N), Early EFFECTOR (eEF), NON-CLASSICAL MEMORY (nCM) and CLASSICAL MEMORY (CM) B-cells was carried out by flow cytometry as described in Material and Methods. Signatures were assembled by first converting the original data, expressed as continuous variables (% of gated cells), into categorical results reported as proportion (%) of subjects with results above the cut-off edges (global median values of each cell subset). The final data are shown in radar chart, with each axis representing one memory cell subset. Cell phenotypes with proportion higher than the 50th percentile (gray zone) were underscored by *. (B) Heatmaps constructs were built to further illustrate the rhythmic distribution patterns of memory T-cell subsets and B-cells. Data are expressed as equalized distribution of subjects with results above the global median cut-off based on the color key provided in the figure. A white line set on the 50th percentile of data distribution was used to define the overall rhythm of signatures of memory T-cell subsets and B-cells.
Figure 5
Figure 5
Signatures of memory T and B-cells along childhood and adolescence according to sex. (A) The overall signature of memory T-cell subsets (CD4+ and CD8+) and B-cells was assembled for healthy children and adolescents, categorized according to sex (Males (Blue color bar), n = 408 and Females (Red color bar), n = 404) followed by age stratification into distinct groups (9Mths–1Yr, n = 62, n = 73; 2Yrs, n = 67, n = 80; 3–4Yrs, n = 67, n = 62; 5–7Yrs, n = 72, n = 61; 8–10Yrs, n = 71, n = 69 and 11–18Yrs, n = 69, n = 59, respectively). Immunophenotypic analysis of NAIVE (N), Early EFFECTOR (eEF), CENTRAL (CM) and EFFECTOR MEMORY (EM) T-cell subsets as well as NAIVE (N), Early EFFECTOR (eEF), NON-CLASSICAL MEMORY (nCM) and CLASSICAL MEMORY (CM) B-cells was carried out by flow cytometry as described in Material and Methods. Signatures were assembled by first converting the original data, expressed as continuous variables (% of gated cells), into categorical results reported as proportion (%) of subjects with results above the cut-off edges (global median values of each cell subset). The final data are shown in orbital chart, with each circle representing one memory cell subset with size and color proportional to the frequency (%) of subjects with results above the cut-off edges. (B) Heatmaps constructs were built to further illustrate the rhythmic distribution patterns of memory T-cell subsets and B-cells. Data are expressed as equalized distribution of subjects with results above the global median cut-off based on the color key provided in the figure. A white line set on the 50th percentile of data distribution was used to define the overall rhythm of memory T-cell subsets and B-cells signatures.
Figure 6
Figure 6
Integrative networks of memory T and B-cells along childhood and adolescence. Comprehensive networks were built for memory T-cell subsets (CD4+ and CD8+) and B-cells from healthy children and adolescents (ALL (Green color bar), n = 812), categorized into distinct age groups (9Mths–1Yr, n = 135; 2Yrs, n = 147; 3–4Yrs, n = 129; 5–7Yrs, n = 133; 8–10Yrs, n = 140 and 11–18Yrs, n = 128). Data analyses were carried out by Spearman rank tests as described in Material and Methods. Networks were built using cluster layouts comprising four groups of memory cell phenotypes, including: NAIVE (N), Early EFFECTOR (eEF), CENTRAL/NON-CLASSICAL (CM/nCM) and EFFECTOR/CLASSICAL MEMORY (EM/CM) subsets. Connecting edges identify positive (continuous line) and negative (dashed line) correlations. The line thickness illustrates the correlation strength, comprising weak/moderate (“r” scores from |0.1 to 0.67|, thin lines) and strong correlations (“r” scores from ≥|0.67|, thick lines). Common correlations axis is identified by green lines and selective correlation axes observed at each age range are underscored by orange lines. The node sizes are proportional to the number of strong correlations between cell subsets. Cell subsets presenting at least 1 strong correlation are underscored by dark green nodes. The number of total and selective correlations axes between cell subsets at each age range as well as the number of common correlation axes along all age groups are provided in the figure. Circular backgrounds underscore the proportional contribution of each cell cluster to the overall connectivity at distinct age groups.
Figure 7
Figure 7
Integrative networks of memory T and B-cells along childhood and adolescence according to sex. Comprehensive networks were built for memory T-cell subsets (CD4+ and CD8+) and B-cells from healthy children and adolescents, categorized according to sex (Males (Blue color bar), n = 408 and Females (Red color bar), n = 404) followed by age stratification into distinct groups (9Mths–1Yr, n = 62, n = 73; 2Yrs, n = 67, n = 80; 3–4Yrs, n = 67, n = 62; 5–7Yrs, n = 72, n = 61; 8–10Yrs, n = 71, n = 69 and 11–18Yrs, n = 69, n = 59, respectively). Data analyses were carried out by Spearman rank tests as described in Material and Methods. Networks were built using cluster layouts comprising four groups of memory cell phenotypes, including: NAIVE (N), Early EFFECTOR (eEF), CENTRAL/NON-CLASSICAL (CM/nCM) and EFFECTOR/CLASSICAL MEMORY (EM/CM) subsets. Connecting edges identify positive (continuous line) and negative (dashed line) correlations. The line thickness illustrates the correlation strength, comprising weak/moderate (“r” scores from |0.1 to 0.67|, thin lines) and strong correlations (“r” scores from ≥|0.67|, thick lines). Common correlations axes are identified by blue/red lines and selective correlation axis observed at each age range are underscored by orange lines. The node sizes are proportional to the number of strong correlations between cell subsets. Memory cell phenotypes participating in at least 1 strong correlation are underscored by dark green nodes. The number of total and selective correlations between cell subsets at each age range as well as the number of common correlation axes along all age groups are provided in the figure. Circular backgrounds underscore the proportional contribution of each cell cluster to the overall connectivity at distinct age groups.

References

    1. Sadighi AAA. Aging and the immune system: An overview. J. Immunol. Methods. 2018;463:21–26. doi: 10.1016/j.jim.2018.08.005. - DOI - PubMed
    1. Simon AK, Hollander GA, McMichael A. Evolution of the immune system in humans from infancy to old age. Proc. Biol. Sci. 2015;282(1821):20143085. doi: 10.1098/rspb.2014.3085. - DOI - PMC - PubMed
    1. Franceschi C, et al. Immunobiography and the heterogeneity of immune responses in the elderly: A focus on inflammaging and trained immunity. Front. Immunol. 2017;8:982. doi: 10.3389/fimmu.2017.00982. - DOI - PMC - PubMed
    1. Moraes-Pinto MI, Suano-Souza F, Aranda CS. Immune system: Development and acquisition of immunological competence. J. Pediatr. 2021;97(Suppl 1):S59–S66. doi: 10.1016/j.jped.2020.10.006. - DOI - PMC - PubMed
    1. Saule P, et al. Accumulation of memory T cells from childhood to old age: Central and effector memory cells in CD4(+) versus effector memory and terminally differentiated memory cells in CD8(+) compartment. Mech. Ageing Dev. 2006;127(3):274–281. doi: 10.1016/j.mad.2005.11.001. - DOI - PubMed

LinkOut - more resources