. 2023 Nov 28;13(1):21002.
doi: 10.1038/s41598-023-48320-0.

Accuracy of facial skeletal surfaces segmented from CT and CBCT radiographs

Affiliations

Accuracy of facial skeletal surfaces segmented from CT and CBCT radiographs

Mohammed Ghamri et al. Sci Rep. .

Abstract

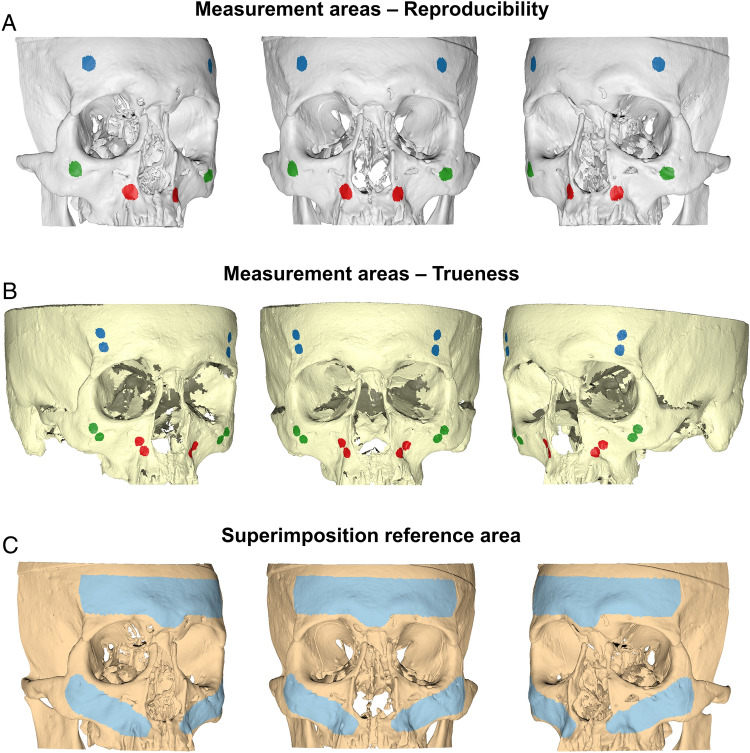
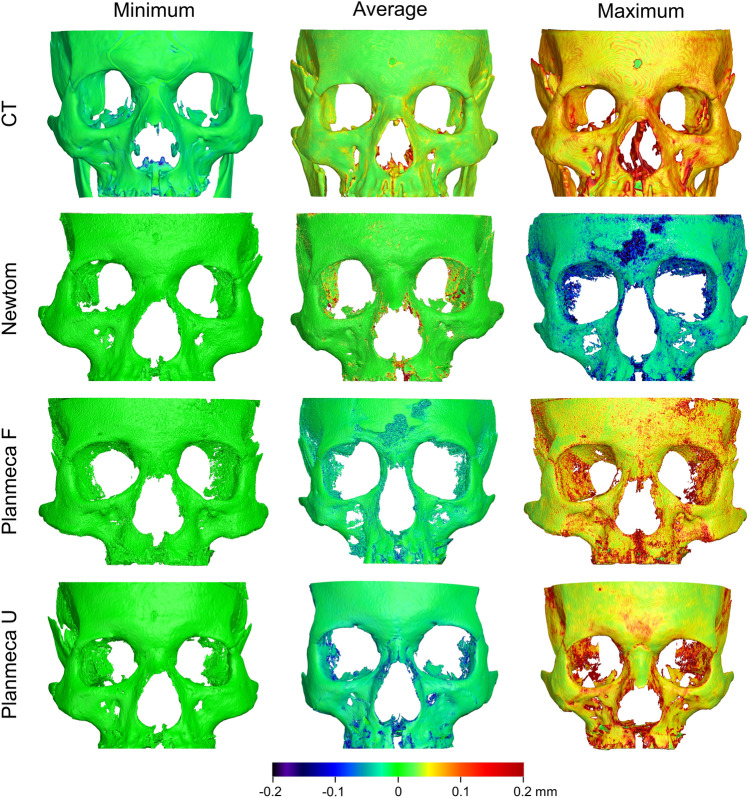
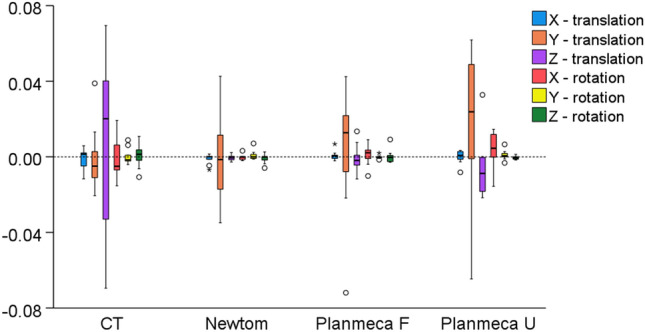
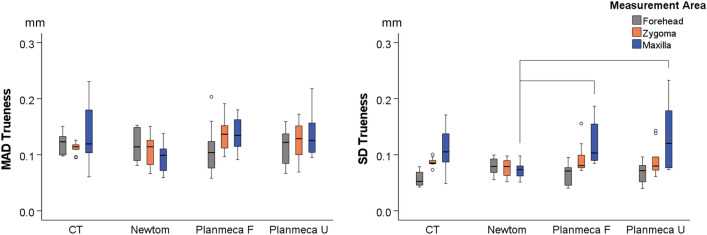
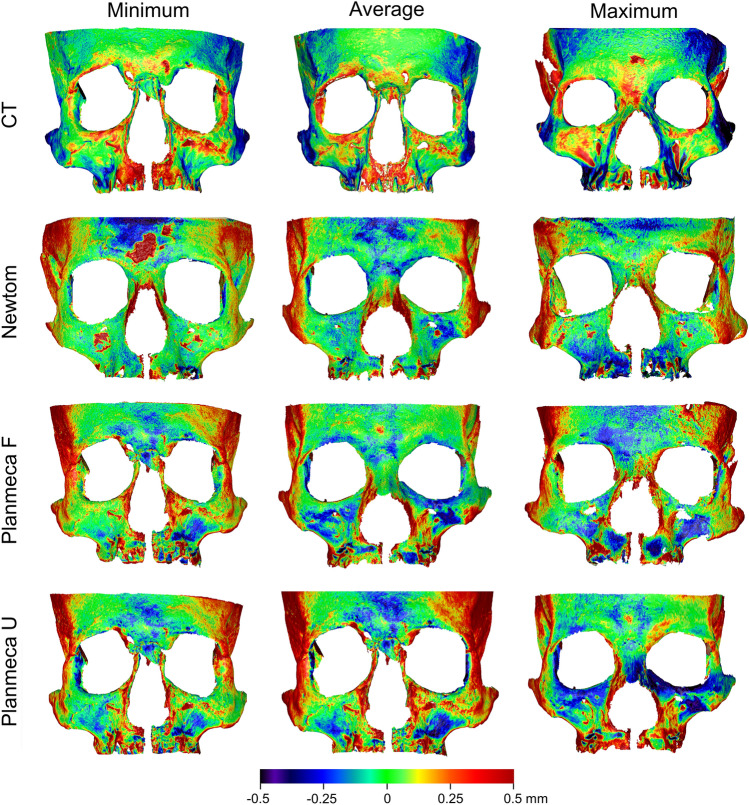
The accuracy of three-dimensional (3D) facial skeletal surface models derived from radiographic volumes has not been extensively investigated yet. For this, ten human dry skulls were scanned with two Cone Beam Computed Tomography (CBCT) units, a CT unit, and a highly accurate optical surface scanner that provided the true reference models. Water-filled head shells were used for soft tissue simulation during radiographic imaging. The 3D surface models that were repeatedly segmented from the radiographic volumes through a single-threshold approach were used for reproducibility testing. Additionally, they were compared to the true reference model for trueness measurement. Comparisons were performed through 3D surface approximation techniques, using an iterative closest point algorithm. Differences between surface models were assessed through the calculation of mean absolute distances (MAD) between corresponding surfaces and through visual inspection of facial surface colour-coded distance maps. There was very high reproducibility (approximately 0.07 mm) and trueness (0.12 mm on average, with deviations extending locally to 0.5 mm), and no difference between radiographic scanners or settings. The present findings establish the validity of lower radiation CBCT imaging protocols at a similar level to the conventional CT images, when 3D surface models are required for the assessment of facial morphology.


Conflict of interest statement

D. Halazonetis owns stock in dHAL Software, the company that markets Viewbox 4. Demetrios Halazonetis was not involved in data generation and analysis, and thus, could not affect the study outcomes. All other authors declare no competing interest. The funders had no role in the design of the study; in the collection, analyses, or interpretation of data; in the writing of the manuscript, or in the decision to publish the results.

Figures

Figure 1
Figure 1
(A). Final configuration of an entire skull subjected to radiographic imaging. (B) The 3D printed soft-tissue head shell was filled with water, through the hole present at its upper part. (C). Radiographic image acquisition with soft-tissue simulation.
Figure 2
Figure 2
(A, B). Three measurement areas defined in each skull through bilaterally selected mesh surfaces at the forehead (blue), the zygomatic process (green), and the maxillary process (red) for reproducibility and trueness assessment, respectively. Each circular area shown in the images consists of 1000 triangles. (C). Reference area (light blue) used for all surface-based superimpositions performed in the study.
Figure 3
Figure 3
Box plots showing the intra- and inter-operator differences in visually defined facial surface segmentation threshold values for radiographic volumes. Outliers are shown as black circles (further from the median more than 1.5 times the IQR). A difference of 10 in threshold values corresponds to 0.25% of the full range of voxel values of the CT images, 0.22% of the Newtom images, and 0.29% of the Planmeca images.
Figure 4
Figure 4
Box plots showing the intra-operator differences between repeatedly segmented facial surface models from radiographic volumes. The upper graphs show Mean Absolute Distances (MAD) between the corresponding surface models and the lower graphs the Standard Deviations of the absolute distances (SD). The lines connect variables that show significant differences (p < 0.05) detected through Kruskal–Wallis, followed by Mann–Whitney U test (Bonferroni adjusted). Outliers are shown as black circles (further from the median more than 1.5 times the IQR) or asterisks in more extreme cases (further from the median more than 3 times the IQR).
Figure 5
Figure 5
Colour coded distance maps between repeatedly segmented surface models by the same operator, representative of the minimum, average, and maximum differences detected in the sample for each acquisition setting. The compared models retained their original spatial relation within the source radiographic volume (status before superimposition).
Figure 6
Figure 6
Box plots showing the rotational (°) or translational (mm) movements required to best-fit approximate the repeatedly segmented surface models by the same operator, for each acquisition setting. Outliers are shown as black circles (further from the median more than 1.5 times the IQR). X-translation: lateral movement, Y-translation: vertical movement, Z-translation: anteroposterior movement, X-rotation: around the lateral axis, Y- rotation: around the vertical axis, Z- rotation: around the anteroposterior axis.
Figure 7
Figure 7
Box plots showing the trueness of the segmented facial surface models indicated by the distances of the radiographically derived models from the direct optical scans, following their best-fit approximation. The Mean Absolute Distances (MAD) and the standard deviations of the absolute distances (SD) between the superimposed surface models are shown. The lines connect variables that show significant differences (p < 0.05) detected through Kruskal–Wallis, followed by Mann–Whitney U test (Bonferroni adjusted). Outliers are shown as black circles (further from the median more than 1.5 times the IQR).
Figure 8
Figure 8
Colour coded distance maps between best-fit approximated segmented surface models and directly obtained models through an optical surface scanner, representative of the minimum, average, and maximum deviations in trueness, detected in the sample for each acquisition setting.

References

    1. Ye H, et al. Comparison of the accuracy (trueness and precision) of virtual dentofacial patients digitized by three different methods based on 3D facial and dental images. J. Prosthet. Dent. 2022;S0022–S3913(22):00099–103. doi: 10.1016/j.prosdent.2022.01.035. - DOI - PubMed
    1. Friedli L, Kloukos D, Kanavakis G, Halazonetis D, Gkantidis N. The effect of threshold level on bone segmentation of cranial base structures from CT and CBCT images. Sci. Rep. 2020;10:7361. doi: 10.1038/s41598-020-64383-9. - DOI - PMC - PubMed
    1. Kanavakis G, Ghamri M, Gkantidis N. Novel anterior cranial base area for voxel-based superimposition of craniofacial CBCTs. J. Clin. Med. 2022;11:3536. doi: 10.3390/jcm11123536. - DOI - PMC - PubMed
    1. Halazonetis DJ. From 2-dimensional cephalograms to 3-dimensional computed tomography scans. Am. J. Orthod. Dentofac. Orthop. 2005;127:627–637. doi: 10.1016/j.ajodo.2005.01.004. - DOI - PubMed
    1. Dings JP, et al. Reliability and accuracy of cone beam computed tomography versus conventional multidetector computed tomography for image-guided craniofacial implant planning: An in vitro study. Int. J. Oral Maxillofac. Implants. 2019;34:665–672. doi: 10.11607/jomi.6915. - DOI - PubMed

MeSH terms