. 2023 Nov 28;24(1):450.
doi: 10.1186/s12859-023-05561-0.

Detection of continuous hierarchical heterogeneity by single-cell surface antigen analysis in the prognosis evaluation of acute myeloid leukaemia

Affiliations

Detection of continuous hierarchical heterogeneity by single-cell surface antigen analysis in the prognosis evaluation of acute myeloid leukaemia

Nan Shao et al. BMC Bioinformatics. .

Abstract

Background: Acute myeloid leukaemia (AML) is characterised by the malignant accumulation of myeloid progenitors with a high recurrence rate after chemotherapy. Blasts (leukaemia cells) exhibit a complete myeloid differentiation hierarchy hiding a wide range of temporal information from initial to mature clones, including genesis, phenotypic transformation, and cell fate decisions, which might contribute to relapse in AML patients.

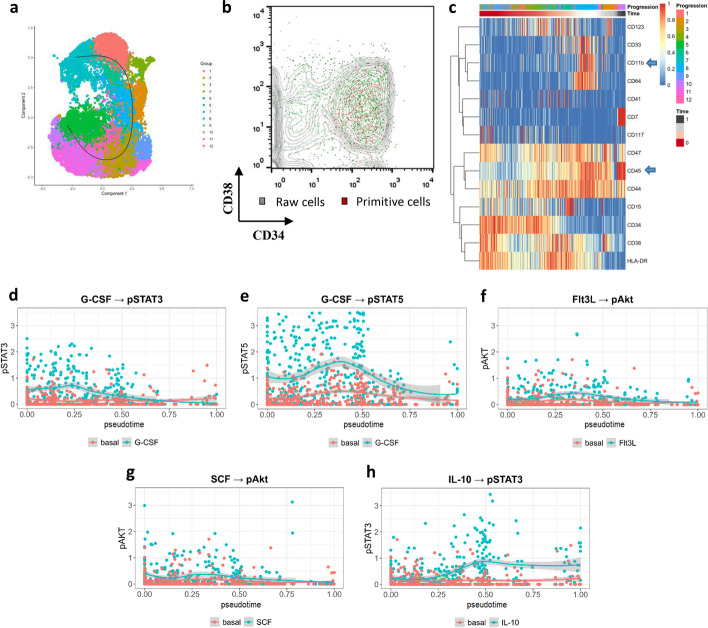
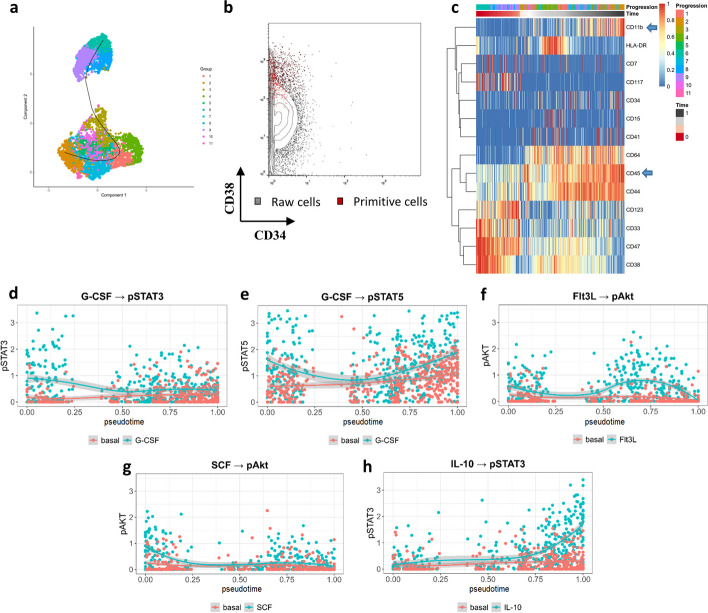
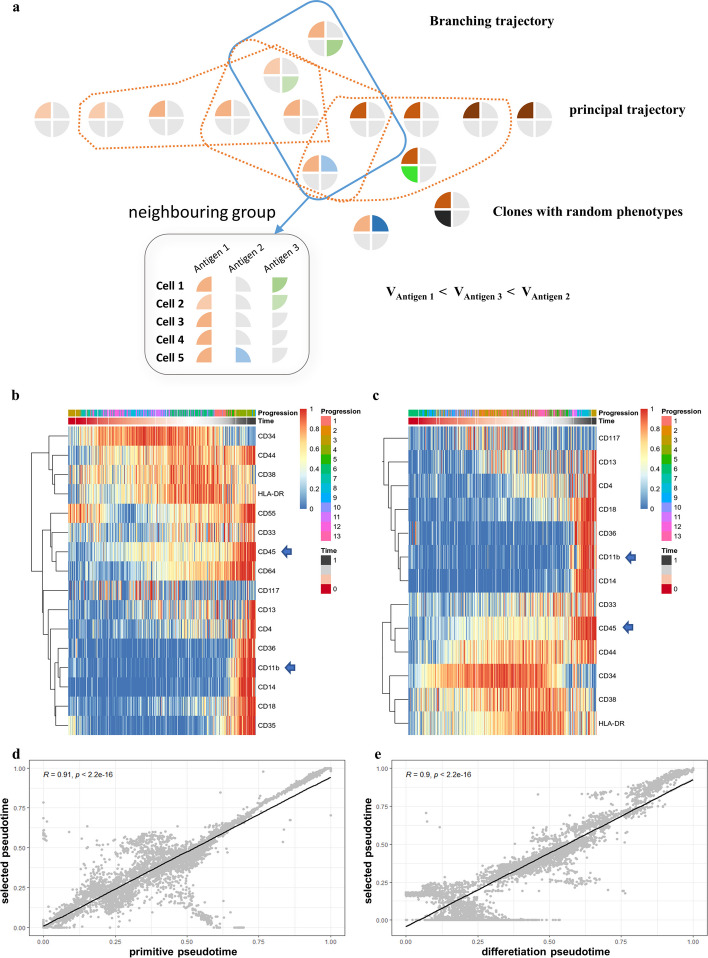
Methods: Based on the landscape of AML surface antigens generated by mass cytometry (CyTOF), we combined manifold analysis and principal curve-based trajectory inference algorithm to align myelocytes on a single-linear evolution axis by considering their phenotype continuum that correlated with differentiation order. Backtracking the trajectory from mature clusters located automatically at the terminal, we recurred the molecular dynamics during AML progression and confirmed the evolution stage of single cells. We also designed a 'dispersive antigens in neighbouring clusters exhibition (DANCE)' feature selection method to simplify and unify trajectories, which enabled the exploration and comparison of relapse-related traits among 43 paediatric AML bone marrow specimens.

Results: The feasibility of the proposed trajectory analysis method was verified with public datasets. After aligning single cells on the pseudotime axis, primitive clones were recognized precisely from AML blasts, and the expression of the inner molecules before and after drug stimulation was accurately plotted on the trajectory. Applying DANCE to 43 clinical samples with different responses for chemotherapy, we selected 12 antigens as a general panel for myeloblast differentiation performance, and obtain trajectories to those patients. For the trajectories with unified molecular dynamics, CD11c overexpression in the primitive stage indicated a good chemotherapy outcome. Moreover, a later initial peak of stemness heterogeneity tended to be associated with a higher risk of relapse compared with complete remission.

Conclusions: In this study, pseudotime was generated as a new single-cell feature. Minute differences in temporal traits among samples could be exhibited on a trajectory, thus providing a new strategy for predicting AML relapse and monitoring drug responses over time scale.

Keywords: AML progression; Acute myeloid leukaemia; Mass cytometry (CyTOF); Prognosis evaluation; Trajectory inference.


Conflict of interest statement

The authors declare that they have no competing interests.

Figures

Fig. 1
Fig. 1
Recognition of CD34+CD38 LSC clones using differentiation trajectory and changes in signal molecules in time-series before and after cytokine induction. a Differentiation trajectory inference in SJ03; b primitive cells emphasized in red with CD34+CD38 phenotype, cells with 0.1 < psudotime < 0.8 is labelled by green; c time-series heatmap of the reported penal in which mature blasts express CD11b+CD45high (blue arrow); d, e pSTAT3 and pSTAT5 expression increases in the early stage of G-CSF induction; f, g Akt showed a slight response to the effect of Flt3L and SCF; h Increased expression of pSTAT3 after IL-10 induction was observed in the intermediate and late stages
Fig. 2
Fig. 2
Differentiation trajectory analysis in samples with untypical LSC blast. a Differentiation trajectory inference in SJ11; b Primitive cells emphasized in red with CD38+ phenotype; c Time-series heatmap of the reported panel in which mature blasts express CD11b+CD45high (blue arrow); d and g pSTAT3 and pAkt in primitive clones showed slightly unregulated responses to G-CSF and SCF; e overall increase of pSTAT5 expression after G-CSF induction; f, h pAkt and pSTAT3 in mature blasts upregulated with the effect of Flt3L and IL-10
Fig. 3
Fig. 3
Differentiation conservative feature selection strategy and its application in sample no. 570407. a “Dispersive antigens in neighbouring clusters exhibition (DANCE)” feature selection strategy: AML branching evolution model is generated by excess surface antigens. A group of neighbouring clusters (blue frame) was assembled by Euclidean distance and each molecule in the group (grey frame) presented with diverse variance (represented by V). There are several neighbouring groups (orange frames) generated for differentiation feature counting; b time-series heatmap derived from 16 markers with a higher expression rate identified each cell with a primitive pseudotime; c time-series heatmap derived from the panel after DANCE selection and identified each cell with a pseudotime based on selected panel; d pseudotime correlation between primitive and selected panel-inferred trajectory (R = 0.91); e pseudotime correlation between feature selected and final panel-derived from the DANCE panel of 43 clinical samples (R = 0.90)
Fig. 4
Fig. 4
Differentiation orientation pinpoint with the reference of typical trajectory. a Time-series heatmap of sample no. 569255 could not pinpoint the trajectory direction without CD45high/CD11b+ cluster landmark; b time-series heatmap of sample no. 326944 (trajectory with typical mature blast at right terminal) as reference trajectory; c dissimilarity heatmap of sample no. 326944 and reverse sample no.569255 trajectory; d dissimilarity heatmap of sample no. 326944 and correct sample no.569255 trajectory; e, f trajectory inference with local reverse did not match with the sample on dissimilarity matrix. Red frame emphasized the error-directed local; g, h correct trajectory direction with a diagonal presentation. Red frame emphasized the local with correct direction
Fig. 5
Fig. 5
Two CD11c temporal expression patterns and the statistic of CD11c abundance in primitive and mature stages of samples. a Expression behavior of CD11c on the trajectory in most patients; b CD11c expression was high in the primitive stage of 4 samples with complete-remission outcome; c CD11c abundance in different prognosis types in the early stage; d CD11c abundance in different prognosis types in the late stage
Fig. 6
Fig. 6
Surface stemness antigen expression heterogeneity peak point distribution on the differentiation trajectory. a Stemness clusters derived from 15-antigen stemness panel distribute on pseudotime axis; b stemness heterogeneity temporal distribution diagram. Cells with stemness clusters and counts in each time period were extracted, and stemness heterogeneity was calculated based on shannon entropy [H(x)]. Then the stemness heterogeneity of every time period was ordered along pseudotime axis with wavy shape; c stemness heterogeneity peak time counted in different prognosis type of samples; d, e stemness heterogeneity temporal distribution of complete-remission (CR) (no. 277523) and relapse (no. 381905). The peak timepoint was labelled by yellow arrow
Fig. 7
Fig. 7
Stemness heterogeneity distribution was tested at single-cell RNA level. a Reported specific biomarkers expressed hierarchically in the blast. Respectively, mature myeloid blasts always express FCN1 and CD14, monocytes express LYZ, abnormal monocytes in ealier stage express PRTN3 and located in intermediate stage, while CRIP1 and NPW express in CD34+/CD117+ clones are regarded as primitive biomarker as published results; b stemness heterogeneity peak time point distribution in pseudotime. The stemness-related RNA molecules referred to the genes in 17-gene stemness score system; c 17-gene stemness score trough point distribution in pseudotime

References

    1. Hoffman AE, Schoonmade LJ, Kaspers GJ. Pediatric relapsed acute myeloid leukemia: a systematic review. Expert Rev Anticancer Ther. 2021;21(1):45–52. doi: 10.1080/14737140.2021.1841640. - DOI - PubMed
    1. Taussig DC, Miraki-Moud F, Anjos-Afonso F, Pearce DJ, Allen K, Ridler C, Lillington D, Oakervee H, Cavenagh J, Agrawal SG. Anti-CD38 antibody–mediated clearance of human repopulating cells masks the heterogeneity of leukemia-initiating cells. Blood J Am Soc Hematol. 2008;112(3):568–575. doi: 10.1182/blood-2007-10-118331. - DOI - PubMed
    1. Taussig DC, Vargaftig J, Miraki-Moud F, Griessinger E, Sharrock K, Luke T, Lillington D, Oakervee H, Cavenagh J, Agrawal SGJB. The Journal of the American Society of Hematology: Leukemia-initiating cells from some acute myeloid leukemia patients with mutated nucleophosmin reside in the CD34− fraction. Blood. 2010;115(10):1976–1984. doi: 10.1182/blood-2009-02-206565. - DOI - PMC - PubMed
    1. Parkin B, Ouillette P, Li Y, Keller J, Lam C, Roulston D, Li C, Shedden K, Malek SN. Clonal evolution and devolution after chemotherapy in adult acute myelogenous leukemia. Blood. 2013;121(2):369–377. doi: 10.1182/blood-2012-04-427039. - DOI - PMC - PubMed
    1. Vosberg S, Greif PA. Clonal evolution of acute myeloid leukemia from diagnosis to relapse. Genes Chromosomes Cancer. 2019;58(12):839–849. doi: 10.1002/gcc.22806. - DOI - PMC - PubMed

Substances