

Changes in Gut Microbiota at 1-60 Days in 92 Preterm Infants in a Neonatal Intensive Care Unit Using 16S rRNA Gene Sequencing
- PMID: 38018034
- PMCID: PMC10699091
- DOI: 10.12659/MSM.941560
Changes in Gut Microbiota at 1-60 Days in 92 Preterm Infants in a Neonatal Intensive Care Unit Using 16S rRNA Gene Sequencing
Abstract
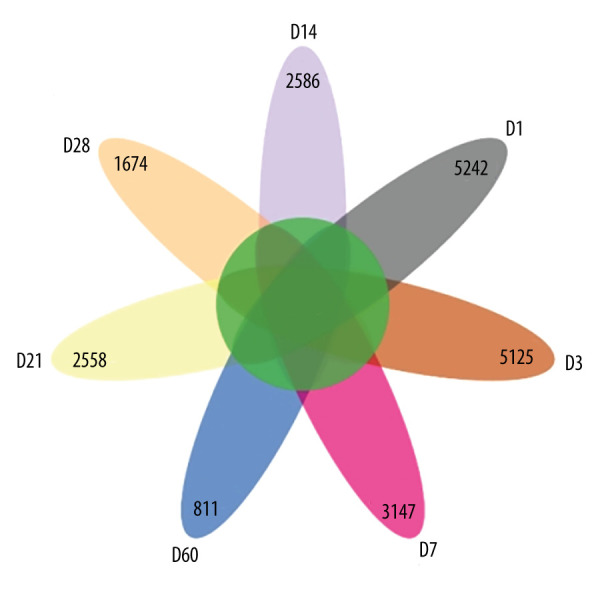
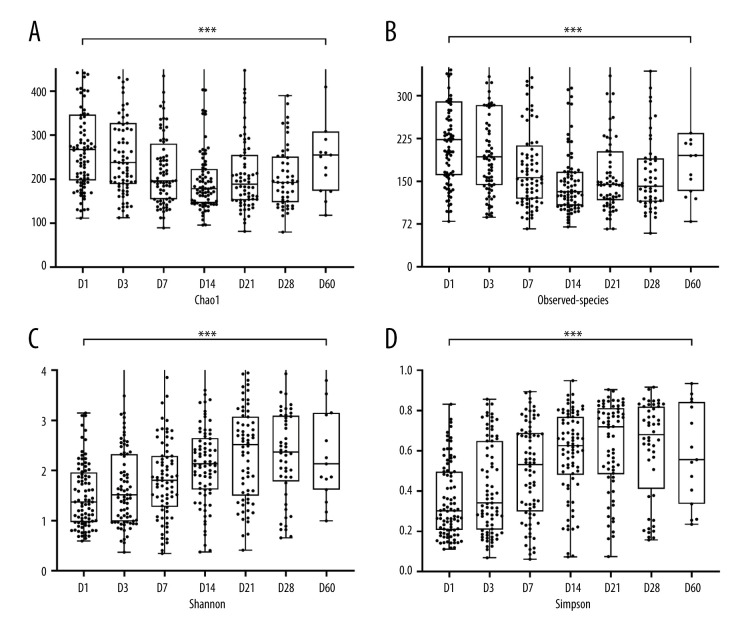
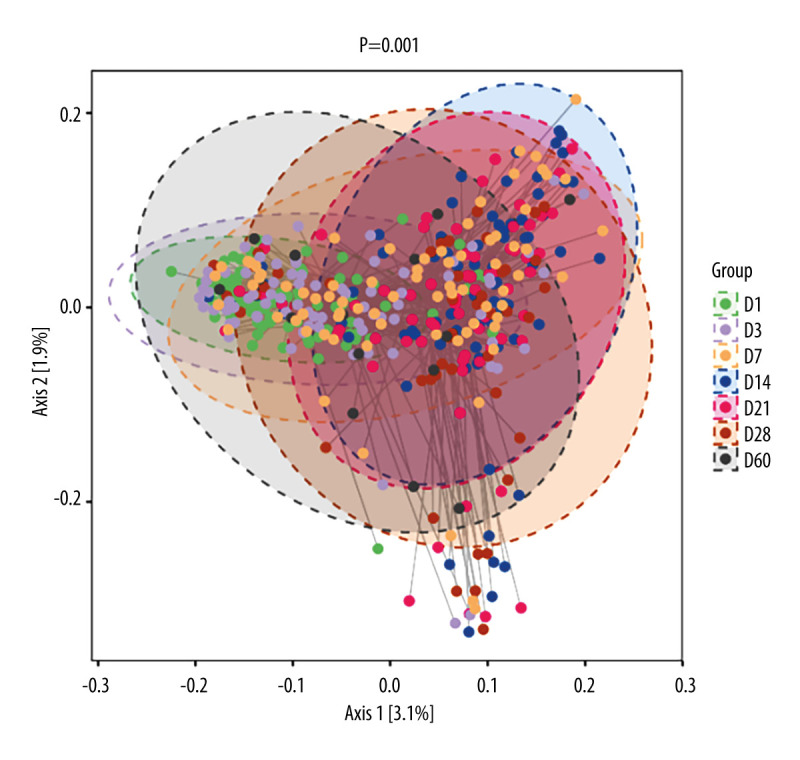
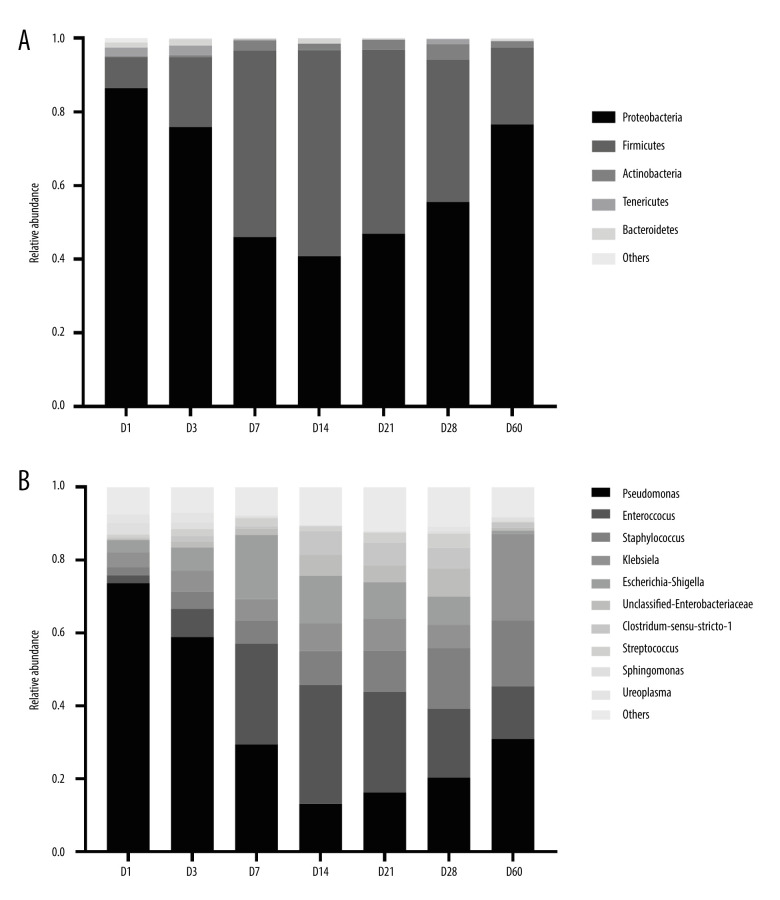
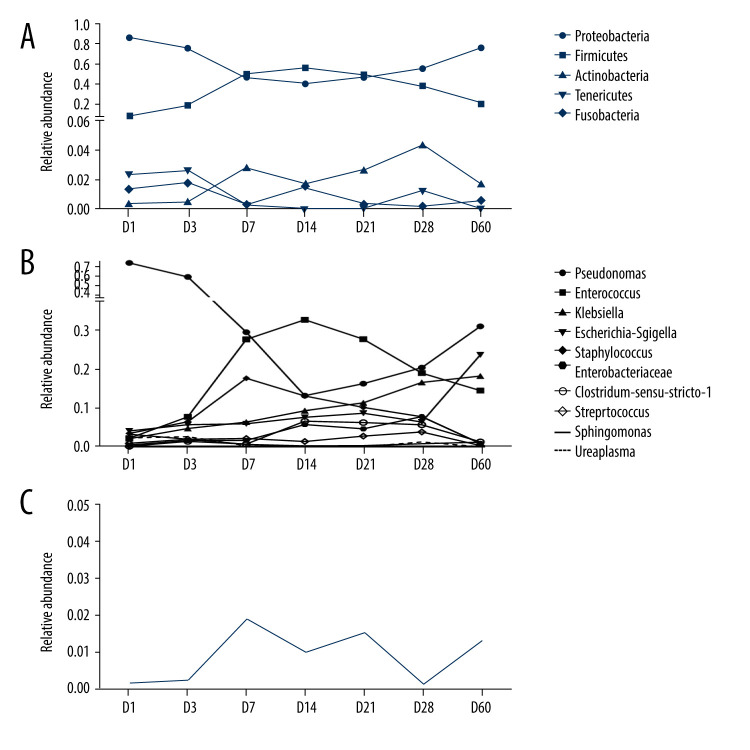
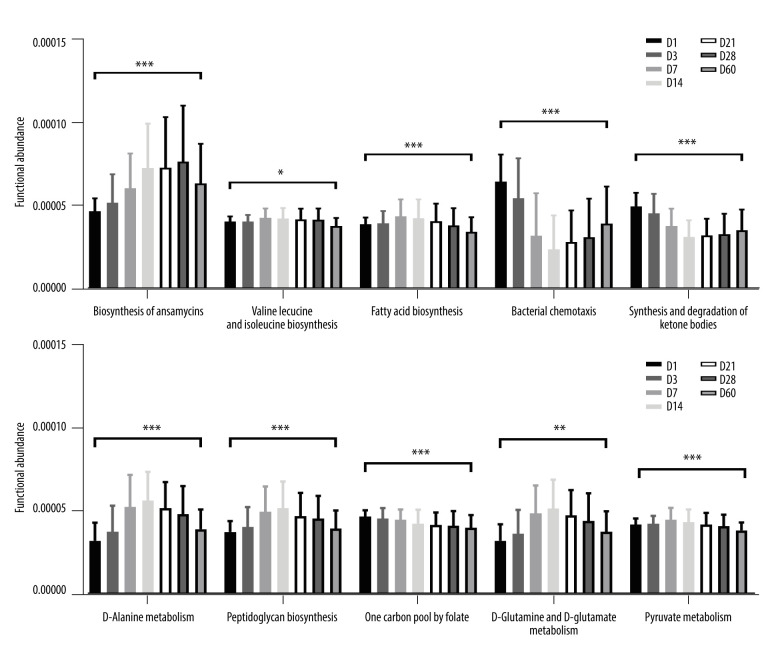
BACKGROUND Neonatal gut diversity is influenced by birth conditions and probiotic/antibiotic use. The gut microbiota affects brain development, immunity, and risk of diseases. Preterm infants, especially in neonatal intensive care units (NICUs), have different gut flora from full-term infants, suggesting in utero microbial colonization. This study examined gut microbiota changes in 92 NICU preterm infants in China. MATERIAL AND METHODS We collected data on 92 preterm infants admitted to the NICU immediately after birth, and fecal samples were collected on days 1, 3, 7, 14, 21, 28, and 60. We analyzed changes in intestinal bacteria through 16S rRNA sequencing, predicted the change in gut microbiota function over time, and compared the effects of main feeding modality on the intestinal bacteria of preterm infants. RESULTS At the phylum level, the top 5 phyla in total accounted for 99.69% of the abundance, in decreasing order of abundance: Proteobacteria, Firmicutes, Actinobacteria, Tenericutes, and Bacteroidetes. At the genus level, the top 10 genera in terms of abundance accounted for a total of 90.90%, in decreasing order of abundance: Pseudomonas, Staphylococcus, Klebsiella, Escherichia-Shigella, unclassified Enterobacteriaceae, Staphylococcus, Clostridium-sensu-stricto-1, Streptococcus, Sphingomonas, and Ureaplasma. The abundance of Proteobacteria and Pseudomonas showed a decreasing trend at first, reached a minimum at day 14, and then an increasing trend, while the opposite trend was observed for Firmicutes. The metabolic function of the bacterial community changed greatly at different time points. The abundance of Proteobacteria at the phylum level and Streptococcus at the genus level in formula-fed infants were significantly higher than in breast-fed infants. CONCLUSIONS Between 1 and 60 days, the gut microbiome in preterm infants in the NICU changed with changes in feeding patterns, with the main gut bacteria being from the phyla, Proteobacteria, and Pseudomonas.
Conflict of interest statement
Figures
Similar articles
-
Prenatal and postnatal antibiotic exposure influences the gut microbiota of preterm infants in neonatal intensive care units.Ann Clin Microbiol Antimicrob. 2018 Mar 19;17(1):9. doi: 10.1186/s12941-018-0264-y. Ann Clin Microbiol Antimicrob. 2018. PMID: 29554907 Free PMC article.
-
Early Gut Microbiota Changes in Preterm Infants with Bronchopulmonary Dysplasia: A Pilot Case-Control Study.Am J Perinatol. 2021 Sep;38(11):1142-1149. doi: 10.1055/s-0040-1710554. Epub 2020 May 23. Am J Perinatol. 2021. PMID: 32446254
-
Characterizing the fecal microbiota of infants with botulism.Microbiome. 2015 Nov 23;3:54. doi: 10.1186/s40168-015-0119-0. Microbiome. 2015. PMID: 26593441 Free PMC article.
-
Exploring the Role of Gut Bacteria in Health and Disease in Preterm Neonates.Int J Environ Res Public Health. 2020 Sep 23;17(19):6963. doi: 10.3390/ijerph17196963. Int J Environ Res Public Health. 2020. PMID: 32977611 Free PMC article. Review.
-
Gut microbiota alterations in colorectal adenoma-carcinoma sequence based on 16S rRNA gene sequencing: A systematic review and meta-analysis.Microb Pathog. 2024 Oct;195:106889. doi: 10.1016/j.micpath.2024.106889. Epub 2024 Aug 26. Microb Pathog. 2024. PMID: 39197689
Cited by
-
Dysbiosis of infant gut microbiota is related to the altered fatty acid composition of human milk from mothers with gestational diabetes mellitus: a prospective cohort study.Gut Microbes. 2025 Dec;17(1):2455789. doi: 10.1080/19490976.2025.2455789. Epub 2025 Jan 21. Gut Microbes. 2025. PMID: 39834317 Free PMC article.
-
Maternal and infant microbiome and birth anthropometry.iScience. 2024 Jun 21;27(10):110312. doi: 10.1016/j.isci.2024.110312. eCollection 2024 Oct 18. iScience. 2024. PMID: 39386758 Free PMC article.
References
-
- Ficara M, Pietrella E, Spada C, et al. Changes of intestinal microbiota in early life. J Matern Fetal Neonatal Med. 2020;33(6):1036–43. - PubMed
MeSH terms
Substances
LinkOut - more resources
Full Text Sources
Medical
