. 2023 Nov 29;290(2011):20231581.
doi: 10.1098/rspb.2023.1581. Epub 2023 Nov 29.

The African mosquito-borne diseasosome: geographical patterns, range expansion and future disease emergence

Affiliations

The African mosquito-borne diseasosome: geographical patterns, range expansion and future disease emergence

Tovi Lehmann et al. Proc Biol Sci. .

Abstract

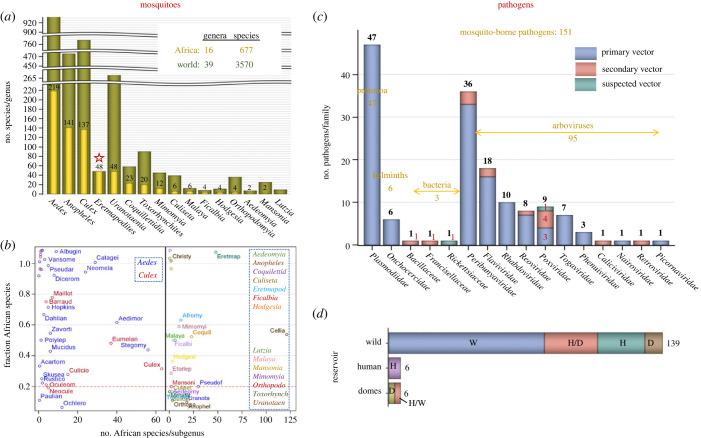
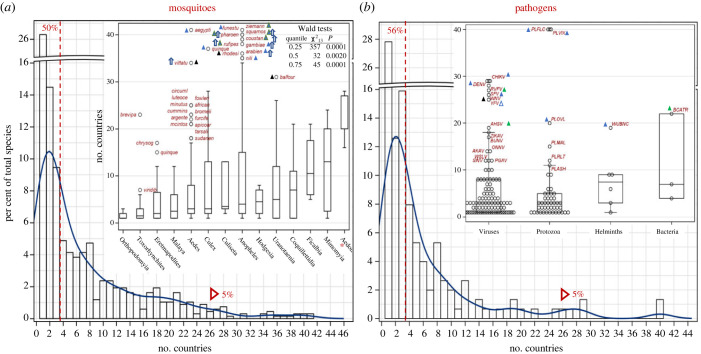
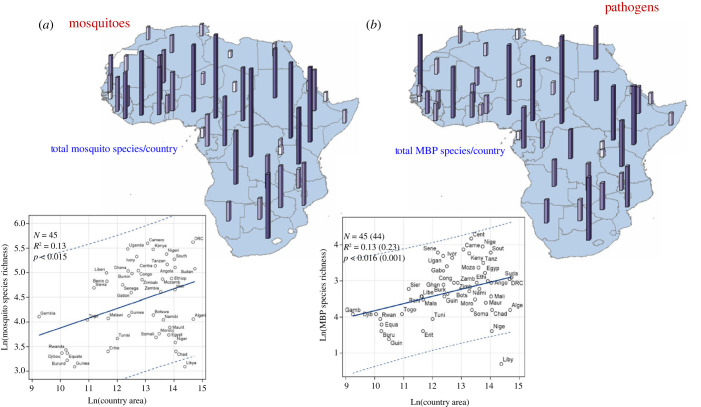
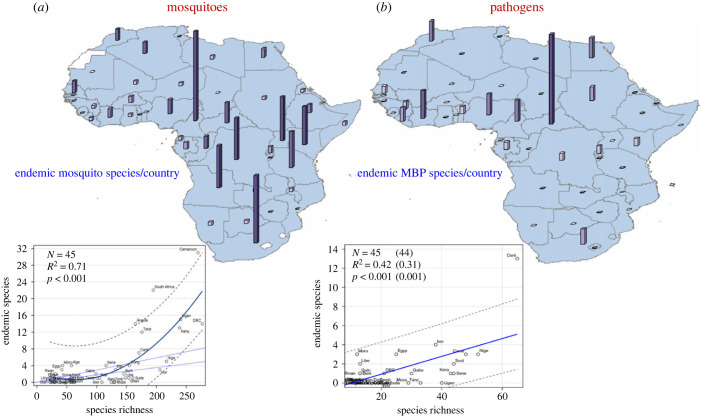
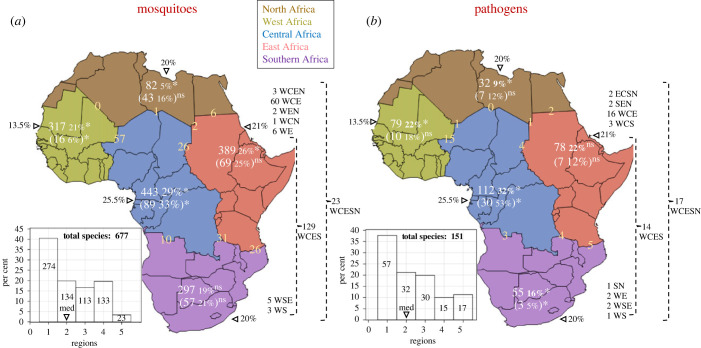
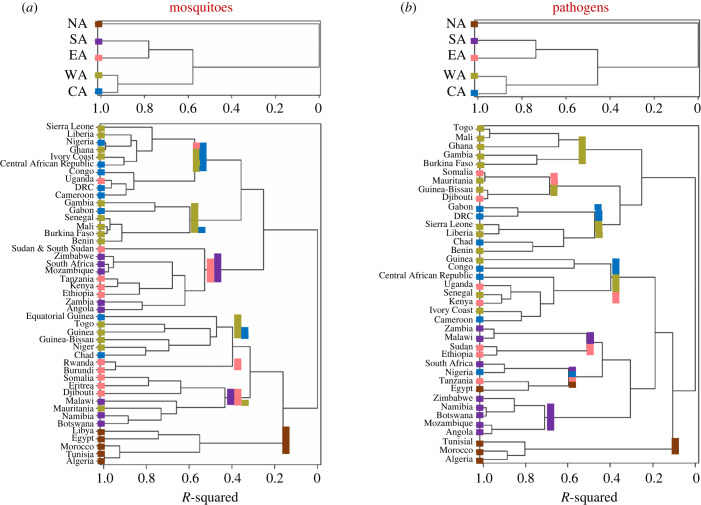
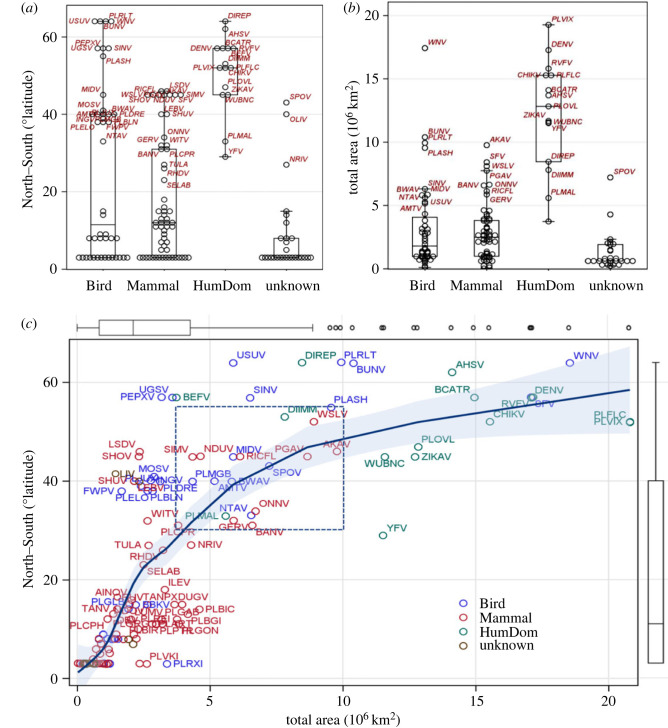
Mosquito-borne diseases (MBDs) threaten public health and food security globally. We provide the first biogeographic description of the African mosquito fauna (677 species) and the 151 mosquito-borne pathogens (MBPs) they transmit. While mosquito species richness agrees with expectations based on Africa's land surface, African arboviruses and mammalian plasmodia are more speciose than expected. Species assemblages of mosquitoes and MBPs similarly separate sub-Saharan Africa from North Africa, and those in West and Central Africa from eastern and southern Africa. Similarities between mosquitoes and MBPs in diversity and range size suggest that mosquitoes are key in delimiting the range of MBPs. With approximately 25% endemicity, approximately 50% occupying one to three countries and less than 5% occupying greater than 25 countries, the ranges of mosquitoes and MBPs are surprisingly small, suggesting that most MBPs are transmitted by a single mosquito species. Exceptionally widespread mosquito species feed on people and livestock, and most are high-altitude-windborne migrants. Likewise, widespread MBPs are transmitted among people or livestock by widespread mosquitoes, suggesting that adapting to people or livestock and to widespread mosquito species promote range expansion in MBPs. Range size may predict range expansion and emergence risk. We highlight key knowledge gaps that impede prediction and mitigation of future emergence of local and global MBDs.

Keywords: arbovirus; biodiversity; disease ecology; global health; one health; vector-borne diseases.


Conflict of interest statement

We declare we have no competing interests.

Figures

Figure 1.
Figure 1.
Taxonomical profile of African mosquitoes and MBPs. (a) Number of African species/genera (gold and numerals) compared with the total number worldwide (green). Star denotes entirely African genus. Note: breaks in the y-axis. (b) The fraction of African mosquito species per subgenus (y-axis) of their worldwide total in relation to their number in Africa (x-axis). To minimize label overlap, values near 1 were jittered. Subgenera labels (abbreviated) are shown if they have two or more species. Where no subgenera are known, e.g. Ficalbia (electronic supplementary material, table S1), genus names were used. Corresponding genera (bold italic font) of the same colour are listed in the dotted frame. Red line marks expected 20% based on Africa's share of land surface (see text). (c) Taxonomic composition of African MBPs of vertebrates by family and importance of mosquito-borne transmission (see legend). Suspected mosquito transmission reflects compelling, yet non-definitive evidence (electronic supplementary Data File 2). The number of pathogens in each family is shown above bars (black) and the total by taxonomic group shown across (gold). The number of pathogens transmitted mechanically are listed (red). (d) Division of MBPs by group of vertebrate hosts acting as reservoir (y-axis) and by the host group impacted by the pathogen (subgroups in colour). Key: W, H and D denote wild, human and domestic animal (those raised by people, Domes), respectively, and H/D denotes that humans and domestic animals are impacted by MBPs whose reservoir are wild animals.
Figure 2.
Figure 2.
Geographic range size of mosquitoes (a) and MBPs (b) based on the number of countries per species overall and by taxonomical groups (insets). Note the break in the y-axis. The fraction of species occupying 1–3 countries and over 25 countries are shown to the left of the red broken line and red triangle, respectively. Insets: number of countries per species across mosquito genera (a) and taxonomic group of MBPs (b). Genera represented by less than three species (Lutzia (N = 1), Mansonia (N = 2) and Aedeomyia (N = 2)) were pooled (red asterisk). The box shows the 25th, 50th and 75th quantiles of the distribution and the whiskers extend to the extreme observations up to 1.5× the interquartile range (75th–25th quantiles). Outliers exceeding the whiskers are shown by abbreviated species name (a) and acronym (b) in red; triangles indicate preference to blood feeding on (a) and transmission between (b) humans (blue) domestic animals (green) and wild hosts (black). Empty triangle (b) indicates transmission to humans but no persistent transmission from humans. Blue arrows indicate high-altitude windborne species (see text). Table (a) summarizes results of the quantile regression across quartiles (see text).
Figure 3.
Figure 3.
Maps showing mosquito (a) and MBP (b) country diversity (top) and the country's area–species richness relationship (bottom). Bar height and colour shows total endemic species per country (top). Linear regression (solid line) shows the increase in expected number of species per country given its area with 95% confidence limit for individual countries (broken lines). Values in parenthesis (b) show the change in the regression's summary statistics after exclusion of outliers. Abbreviated country names are used. Note: countries with insufficient information are excluded (e.g. Eswatini), or pooled together (e.g. South and North Sudan) to reflect available information (Methods).
Figure 4.
Figure 4.
Maps showing endemic species of mosquito (a) and MBP (b) per country (top) and the relationship between species endemicity and richness (bottom). Bar height and colour shows total endemic species per country (top). Quadratic (a, bottom) and linear regression (b, bottom) solid lines show the increase in expected mean number of endemic species given species richness with 95% confidence limits for individual countries (broken lines). Dotted lines show expected linear trends assuming monotonic increase predicted by the mean (higher) and median (lower) ratio of endemics to total species. Values in parenthesis (b) show the regression summary statistics after exclusion of outliers. Abbreviated country names are used.
Figure 5.
Figure 5.
Composition of mosquitoes (a) and MBP species (b) across five regions in Africa (North, West, Central, East and Southern Africa). Regional species richness and (region endemic) in absolute and percentage numbers (white font) against each region's relative landmass in per cent (black font behind triangles). Statistically significant departures (p < 0.05) of the actual species richness or endemicity from expectations based on the region area is marked by ‘*’; ‘ns’ denotes insignificant departure. The number of species between two and three adjacent regions are shown at the border between regions (yellow font). Number of species shared between disjoined regions are shown on the right (black) before the regions' acronym. Histogram showing the number of species occupying different number of regions (median = 2, marked by a black triangle, mean = 2.25).
Figure 6.
Figure 6.
Dendrograms showing clustering of regions (above) and countries (below) based on species composition of mosquitoes (a) and MBPs (b). Region and country colour follows colour of the regions in figure 5 (North Africa (brown), West Africa (green), Central Africa (blue), East Africa (pink), Southern Africa (purple)).
Figure 7.
Figure 7.
Ranking of African MBPs by their range area and maximum north–south distance to estimate their phase of range expansion. (a) Variation between host groups (HumDom denotes pathogens transmitted by vector among humans or domestic animals) in north–south distance (latitude degrees) and (b) variation between host groups total range area (106 km2). (c) Relationship between MBP's total area (106 km2; x-axis) and the maximum north–south distance (degrees latitude; y-axis) using local regression (locally estimated scatterplot smoothing (loess) and 95% confidence limits of the mean (response) (CLM) on all MBDs (N = 150). Box plots along axes display distributions of corresponding variables. Acronym of MBPs are given for those with total area larger than 2.5 or north–south longer than 5° and colours denote host group (birds were used if birds and mammals are thought to act as natural hosts). Box draws attention to putative MBPs at intermediate phase of range expansion (excluding MBPs of birds and domestic animals, see text).

Similar articles

Cited by

References

    1. W.H.O. 2020. Vector-borne diseases [WWW Document] [accessed on 2020]. https://www.who.int/news-room/fact-sheets/detail/vector-borne-diseases.
    1. Lomolino MV. 2020. Biogeography a very short introduction, 1st edn. Oxford, UK: Oxford University Press.
    1. Swei A, Couper LI, Coffey LL, Kapan D, Bennett S. 2020. Patterns, drivers, and challenges of vector-borne disease emergence. Vector-Borne Zoonot. Dis. 20, 159-170. (10.1089/vbz.2018.2432) - DOI - PMC - PubMed
    1. Burgess ND, Hales JD, Underwood E, Dinerstein E, Olson D, Itoua I, Schipper J, Rickkets T, Newman K. 2004. Terrestrial eco-regions of Africa and Madagascar: A conservation assessment. Washington, DC: Island Press.
    1. Guernier V, Hochberg ME, Guégan JF. 2004. Ecology drives the worldwide distribution of human diseases. PLoS Biol. 2, e141. (10.1371/journal.pbio.0020141) - DOI - PMC - PubMed

LinkOut - more resources