. 2023 Nov 29;290(2011):20231461.
doi: 10.1098/rspb.2023.1461. Epub 2023 Nov 29.

Sub-communities of the vaginal microbiota in pregnant and non-pregnant women

Affiliations

Sub-communities of the vaginal microbiota in pregnant and non-pregnant women

Laura Symul et al. Proc Biol Sci. .

Abstract

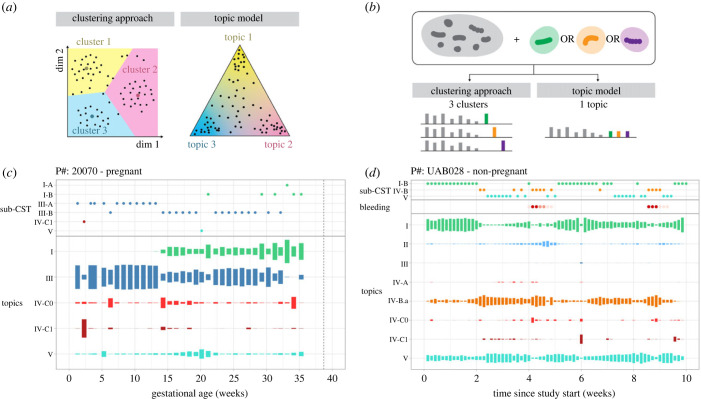
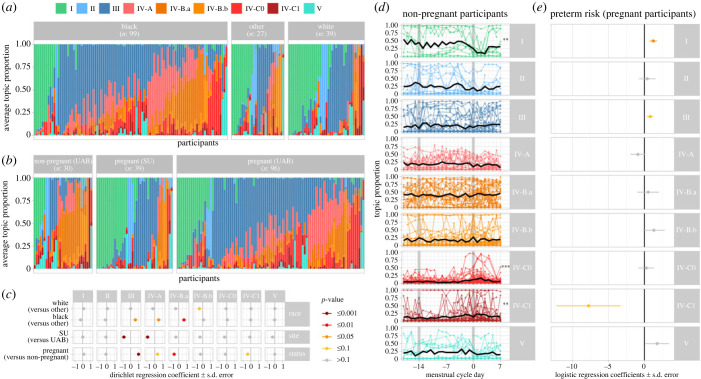
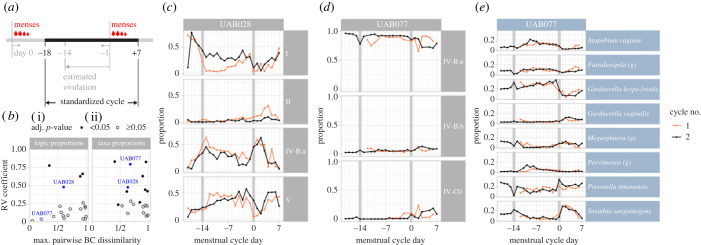
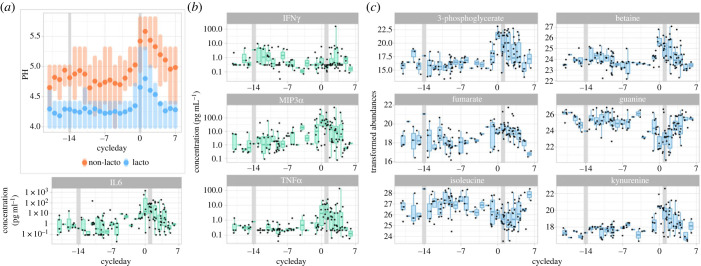
Diverse and non-Lactobacillus-dominated vaginal microbial communities are associated with adverse health outcomes such as preterm birth and the acquisition of sexually transmitted infections. Despite the importance of recognizing and understanding the key risk-associated features of these communities, their heterogeneous structure and properties remain ill-defined. Clustering approaches are commonly used to characterize vaginal communities, but they lack sensitivity and robustness in resolving substructures and revealing transitions between potential sub-communities. Here, we address this need with an approach based on mixed membership topic models. Using longitudinal data from cohorts of pregnant and non-pregnant study participants, we show that topic models more accurately describe sample composition, longitudinal changes, and better predict the loss of Lactobacillus dominance. We identify several non-Lactobacillus-dominated sub-communities common to both cohorts and independent of reproductive status. In non-pregnant individuals, we find that the menstrual cycle modulates transitions between and within sub-communities, as well as the concentrations of half of the cytokines and 18% of metabolites. Overall, our analyses based on mixed membership models reveal substructures of vaginal ecosystems which may have important clinical and biological associations.

Keywords: menstrual cycle; multi-omics; pregnancy; vaginal microbiota.


Conflict of interest statement

J.R. is the cofounder of LUCA Biologics, a biotechnology company focusing on translating microbiome research into live biotherapeutics drugs for women's health. All remaining authors have no disclosures to declare.

Figures

Figure 1.
Figure 1.
Topic models are mixed membership models and reveal transitions between states. (a) Schematics contrasting sample characterization in a lower dimensional space by clustering methods versus topic models. In both schematics, each dot is a sample. Larger coloured dots in the clustering schematic indicate centroids. (b) Schematic illustrating how clustering versus topic models would capture a ‘functional equivalence’ phenomenon. Two or more species are potentially ‘functionally equivalent’ if they occupy the same ecological niche (thrive in similar environments and with other species) but rarely co-occur because they may compete for the same resources. (c–d) Examples of time-series displays of changes in microbiota composition summarized by cluster membership (sub-CST—top) or topic proportions (bottom) in a (c) pregnant and (d) non-pregnant participant. Topics were labelled such that their name matched the (sub)CST with the most similar composition (figure 2c). The height of the topic rectangles codes for the proportion of that topic in samples. Their proportion for a given sample sums to 1.
Figure 2.
Figure 2.
Sub-communities identified by topic models. (a) Alignment of topics (rectangles) for models fitted with an increasing number of topics (x-axis). The rectangle's height scales with the total proportion of the corresponding topic in all samples: taller rectangles represent more prevalent topics. Topics are connected across models (x-axis) according to their alignment weights, which reflect their similarities (see Material and methods). Topics of the k = 9 model are annotated with their most prevalent species, and the numbers in brackets indicate the proportion of that species in the topic. Annotations included the three most prevalent species that made up at least 5% of the topic composition. (b) Topic composition for k = 5 (coarse representation, left) or k = 9 (optimal tradeoff between dimension reduction and descriptive accuracy, right) topics. The proportion of each species (y-axis) within each topic (x-axis) is encoded by the dot size. Proportions sum to 1 for each topic. For readability and conciseness, species were included if they accounted for at least 0.5% of a topic. (c) Comparison of the topics (x-axis) and sub-CSTs (y-axis) compositions. Topics and sub-CSTs with similar compositions are characterized by a low Bray–Curtis dissimilarity and a darker hue. (d) Bray–Curtis dissimilarity between actual and predicted sample composition (y-axis) by sub-CSTs or topics (x-axis) in non-pregnant (i) and pregnant (ii) individuals. Each line is a sample, coloured by its sub-CST membership. Stars indicate statistical significance of a one-sided paired t-test (***p < 0.001). (e) F1 scores (harmonic mean of precision and sensitivity, y-axis) for the prediction of Lactobacillus dominance loss (i.e. total proportion of Lactobacillus falling below 50%) at the next sample when predicted from sub-CST membership (light green) or topic memberships (dark turquoise). Distributions were obtained from 10 independent training-testing sets (electronic supplementary material, methods). Thin lines connect F1 scores from the same training-testing set.
Figure 3.
Figure 3.
Sub-communities and demographic and reproductive characteristics. (a–b) Topic composition per racial group (a) or cohort (b). Vertical bars show the average proportion of each topic (colour) for each participant (x-axis), ordered by their most prevalent topic. (c) Dirichlet regression estimated coefficients (x-axis) quantifying the associations between race, study site, pregnancy status (y-axis) and topic proportions (horizontal panels). Colours indicate the statistical significance. (d) Topic proportions throughout the menstrual cycle (day 0 indicates the first day of menses—figure 4a). Each dot is a sample. Lines connect samples from the same participant and cycle. Thick black lines show the average topic proportions across all participants. Stars on the right indicate the statistical significance of the associations between topic proportions and menstrual cycle (***p < 0.001, **p < 0.01). (e) Logistic regression estimated coefficients (x-axis) quantifying the association between average topic proportion and preterm birth in pregnant individuals. Colours are as in (c).
Figure 4.
Figure 4.
The menstrual cycle shapes microbial composition. (a) Schematic illustrating the features of standardized cycles. (b) Scatter plot, in which each dot is a participant, showing the RV coefficient of agreement (y-axis) between the proportions of topics (i) or taxa (ii) of a participant's consecutive cycles and (x-axis) the magnitude of change in microbiota composition throughout the cycle measured by the maximum of the pairwise Bray–Curtis dissimilarity between composition at each cycleday. Participants shown in ce are highlighted in blue. (c–d) Topic composition of two participants with data available for at least two menstrual cycles (first in orange, second in black). The time-series display shows topic proportion (y-axis) on each cycle day (x-axis). Topics were included if their median proportion across cycles was higher than 1% and their maximal proportion higher than 5%. (e) The same display as in d but with the taxa proportions on the y-axis. Taxa with median proportion higher than 1% and maximal proportion higher than 10% were included.
Figure 5.
Figure 5.
Vaginal pH, cytokines and metabolites throughout the menstrual cycle. (a) Distribution of vaginal pH throughout the menstrual cycle in Lactobacillus-dominated samples (blue) and non-Lactobacillus-dominated samples (orange). Dots indicate the means, shaded vertical bars span the 25th–75th percentiles. (b,c) Concentration (y-axis) of four cytokines (b) and six metabolites (c) with significant variations throughout the menstrual cycle (x-axis). Each dot is a sample.

Similar articles

Cited by

References

    1. Brotman RM. 2011. Vaginal microbiome and sexually transmitted infections: an epidemiologic perspective. J. Clin. Invest. 121, 4610-4617. (10.1172/JCI57172) - DOI - PMC - PubMed
    1. Gilbert JA, Blaser MJ, Caporaso JG, Jansson JK, Lynch SV, Knight R. 2018. Current understanding of the human microbiome. Nat. Med. 24, 392-400. (10.1038/nm.4517) - DOI - PMC - PubMed
    1. Kroon SJ, Ravel J, Huston WM. 2018. Cervicovaginal microbiota, women's health, and reproductive outcomes. Fertil. Steril. 110, 327-336. (10.1016/j.fertnstert.2018.06.036) - DOI - PubMed
    1. Callahan BJ, et al. 2017. Replication and refinement of a vaginal microbial signature of preterm birth in two racially distinct cohorts of US women. Proc. Natl Acad. Sci. USA 114, 9966-9971. (10.1073/pnas.1705899114) - DOI - PMC - PubMed
    1. Elovitz MA, et al. 2019. Cervicovaginal microbiota and local immune response modulate the risk of spontaneous preterm delivery. Nat. Commun. 10, 1305. - PMC - PubMed

Substances

LinkOut - more resources