

Differential longitudinal changes of hippocampal subfields in patients with anorexia nervosa
- PMID: 38018338
- PMCID: PMC11488614
- DOI: 10.1111/pcn.13626
Differential longitudinal changes of hippocampal subfields in patients with anorexia nervosa
Abstract
Background: Anorexia nervosa (AN) is a mental disorder characterized by dietary restriction, fear of gaining weight, and distorted body image. Recent studies indicate that the hippocampus, crucial for learning and memory, may be affected in AN, yet subfield-specific effects remain unclear. We investigated hippocampal subfield alterations in acute AN, changes following weight restoration, and their associations with leptin levels.
Methods: T1-weighted magnetic resonance imaging scans were processed using FreeSurfer. We compared 22 left and right hemispheric hippocampal subfield volumes cross-sectionally and longitudinally in females with acute AN (n = 165 at baseline, n = 110 after partial weight restoration), healthy female controls (HCs; n = 271), and females after long-term recovery from AN (n = 79) using linear models.
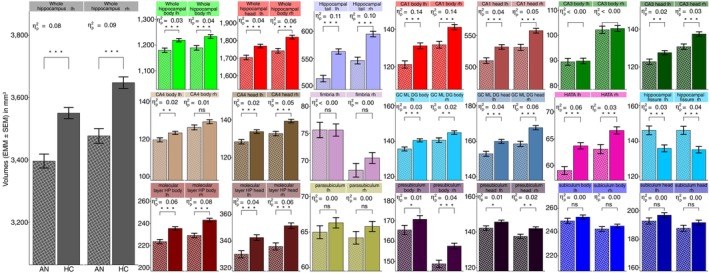
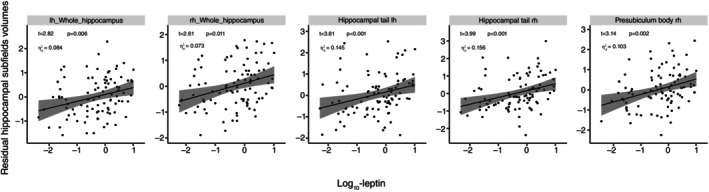
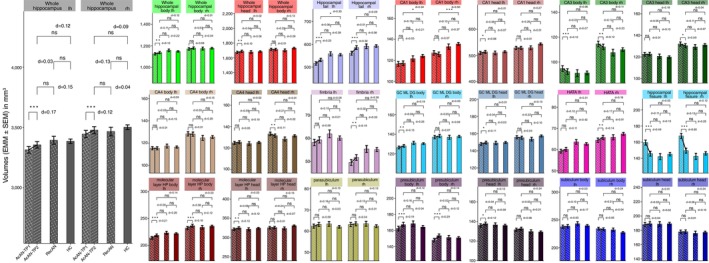
Results: We found that most hippocampal subfield volumes were significantly reduced in patients with AN compared with HCs (~-3.9%). Certain areas such as the subiculum exhibited no significant reduction in the acute state of AN, while other areas, such as the hippocampal tail, showed strong decreases (~-9%). Following short-term weight recovery, most subfields increased in volume. Comparisons between participants after long-term weight-recovery and HC yielded no differences. The hippocampal tail volume was positively associated with leptin levels in AN independent of body mass index.
Conclusions: Our study provides evidence of differential volumetric differences in hippocampal subfields between individuals with AN and HC and almost complete normalization after weight rehabilitation. These alterations are spatially inhomogeneous and more pronounced compared with other major mental disorders (e.g. major depressive disorder and schizophrenia). We provide novel insights linking hypoleptinemia to hippocampal subfield alterations hinting towards clinical relevance of leptin normalization in AN recovery.
Keywords: FreeSurfer; anorexia nervosa; hippocampus; leptin; longitudinal study.
© 2023 The Authors. Psychiatry and Clinical Neurosciences published by John Wiley & Sons Australia, Ltd on behalf of Japanese Society of Psychiatry and Neurology.
Figures
Similar articles
-
Dynamic Amygdala Nuclei Alterations in Relation to Weight Status in Anorexia Nervosa Are Mediated by Leptin.J Am Acad Child Adolesc Psychiatry. 2024 Jun;63(6):624-639. doi: 10.1016/j.jaac.2023.08.015. Epub 2023 Oct 3. J Am Acad Child Adolesc Psychiatry. 2024. PMID: 37797814
-
Longitudinal changes in brain-derived neurotrophic factor (BDNF) but not cytokines contribute to hippocampal recovery in anorexia nervosa above increases in body mass index.Psychol Med. 2024 Jul;54(9):2242-2253. doi: 10.1017/S0033291724000394. Epub 2024 Mar 7. Psychol Med. 2024. PMID: 38450444 Free PMC article.
-
Altered hippocampal subfield volumes in major depressive disorder with and without anhedonia.BMC Psychiatry. 2023 Jul 25;23(1):540. doi: 10.1186/s12888-023-05001-6. BMC Psychiatry. 2023. PMID: 37491229 Free PMC article.
-
Hippocampal volume, function, and related molecular activity in anorexia nervosa: A scoping review.Expert Rev Clin Pharmacol. 2020 Dec;13(12):1367-1387. doi: 10.1080/17512433.2020.1850256. Epub 2020 Nov 25. Expert Rev Clin Pharmacol. 2020. PMID: 33176113
-
Hippocampal volume and hippocampal neuron density, number and size in schizophrenia: a systematic review and meta-analysis of postmortem studies.Mol Psychiatry. 2021 Jul;26(7):3524-3535. doi: 10.1038/s41380-020-0853-y. Epub 2020 Jul 28. Mol Psychiatry. 2021. PMID: 32724199 Free PMC article.
Cited by
-
Increased Serum Neurofilament Light Chain Concentration Associated With Microglial Morphology Changes in Chronically-Starved Mice.Int J Eat Disord. 2025 Jun;58(6):1130-1143. doi: 10.1002/eat.24423. Epub 2025 Mar 22. Int J Eat Disord. 2025. PMID: 40119726 Free PMC article.
-
Eating- and Weight-Related Disorders in the Armed Forces.Metabolites. 2024 Dec 1;14(12):667. doi: 10.3390/metabo14120667. Metabolites. 2024. PMID: 39728448 Free PMC article. Review.
-
Anorexia-Induced Hypoleptinemia Drives Adaptations in the JAK2/STAT3 Pathway in the Ventral and Dorsal Hippocampus of Female Rats.Nutrients. 2024 Apr 15;16(8):1171. doi: 10.3390/nu16081171. Nutrients. 2024. PMID: 38674862 Free PMC article.
-
The Impact of Age on Gray Matter Volume Reduction in Anorexia Nervosa: A Systematic Review.medRxiv [Preprint]. 2025 Mar 4:2025.03.03.25322748. doi: 10.1101/2025.03.03.25322748. medRxiv. 2025. PMID: 40093206 Free PMC article. Preprint.
References
-
- Bahnsen K, Bernardoni F, King JA et al. Dynamic structural brain changes in anorexia nervosa: A replication study, mega‐analysis, and virtual histology approach. J. Am. Acad. Child Adolesc. Psychiatry 2022; S0890‐8567: 183–186. - PubMed
-
- Seitz J, Herpertz‐Dahlmann B, Konrad K. Brain morphological changes in adolescent and adult patients with anorexia nervosa. J. Neural Transm. (Vienna) 1996; 2016: 949–959. - PubMed
-
- Walton E, Bernardoni F, Batury V‐L et al. Brain structure in acutely underweight and partially weight‐restored individuals with anorexia nervosa: A coordinated analysis by the ENIGMA eating disorders working group. Biol. Psychiatry 2022; 92: 730–738. - PubMed
MeSH terms
Substances
Grants and funding
LinkOut - more resources
Full Text Sources
Medical
