. 2024 Mar 5;149(10):774-787.
doi: 10.1161/CIRCULATIONAHA.123.065959. Epub 2023 Nov 29.

Flipped C-Terminal Ends of APOA1 Promote ABCA1-Dependent Cholesterol Efflux by Small HDLs

Affiliations

Flipped C-Terminal Ends of APOA1 Promote ABCA1-Dependent Cholesterol Efflux by Small HDLs

Yi He et al. Circulation. .

Abstract

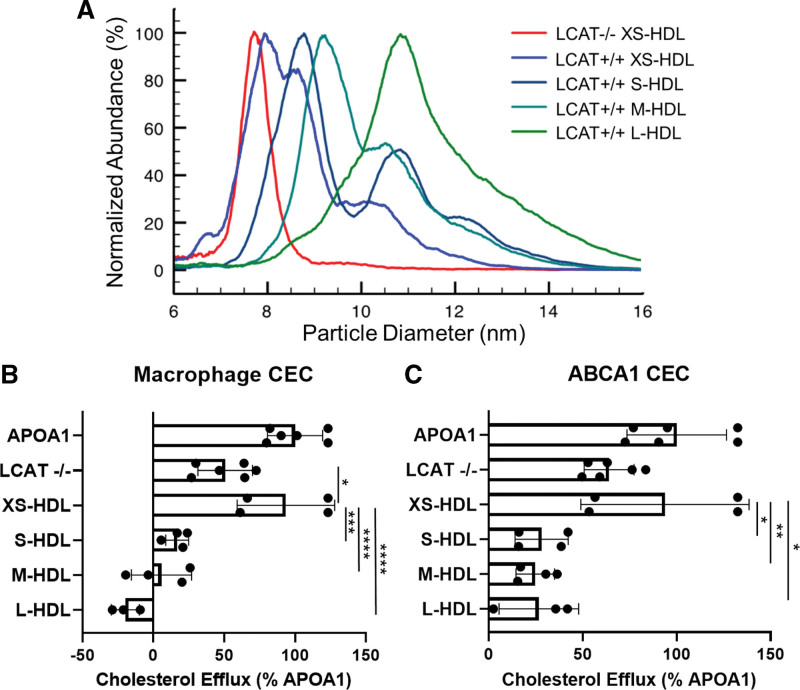
Background: Cholesterol efflux capacity (CEC) predicts cardiovascular disease independently of high-density lipoprotein (HDL) cholesterol levels. Isolated small HDL particles are potent promoters of macrophage CEC by the ABCA1 (ATP-binding cassette transporter A1) pathway, but the underlying mechanisms are unclear.

Methods: We used model system studies of reconstituted HDL and plasma from control and lecithin-cholesterol acyltransferase (LCAT)-deficient subjects to investigate the relationships among the sizes of HDL particles, the structure of APOA1 (apolipoprotein A1) in the different particles, and the CECs of plasma and isolated HDLs.

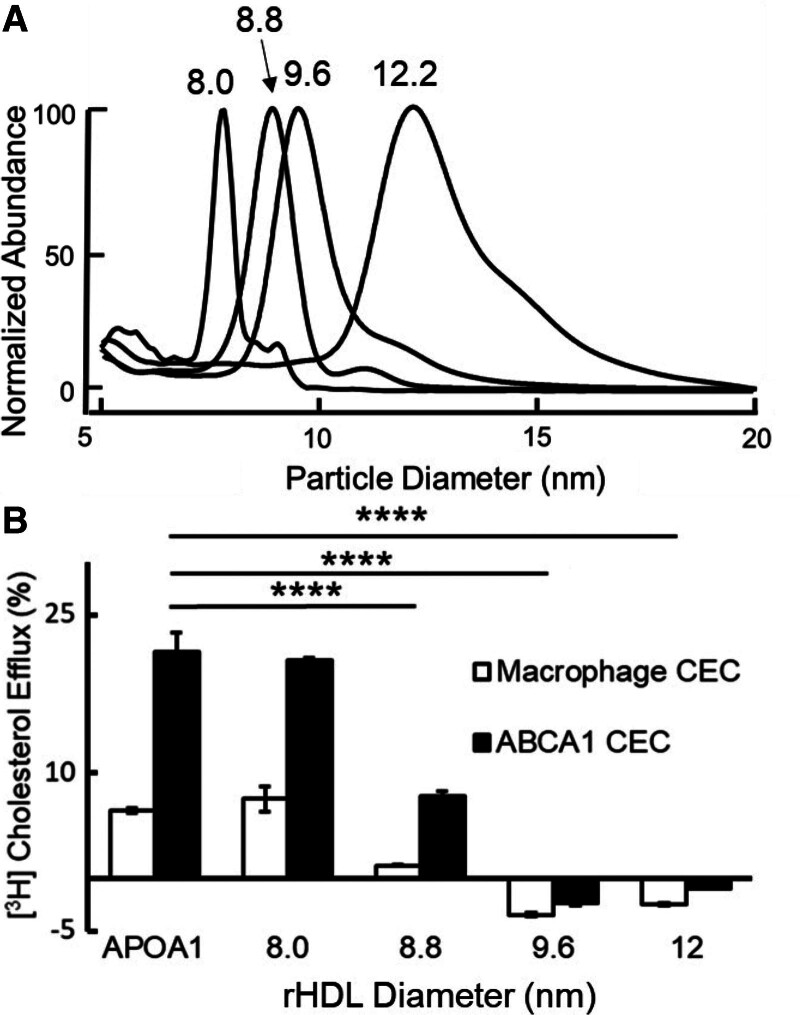
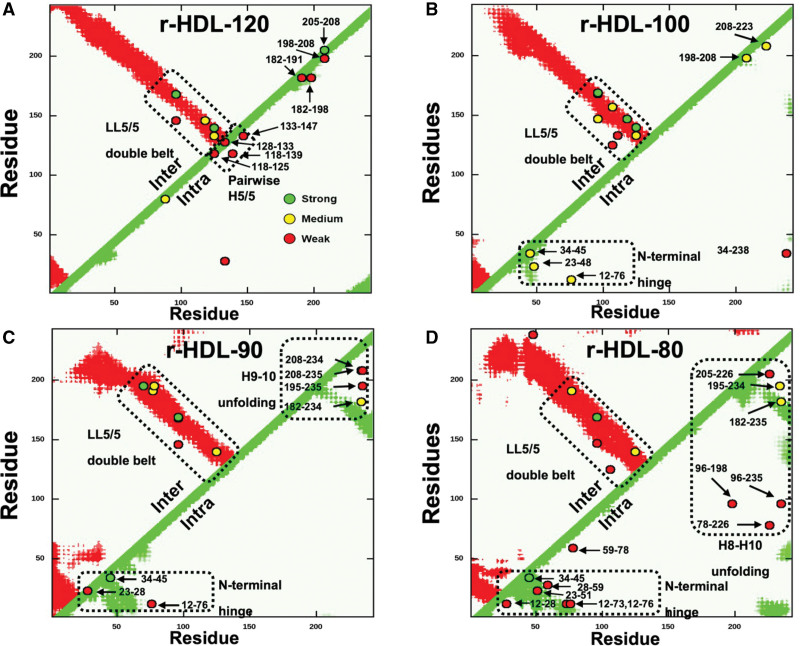
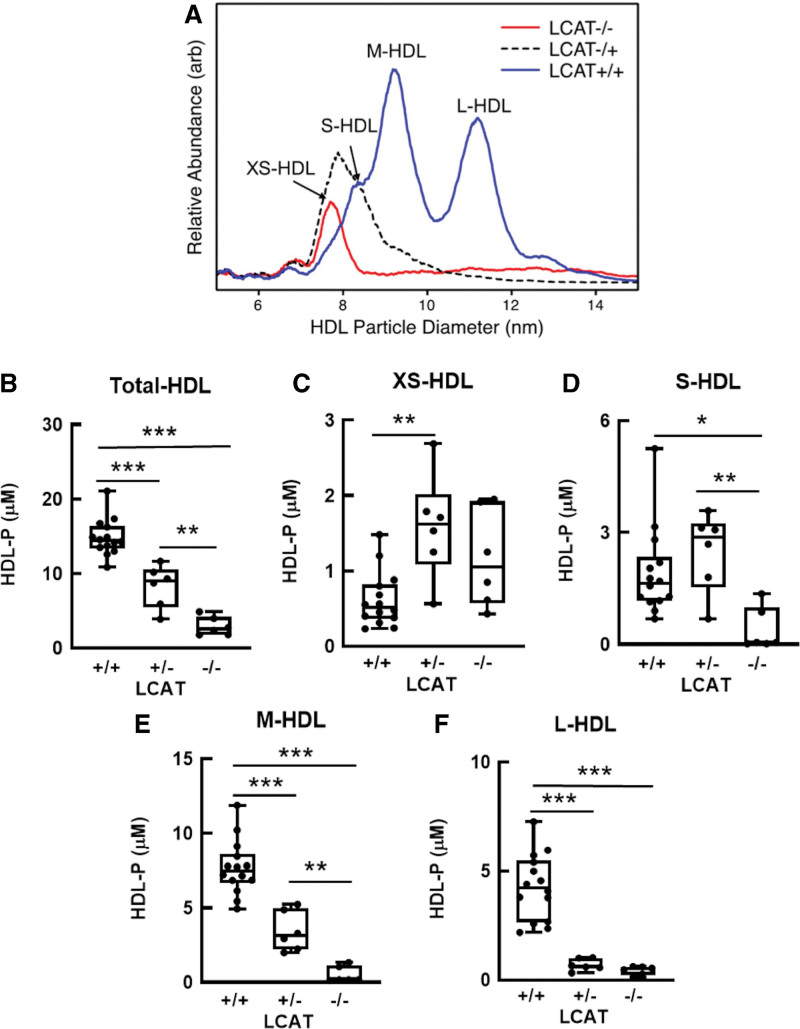
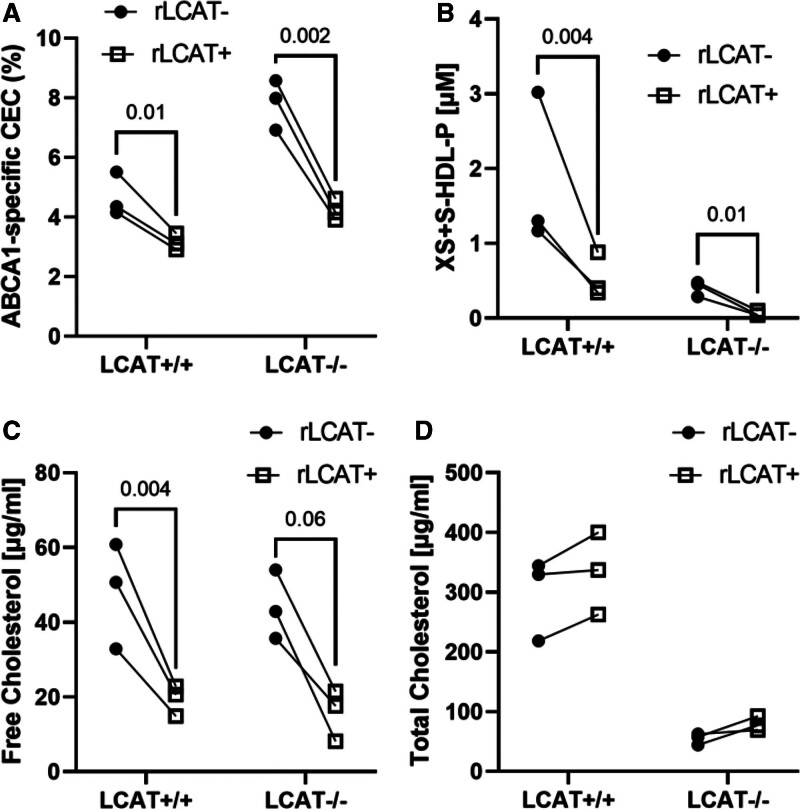
Results: We quantified macrophage and ABCA1 CEC of 4 distinct sizes of reconstituted HDL. CEC increased as particle size decreased. Tandem mass spectrometric analysis of chemically cross-linked peptides and molecular dynamics simulations of APOA1, the major protein of HDL, indicated that the mobility of C-terminus of that protein was markedly higher and flipped off the surface in the smallest particles. To explore the physiological relevance of the model system studies, we isolated HDL from LCAT-deficient subjects, whose small HDLs (like reconstituted HDLs) are discoidal and composed of APOA1, cholesterol, and phospholipid. Despite their very low plasma levels of HDL particles, these subjects had normal CEC. In both the LCAT-deficient subjects and control subjects, the CEC of isolated extra-small HDL (a mixture of extra-small and small HDL by calibrated ion mobility analysis) was 3- to 5-fold greater than that of the larger sizes of isolated HDL. Incubating LCAT-deficient plasma and control plasma with human LCAT converted extra-small and small HDL particles into larger particles, and it markedly inhibited CEC.

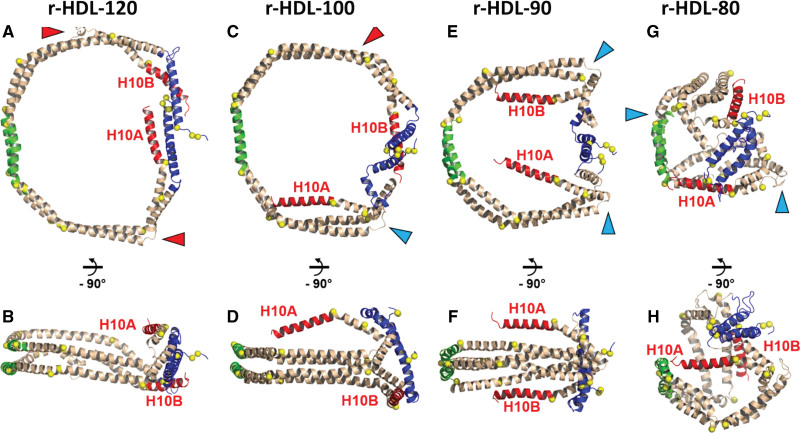
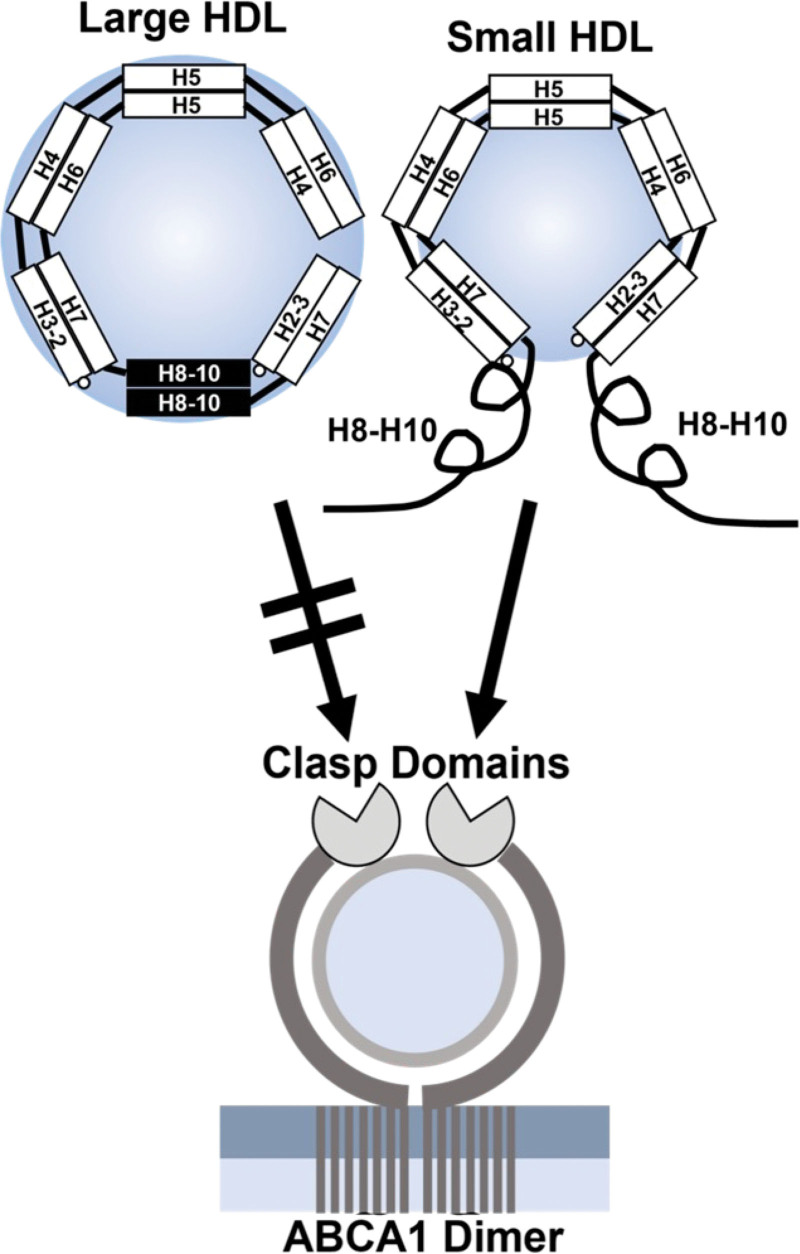
Conclusions: We present a mechanism for the enhanced CEC of small HDLs. In smaller particles, the C-termini of the 2 antiparallel molecules of APOA1 are "flipped" off the lipid surface of HDL. This extended conformation allows them to engage with ABCA1. In contrast, the C-termini of larger HDLs are unable to interact productively with ABCA1 because they form a helical bundle that strongly adheres to the lipid on the particle. Enhanced CEC, as seen with the smaller particles, predicts decreased cardiovascular disease risk. Thus, extra-small and small HDLs may be key mediators and indicators of the cardioprotective effects of HDL.

Keywords: ABCA1; atherosclerosis; cholesterol efflux capacity; computational biology; lipids and cholesterol.


Conflict of interest statement

Disclosures K.E.B. serves on the Scientific Advisory Board of Esperion Therapeutics. The other authors report no conflicts.

Figures

Figure 1.
Figure 1.
Calibrated IMA (A) and CEC (B) of reconstituted HDLs (r-HDLs) prepared by cholate dialysis and fractionation by high-resolution size exclusion chromatography. A, Representative IMA profiles of each size of r-HDL. To facilitate comparison of the size distributions of the particles, the height of each r-HDL was set to 100%. The median sizes of the isolated particles were 8.0±0.2 nm, 8.8±0.1 nm, 9.6±0.1 nm, and 12.2±0.1 nm. B, ABCA1-mediated CEC using equimolar concentrations of each size of r-HDL. Macrophage CEC and ABCA1 CEC of serum HDL were quantified after a 4-hour incubation with [3H]cholesterol-labeled J774 macrophages and baby hamster kidney cells, without or with induction of ABCA1 expression with cAMP and mifepristone, respectively. Cholesterol efflux was calculated as the percentage of radiolabel in the medium of the cells divided by the total radioactivity of the medium and cells. CEC was quantified as the difference in cholesterol efflux of cells with and without induced expression of ABCA1. Results are representative of 5 independent experiments with replicate analyses. ****P<0.001, 1-way ANOVA with Tukey-Kramer post-tests. ABCA1 indicates ATP-binding cassette transporter A1; APOA1, apolipoprotein A1; CEC, cholesterol efflux capacity; HDL, high-density lipoprotein; and IMA, ion mobility analysis.
Figure 2.
Figure 2.
Contact maps (A–D) of the intermolecular (Inter) and intramolecular (Intra) APOA1 (apolipoprotein A1) cross-links detected by tandem mass spectrometry (MS/MS) in different sizes of r-HDL. A, r-HDL-120. B, r-HDL-100. C, r-HDL-90. D, r-HDL-80. Red regions and green regions indicate the allowable distance of intermolecular and intramolecular peptide contacts (15.1 Å), respectively, in a molecular dynamics simulation of the LL5/5 double-belt model of APOA1. Cross-links (o) between APOA1 residues are labeled. Semiquantitative estimates of the strengths of interactions between residues were based on ion currents (Table S2), and they are indicated by the colors of the circles (green, strong; yellow, medium; and red, weak). Note that we detected multiple intramolecular cross-linked peptides in the helix 8 (H8) to helix 10 (H10) region and the helix 9 (H9) to helix 10 region of the C-terminus of APOA1 of r-HDL-80 and r-HDL-90 particles, respectively, that are inconsistent with the classic double-belt model. This indicates that the C-terminus of APOA1 has increased conformational freedom and does not assume the double-belt conformation in that region. In contrast, the intramolecular cross-linked peptides detected in that region of the 2 largest sizes of high-density lipoprotein are consistent with the double-belt model. r-HDL indicates reconstituted high-density lipoprotein.
Figure 3.
Figure 3.
Comparison of stepwise conformational changes in APOA1 (apolipoprotein A1) between r-HDL-120, r-HDL-100, r-HDL-90, and r-HDL-80 particles. Animatated representations: blue, N-terminal 43 (residues 1–43); green, pairwise helix 5 (residues 121–143); red, helix 10 (residues 220–243). Red arrowheads show the partially unfolded H7-H8 junctions. Blue arrowheads show the hairpin coil that allows helix 10 (H10A and H10B) to fold onto the 1-palmitoyl-oleoyl-phosphatidylcholine headgroup surface. A, Top view of r-HDL-120. B, Side view of r-HDL-120. C, Top view of r-HDL-100. D, Side view of r-HDL-100. E, Top view of r-HDL-90. F, Side view of r-HDL-90. G, Top view of r-HDL-80. H, Side view of r-HDL-80. Note that APOA1 in the 2 largest HDL particles (A through D; r-HDL-120 and r-HDL-100) has a conformation that is strongly lipid-associated and consistent with the classic double-belt model. In contrast, this structure is absent in both C-termini (H10A and H10B) of APOA1 in the 2 smallest HDL particles (E through H; r-HDL-90 and r-HDL-80). r-HDL indicates reconstituted high-density lipoprotein.
Figure 4.
Figure 4.
Quantification of total HDL and HDL subspecies in LCAT-deficient (-/-), LCAT-heterozygous (+/-), and control (+/+) subjects. A, Representative size and concentration profiles of HDL isolated from LCAT-deficient (-/-), LCAT-heterozygous (+/-), and control (LCAT+/+) subjects. B through F, HDL isolated by ultracentrifugation from plasma (d=1.063–1.21 g/mL) was analyzed by calibrated IMA. The mean HDL subspecies sizes were as follows: extra-small HDL (XS-HDL), 7.8 nm; small HDL (S-HDL), 8.4 nm; medium HDL (M-HDL), 9.2 nm; and large HDL (L-HDL), 10.9 nm. HDL isolated from plasma by ultracentrifugation was subjected to calibrated IMA. The number of subjects was as follows: LCAT+/+, n=14; LCAT+/-, n=6; and LCAT-/-, n=6. P value, 1-way ANOVA with Tukey-Kramer post-tests. ***P<0.001, **P<0.01, and *P<0.05. arb indicates arbitrary units; HDL, high-density lipoprotein; HDL-P, HDL particle concentration determined by calibrated IMA; IMA, ion mobility analysis; and LCAT, lecithin-cholesterol acyltransferase.
Figure 5.
Figure 5.
Calibrated IMA (A) and CEC (B) of HDL isolated from plasma of LCAT-deficient (LCAT-/-) and control (XS-HDL, S-HDL, M-HDL, and L-HDL) subjects. A, Representative IMA size profiles of isolated HDL. To facilitate comparison of size distributions of the particles, the height of each isolated HDL fraction was set to 100%. The diameters of the isolated HDLs of LCAT-/- subjects and control subjects were as follows: LCAT-/-, 7.8±0.1 nm; XS-HDL, 8.1±0.2 nm; S-HDL, 8.8±0.1 nm; M-HDL, 9.8±0.2 nm; and L-HDL, 11.1±0.2 nm. Note that isolated XS-HDL is composed of both XS-HDL and S-HDL particles. B and C, ABCA1-mediated cholesterol efflux capacity (CEC) of HDL isolated from LCAT-/- subjects and control subjects. Macrophage CEC and ABCA1 CEC were quantified with [3H]cholesterol-labeled J774 macrophages and baby hamster kidney cells after a 4-hour incubation. Expression of ABCA1 was induced with cAMP and mifepristone, respectively. Cholesterol efflux was calculated as the percentage of radiolabel in the medium of the cells divided by the total radioactivity of the medium and cells. CEC was quantified as the difference in cholesterol efflux of cells with and without induced expression of ABCA1. Isolated HDLs were included in the media of the cells at equal particle concentrations. CEC of HDLs was normalized to CEC of cells exposed to 10 µg/mL of APOA1 (apolipoprotein A1). P value: 1-way ANOVA with Tukey-Kramer post-tests. ****P<0.0001, ***P<0.001, **P<0.01, and *P<0.05. ABCA1 indicates ATP-binding cassette transporter A1; HDL, high-density lipoprotein; IMA, ion mobility analysis; LCAT, lecithin-cholesterol acyltransferase; L-HDL, large HDL; M-HDL, medium HDL; S-HDL, small HDL; and XS-HDL, extra-small HDL.
Figure 6.
Figure 6.
ABCA1 CEC (A), HDL particle size distribution (B), free cholesterol (C), and total cholesterol (D) content of control and LCAT-deficient plasma incubated with LCAT. Control plasma (n=3) and LCAT-deficient plasma (n=3) were incubated with and without recombinant human LCAT (rLCAT+ and rLCAT-; 50 μg/mL) for 1 h at 37 C. The LCAT reaction was stopped with 2 mM of DTNB and cooling on ice. Control studies demonstrated that DTNB did not alter the CEC of plasma. DTNB was omitted from plasma used to quantify cholesterol levels because it interfered with the enzymatic assay. ABCA1 CEC of plasma was quantified using [3H]cholesterol-labeled baby hamster kidney cells as described in the legend to Figure 5. P values, ratio t test. ABCA1 indicates ATP-binding cassette transporter A1; CEC, cholesterol efflux capacity; HDL, high-density lipoprotein; HDL-P, HDL particle concentration determined by calibrated ion mobility analysis; LCAT, lecithin-cholesterol acyltransferase; S-HDL, small HDL; and XS-HDL, extra-small HDL.
Figure 7.
Figure 7.
The “flipped ends” model for the increased ABCA1 activity of small HDLs. In large HDL particles, the C-termini of the APOA1 dimer are in antiparallel helical bundles that are amphipathic and strongly associated with lipid. In small HDL particles, the reduced surface area and high surface curvature force the C-termini off the particles, increasing their mobility. The termini also are less lipid-associated because APOA1 loses its amphipathic double-belt structure. Decreased lipid association and increased mobility of the C-termini (helices H8–H10) promote the engagement of APOA1 with the clasp domains of ABCA1, stimulating cholesterol export from the cell. An alternative hypothesis is that the C-termini of APOA1 promote microsolubilization of phospholipids and cholesterol from phospholipid-rich domains in the plasma membrane of cells (see Discussion). ABCA1 indicates ATP-binding cassette transporter A1; APOA1, apolipoprotein A1; and HDL, high-density lipoprotein.

Update of

References

    1. Gordon DJ, Rifkind BM. High-density lipoprotein--the clinical implications of recent studies. N Engl J Med. 1989;321:1311–1316. doi: 10.1056/NEJM198911093211907 - PubMed
    1. Rader DJ, Hovingh GK. HDL and cardiovascular disease. Lancet. 2014;384:618–625. doi: 10.1016/S0140-6736(14)61217-4 - PubMed
    1. Rader DJ, Tall AR. The not-so-simple HDL story: is it time to revise the HDL cholesterol hypothesis? Nat Med. 2012;18:1344–1346. doi: 10.1038/nm.2937 - PubMed
    1. Heinecke J. HDL and cardiovascular-disease risk--time for a new approach? N Engl J Med. 2011;364:170–171. doi: 10.1056/NEJMe1012520 - PubMed
    1. Rader DJ, Alexander ET, Weibel GL, Billheimer J, Rothblat GH. The role of reverse cholesterol transport in animals and humans and relationship to atherosclerosis. J Lipid Res. 2009;50(suppl):S189–S194. doi: 10.1194/jlr.R800088-JLR200 - PMC - PubMed

MeSH terms