. 2023 Nov 22;25(1):bbad420.
doi: 10.1093/bib/bbad420.

Assessing protein model quality based on deep graph coupled networks using protein language model

Affiliations

Assessing protein model quality based on deep graph coupled networks using protein language model

Dong Liu et al. Brief Bioinform. .

Abstract

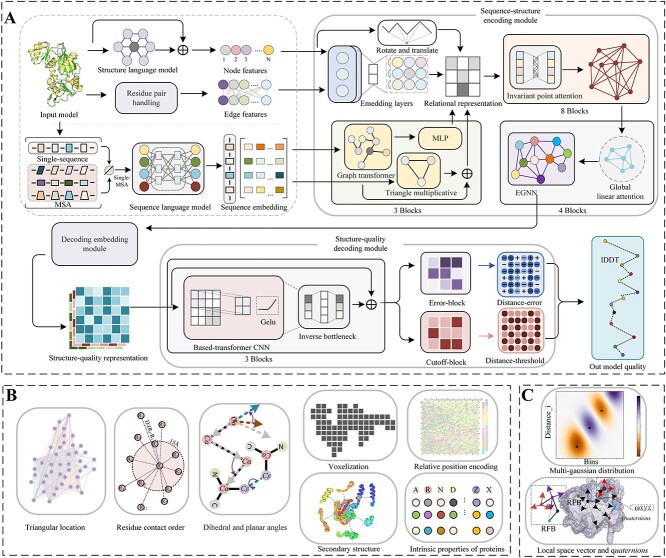
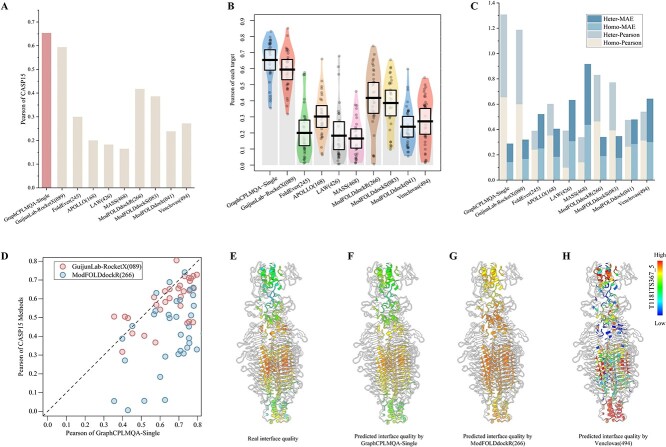
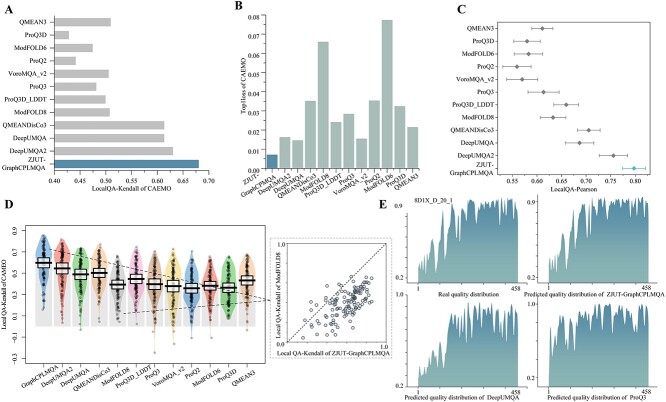
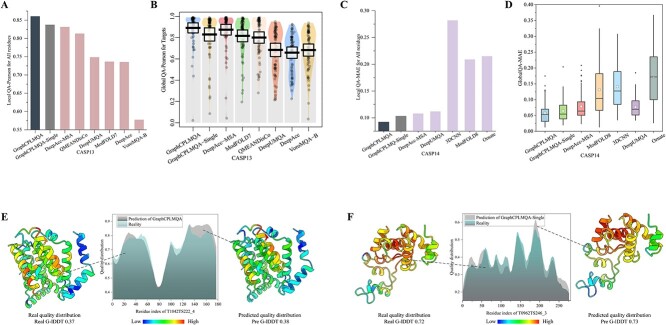
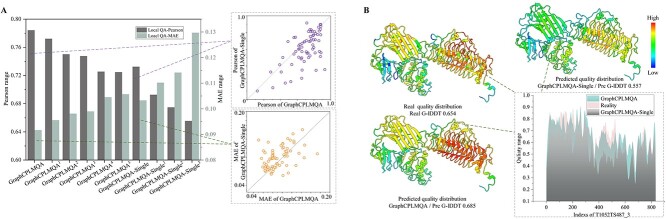
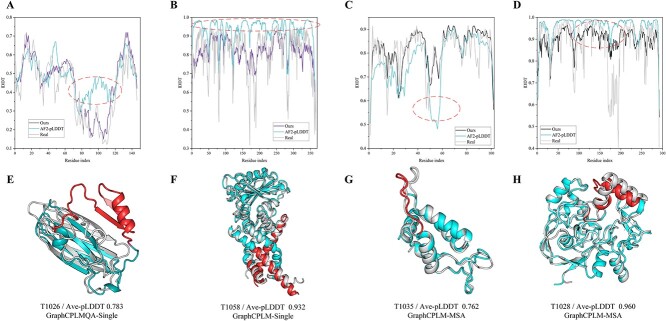
Model quality evaluation is a crucial part of protein structural biology. How to distinguish high-quality models from low-quality models, and to assess which high-quality models have relatively incorrect regions for improvement, are remain a challenge. More importantly, the quality assessment of multimer models is a hot topic for structure prediction. In this study, we propose GraphCPLMQA, a novel approach for evaluating residue-level model quality that combines graph coupled networks and embeddings from protein language models. The GraphCPLMQA consists of a graph encoding module and a transform-based convolutional decoding module. In encoding module, the underlying relational representations of sequence and high-dimensional geometry structure are extracted by protein language models with Evolutionary Scale Modeling. In decoding module, the mapping connection between structure and quality is inferred by the representations and low-dimensional features. Specifically, the triangular location and residue level contact order features are designed to enhance the association between the local structure and the overall topology. Experimental results demonstrate that GraphCPLMQA using single-sequence embedding achieves the best performance compared with the CASP15 residue-level interface evaluation methods among 9108 models in the local residue interface test set of CASP15 multimers. In CAMEO blind test (20 May 2022 to 13 August 2022), GraphCPLMQA ranked first compared with other servers (https://www.cameo3d.org/quality-estimation). GraphCPLMQA also outperforms state-of-the-art methods on 19, 035 models in CASP13 and CASP14 monomer test set.

Keywords: graph neural network; multimer model evaluation; protein language model; protein model evaluation.


Figures

Figure 1
Figure 1
(A) The workflow of GraphCPLMQA. We extract the features in (B) and (C) along with the embedding representation from the protein structure where Single/MSA means that the input is single-sequence or MSA information corresponding to getting a single-sequence embedding or MSA embedding. In the sequence-structure encoding module, we generate the relational representation of sequence and structure, which inputs to the structure-quality decoding module. Finally, the graph coupled network outputs the results of evaluating the model.
Figure 2
Figure 2
Test results for interface residues in the CASP multimer test set (CASP15). (A) The histograms reflect the results of GraphCPLMQA-Single versus other methods of CASP15 on Pearson and MAE. (B) The pirate graph shows the Pearson correlation of different methods in predicting the quality of the multimer interface and the quality of the real multimer interface, where the horizontal line is the mean line. (C) The histogram depicts the performance analysis of different methods on CASP15 homo-oligomers and hetero-oligomers. (D) The scatterplot shows GraphCPLMQA-Single compared with the top method GuijunLab-RocketX and the second method ModFOLDdockR in recent CASP15 interface local quality evaluation. (E)–(H) For model T1181_TS367_5, different methods predict the quality distribution at the multimer interface.
Figure 3
Figure 3
The results of ZJUT-GraphCPLMQA (our server) and other servers on CAMEO blind test (20 May 2022 to 13 August 2022). (A, B) Histograms depict the results of our method versus other methods on the Kendall and Top1loss metrics. (C, D) These plots reflect the distribution of results of our method compared with other servers in terms of local indicators of target proteins. Each point in the graph represents the statistical results of all models for a protein target. (C) The diamond is the mean and the range of confidence interval is 0.9. (D) The black horizontal line is the mean and the range of the standard deviation is 0.3. (E) On protein model 8D1X_D_20_1, real quality distribution versus predicted distribution for other servers.
Figure 4
Figure 4
Performance comparison between GraphCPLMQA and other methods on the CASP monomer test set. (A) For the all residues of CASP13 monomer test set, GraphCPLMQA and GraphCPLMQA-Single were compared with other methods based on the Pearson correlation between the predicted and real quality of residues. (B) The pirate graph reflects the comparison results of the global indicator Pearson on CASP13 where the horizontal bar is the mean line. (C) For the all residues of CASP14 monomer test set, GraphCPLMQA and GraphCPLMQA-Single were compared with other methods based on the MAE between the predicted and real quality of residues. (D) In the boxplot, the horizontal line is the median, and the box is the mean. (E, F) The predictions are compared with the true quality results.
Figure 5
Figure 5
The impact of various components on the performance of GraphCPLMQA in CASP monomer test set. (A) Variation of network architecture and features are on the overall performance of our method. (B) Prediction results of GraphCPLMQA and GraphCPLMQA-Single on T1052 monomer model. The real quality distribution range is as standard.
Figure 6
Figure 6
Results of our evaluation of AlphaFold2 structures compared with the AlphaFold2 pLDDT self-assessment on AlphaFold2 dataset. (AD) Line graphs correspond to different AlphaFold2 models, and the graphs contain the results of our evaluation, the pLDDT of AlphaFold2 and the real lDDT. (EH) Gray represents the native structure, sky blue is the structure of AlphaFold2 and red represents misfolding.

References

    1. Jumper J, Evans R, Pritzel A, et al. Highly accurate protein structure prediction with AlphaFold. Nature 2021;596:583–9. - PMC - PubMed
    1. Baek M, DiMaio F, Anishchenko I, et al. Accurate prediction of protein structures and interactions using a three-track neural network. Science 2021;373:871–6. - PMC - PubMed
    1. Lin Z, Akin H, Rao R, et al. Evolutionary-scale prediction of atomic-level protein structure with a language model. Science 2023;379:1123–1130. - PubMed
    1. Chowdhury R, Bouatta N, Biswas S, et al. Single-sequence protein structure prediction using a language model and deep learning. Nat Biotechnol 2022;40:1617–23. - PMC - PubMed
    1. Zhao K, Xia Y, Zhang F, et al. Protein structure and folding pathway prediction based on remote homologs recognition using PAthreader. Commun Biol 2023;6:243. - PMC - PubMed

Publication types