. 2024 Feb 5;223(2):e202306107.
doi: 10.1083/jcb.202306107. Epub 2023 Nov 29.

Coordination of RAB-8 and RAB-11 during unconventional protein secretion

Affiliations

Coordination of RAB-8 and RAB-11 during unconventional protein secretion

Xinxin Li et al. J Cell Biol. .

Abstract

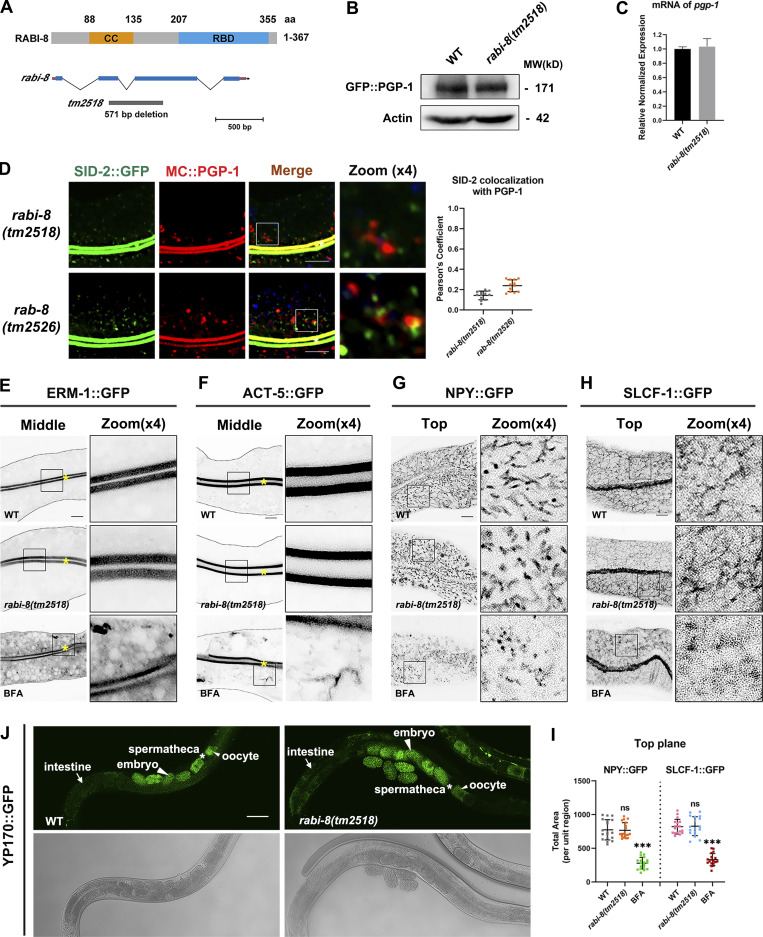
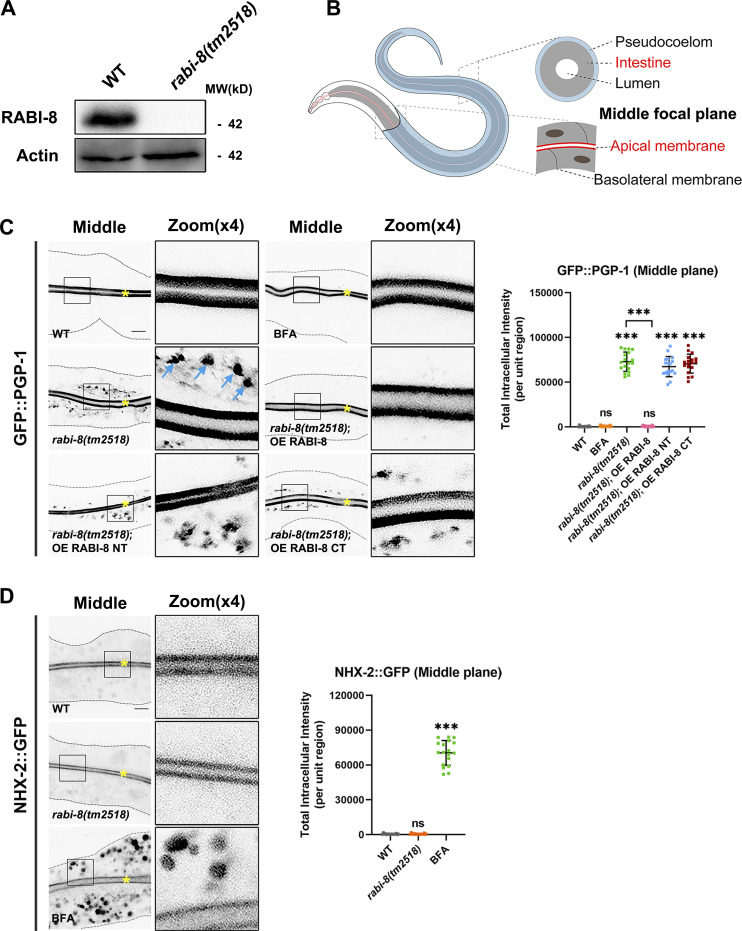
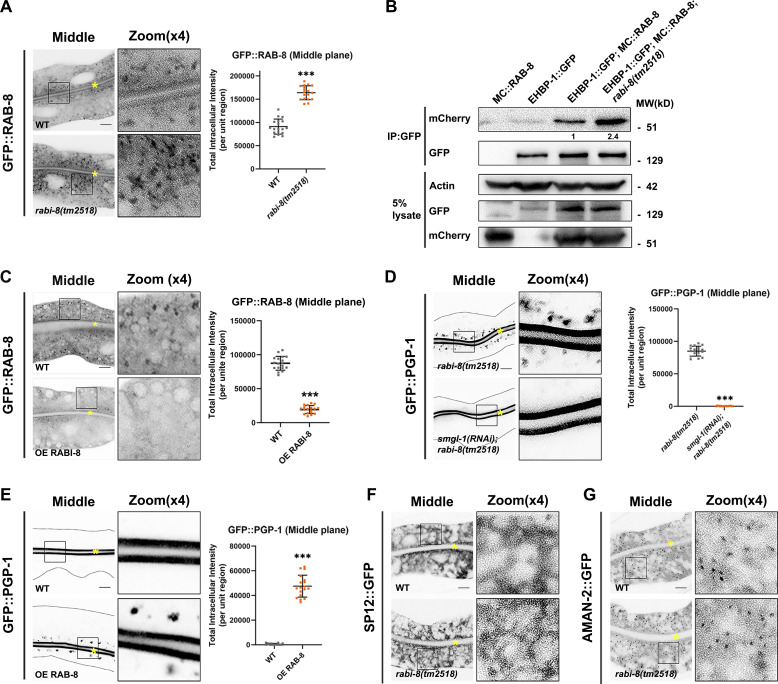
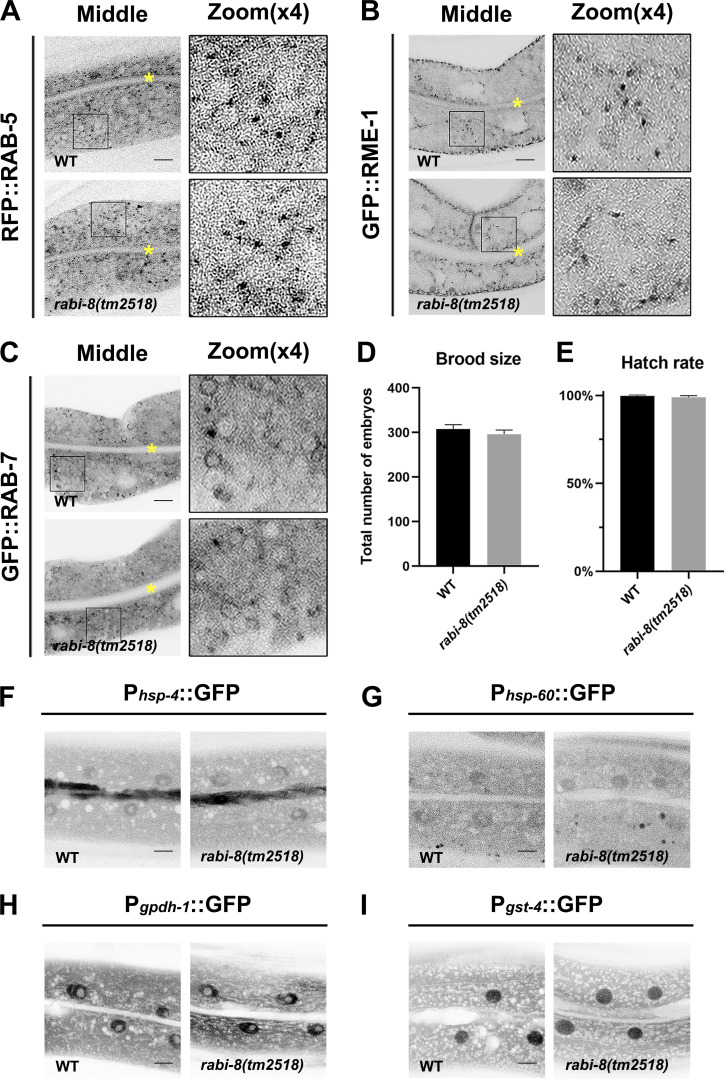
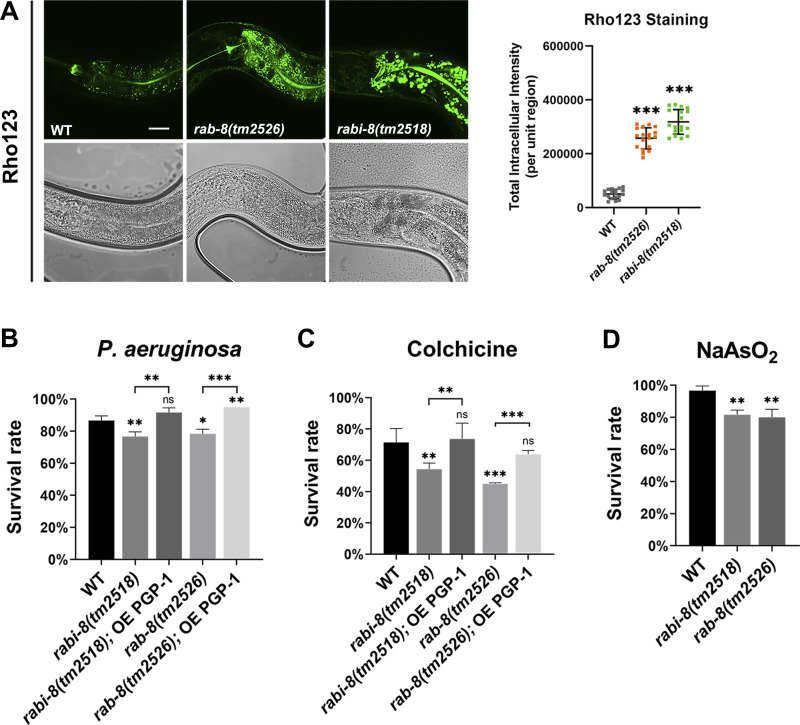
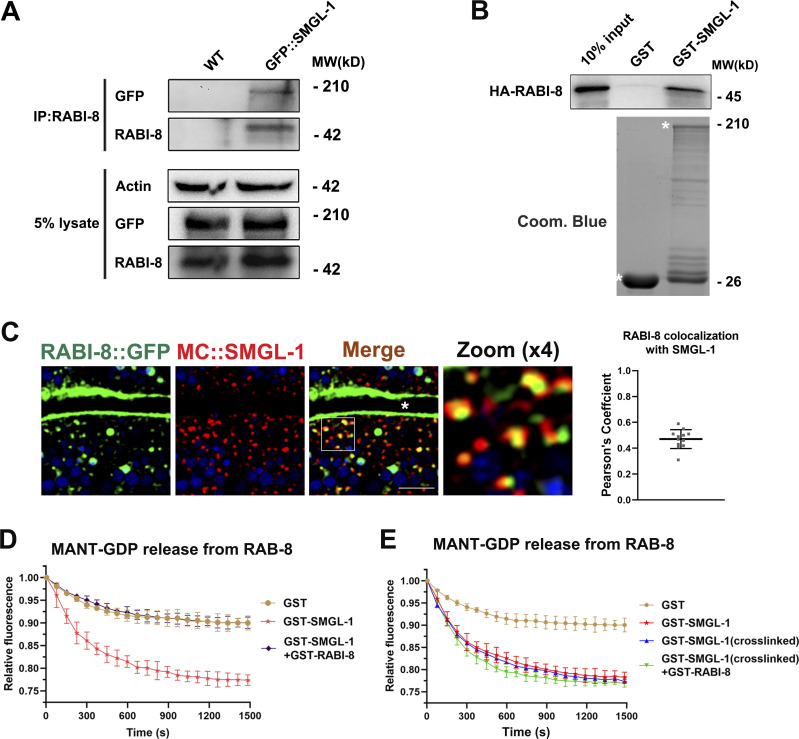
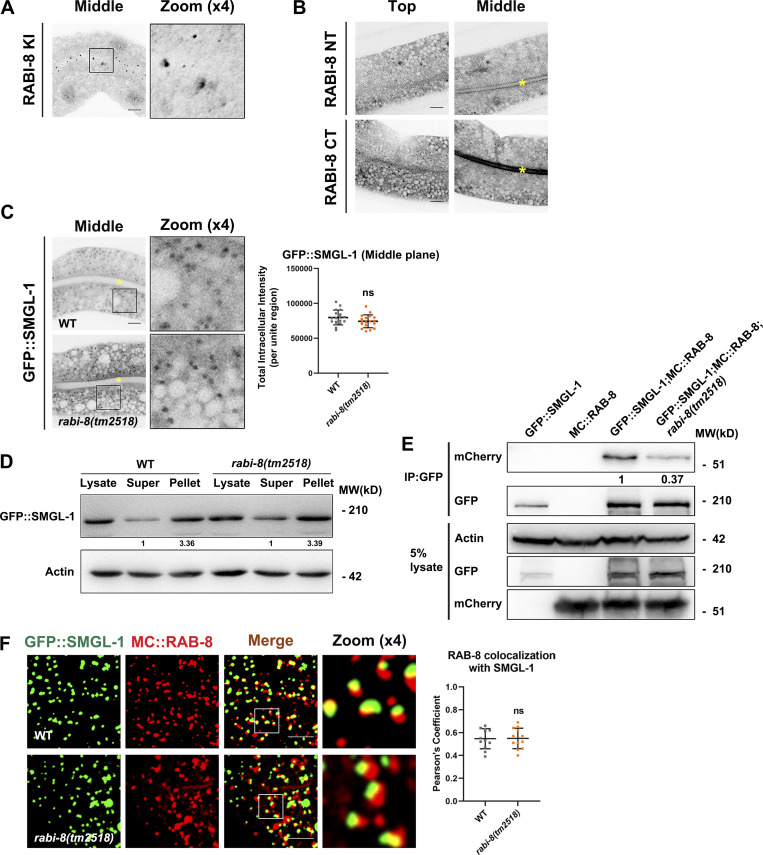
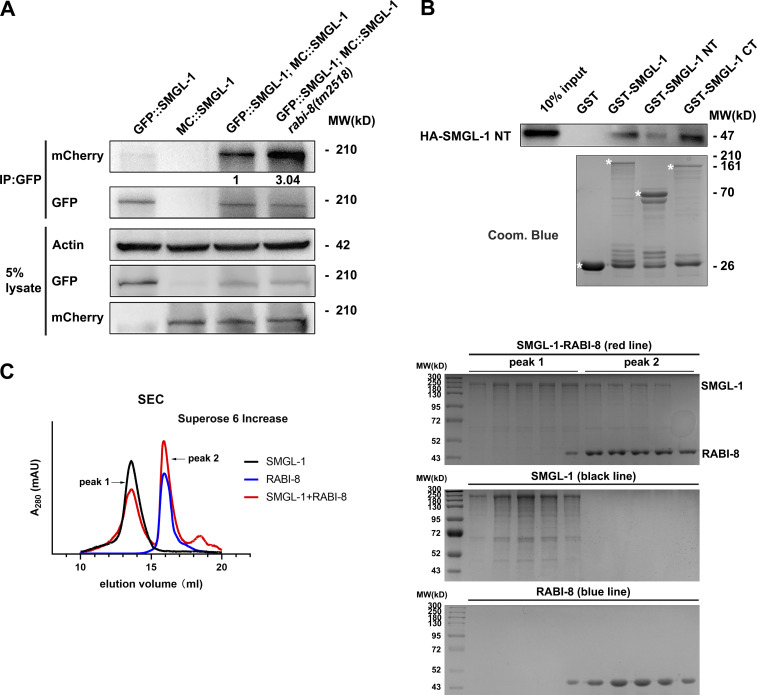
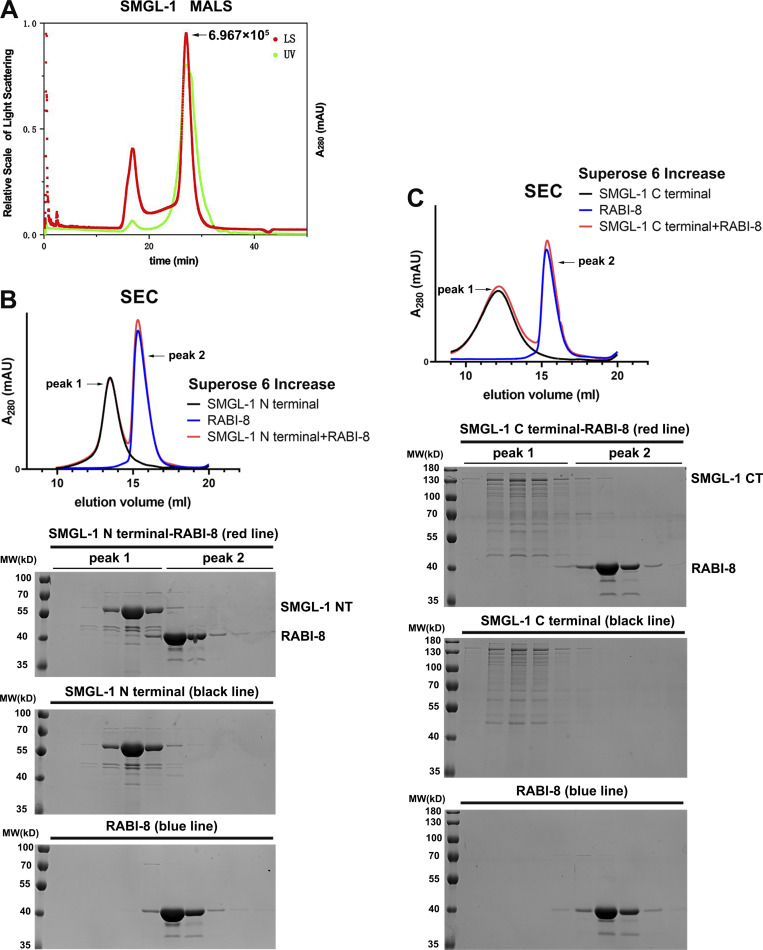
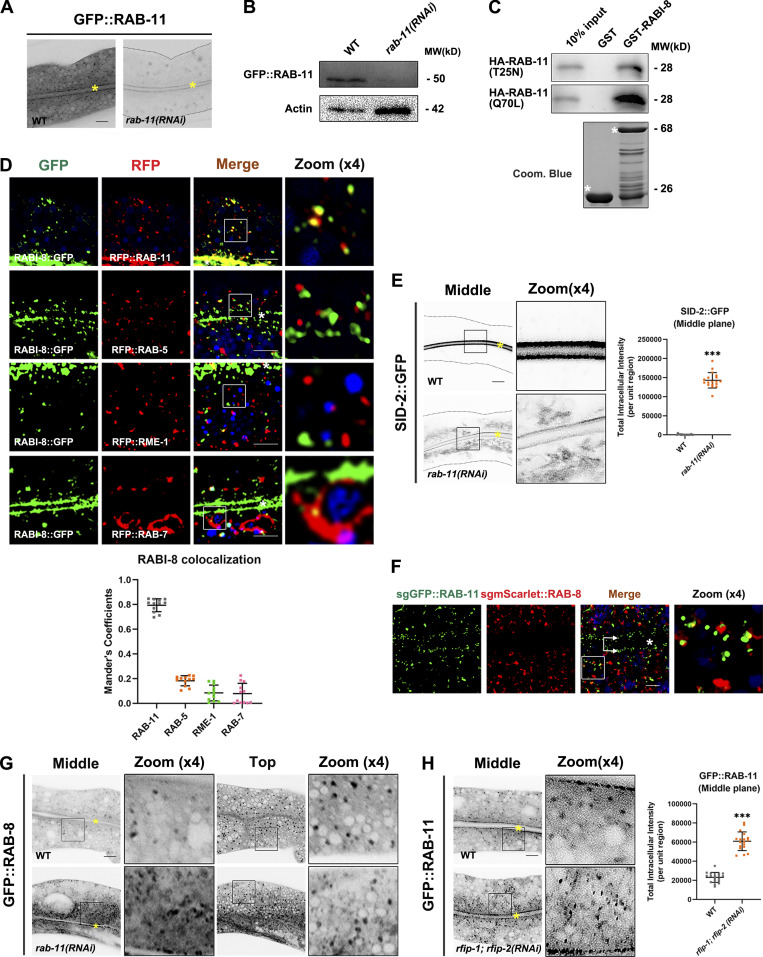
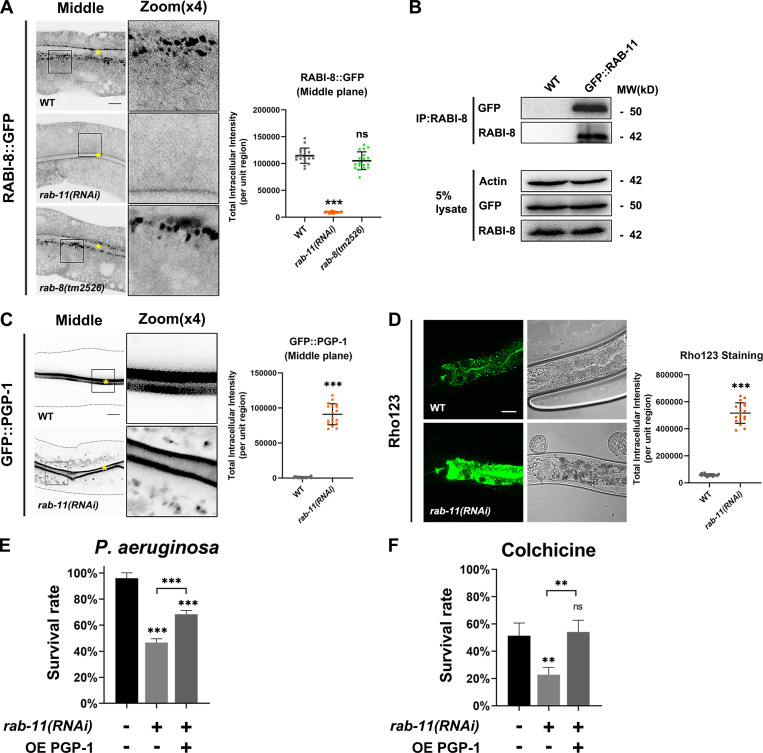
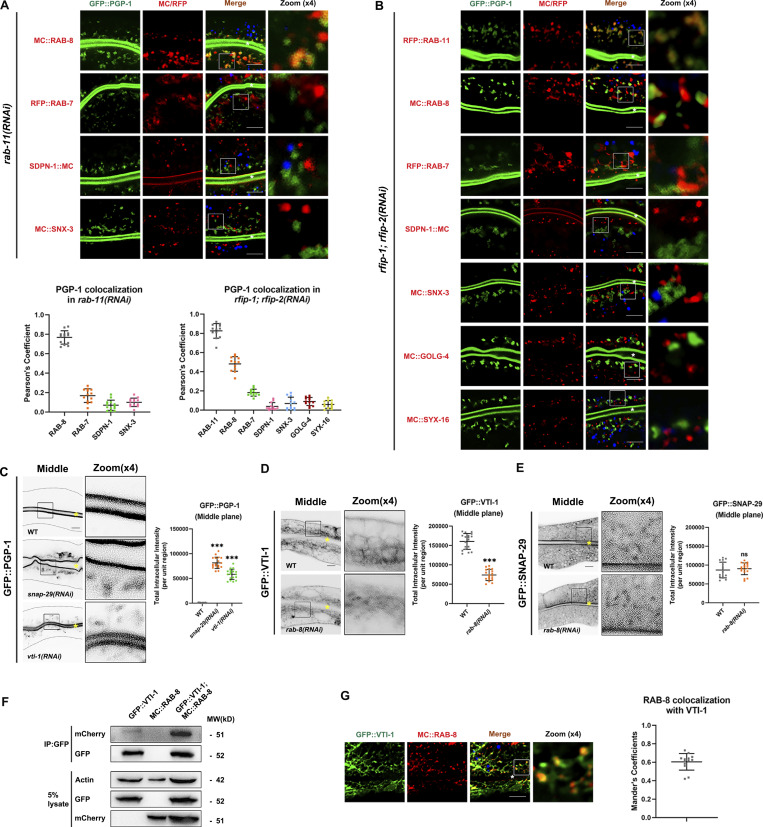
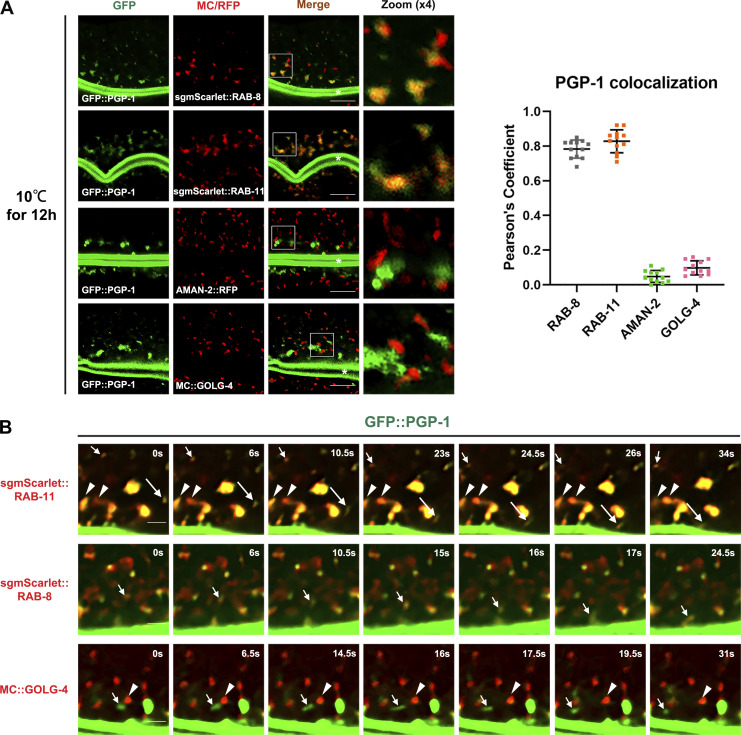
Multiple physiology-pertinent transmembrane proteins reach the cell surface via the Golgi-bypassing unconventional protein secretion (UcPS) pathway. By employing C. elegans-polarized intestine epithelia, we recently have revealed that the small GTPase RAB-8/Rab8 serves as an important player in the process. Nonetheless, its function and the relevant UcPS itinerary remain poorly understood. Here, we show that deregulated RAB-8 activity resulted in impaired apical UcPS, which increased sensitivity to infection and environmental stress. We also identified the SNARE VTI-1/Vti1a/b as a new RAB-8-interacting factor involved in the apical UcPS. Besides, RAB-11/Rab11 was capable of recruiting RABI-8/Rabin8 to reduce the guanine nucleotide exchange activity of SMGL-1/GEF toward RAB-8, indicating the necessity of a finely tuned RAB-8/RAB-11 network. Populations of RAB-8- and RAB-11-positive endosomal structures containing the apical UcPS cargo moved toward the apical side. In the absence of RAB-11 or its effectors, the cargo was retained in RAB-8- and RAB-11-positive endosomes, respectively, suggesting that these endosomes are utilized as intermediate carriers for the UcPS.


Conflict of interest statement

Disclosures: The authors declare no competing interests exist.

Figures

Figure S1.
Figure S1.
Loss of RABI-8 does not affect the exocytosis of other membrane and soluble cargoes. (A) The schematic domain structure of RABI-8 and rabi-8 locus. The coiled-coil (CC) domain is depicted in orange. The RBD is depicted in blue. The rabi-8 gene structure is shown with filled boxes representing exons and thin lines indicating introns. The arrow delineates the direction of transcription. The gray bars below the transcript show the size and position of the deleted regions in tm2518. (B) A presentative western blot showing expressional levels of GFP::PGP-1 in wild-type and rabi-8(tm2518) mutant animals. (C) RT-PCR showing mRNA expressional levels of PGP-1 in wild-type animals and rabi-8(tm2518) mutants. Each is the average of three replicates. (D) Confocal images and quantification showing the localization pattern of MC::PGP-1 and SID-2::GFP in rabi-8(tm2518) and rab-8(tm2526) mutants. Pearson’s correlation coefficients for GFP and MC signals were calculated (n = 12 animals). The signals from the apical membrane were avoided by manual ROI selection. White asterisks indicate intestinal lumen. Scale bars: 10 μm. (E and F) Compared to wild-type animals, the localization of ERM-1::GFP (E), and ACT-5::GFP (F) remained unchanged in rabi-8(tm2518). ERM-1::GFP (E) and ACT-5::GFP (F) both aberrantly accumulated in the cytoplasm of wild-type animals upon BFA treatment. Scale bars: 10 μm. Yellow asterisks indicate intestinal lumen. Dashed lines indicate the outline of the intestine. (G–I) The basolateral membrane protein NPY::GFP (G) and SLCF-1::GFP (H) exhibited similar tubular localization in wild-type and rabi-8(tm2518) animals. BFA treatment disrupted the normal localization. (I) Quantification of the total area of NPY::GFP in G and SLCF-1::GFP in H. Data are shown as mean ± SD (n = 18 each, six animals of each genotype sampled in three different unit regions of each intestine defined by a 100 × 100 [pixel2] box positioned at random). Statistical significance was determined using a one-way ANOVA followed by a post-hoc test (Dunn’s Multiple Comparison Test) for multiple comparisons. ***P < 0.001; ns, no significance. Data distribution was assumed to be normal but this was not formally tested. About one cell length of the intestine is shown in each panel. Scale bars: 10 μm. (J) Compared to wild-type animals, the distribution pattern of YP170::GFP remained unchanged in rabi-8(tm2518). Spermathecas are indicated by stars. Embryos and oocytes are indicated by big and small arrowheads, respectively. Intestines are indicated by arrows. Scale bars: 100 μm. Source data are available for this figure: SourceData FS1.
Figure 1.
Figure 1.
Loss of RABI-8 impairs the delivery of apical Golgi-bypassing membrane cargoes. (A) A representative immunoblot of RABI-8 in lysates from wild-type and rabi-8(tm2518) mutant animals. Compared with wild-type, levels of RABI-8 are dramatically decreased in rabi-8(tm2518) mutants. (B) A schematic diagram of C. elegans intestine, showing the apical and basolateral membranes. The imaging plane where the apical membrane and intestinal lumen can be observed is defined as the middle focal plane of the confocal microscopy. (C) Confocal images of intestinal cells expressing GFP-tagged PGP-1. GFP::PGP-1 is predominantly localized at the apical membrane of intestinal epithelia in L4 larvae and young adults of wild-type animals. BFA treatment did not alter the localization. In contrast, GFP::PGP-1 displayed intracellular accumulation indicated by blue arrows in rabi-8(tm2518) mutants. Overexpression of full-length RABI-8 but not the NT or CT rescued the localization defects of PGP-1 in rabi-8(tm2518) mutants. (D) Confocal images of intestinal cells expressing GFP-tagged NHX-2. In contrast to the predominantly apical-localized NHX-2::GFP in L4 larvae or young adults of wild-type animals, NHX-2::GFP aberrantly accumulated in the cytoplasm of wild-type animals upon BFA treatment. NHX-2::GFP remained unchanged in rabi-8(tm2518) mutants. For quantification, the signals from the apical membrane were avoided by manual ROI selection. Data are shown as mean ± SD (n = 18 each, six animals of each genotype sampled in three different unit regions of each intestine defined by a 100 × 100 [pixel2] box positioned at random). Statistical significance was determined using a one-way ANOVA followed by a post-hoc test (Dunn’s Multiple Comparison Test) for multiple comparisons. ***P < 0.001; ns, no significance. Data distribution was assumed to be normal but this was not formally tested. About one cell length of the intestine is shown in each panel. Scale bars: 10 μm. Yellow asterisks indicate intestinal lumen. Dashed lines indicate the outline of the intestine. Source data are available for this figure: SourceData F1.
Figure 2.
Figure 2.
Animals lacking RABI-8 exhibit increased RAB-8 activity. (A) Confocal images of intestinal cells expressing GFP-tagged RAB-8. Compared with wild-type animals, the intensity of GFP::RAB-8–labeled puncta was increased in rabi-8(tm2518) mutants. (B) mCherry (MC)::RAB-8 coimmunoprecipitated by EHBP-1::GFP were increased in rabi-8 mutant animals. Levels of MC::RAB-8 are normalized to the corresponding GFP (set to 1 in wild-type animals). (C) The fluorescence intensity and the number of GFP::RAB-8 puncta were diminished in RABI-8–overexpressing animals. (D) Confocal images of intestinal cells expressing GFP-tagged PGP-1. Knockdown of SMGL-1 significantly reduced the cytosol accumulation of GFP::PGP-1 in rabi-8(tm2518) mutants. (E) Compared with wild-type animals, GFP::PGP-1 aberrantly accumulated in the cytoplasm of animals overexpressing RAB-8. For quantification, the signals from the apical membrane were avoided by manual ROI selection. Data are shown as mean ± SD (n = 18 each, six animals of each genotype sampled in three different unit regions of each intestine defined by a 100 × 100 [pixel2] box positioned at random). Statistical significance was determined using a two-tailed, unpaired Student’s t test. ***P < 0.001. Data distribution was assumed to be normal but this was not formally tested. (F and G) The localization of fluorescence-tagged ER maker SP12 (F) and Golgi marker AMAN-2 (G) was unaltered in rabi-8(tm2518) mutants. About one cell length of the intestine is shown in each panel. Scale bars: 10 μm. Yellow asterisks indicate intestinal lumen. Dashed lines indicate the outline of the intestine. Source data are available for this figure: SourceData F2.
Figure S2.
Figure S2.
Some endolysosomal markers, the brood size, hatch rate, and several stress reporters are not affected in rabi-8 mutant animals. (A–C) The localization of fluorescence-tagged early endosome marker RAB-5 (A), basolateral recycling endosome marker RME-1 (B), and late endosome marker RAB-7 (C) were unaltered in rabi-8(tm2518) mutants. About one cell length of the intestine is shown in each panel. Scale bars: 10 μm. Yellow asterisks indicate intestinal lumen. (D and E) Mutation in rabi-8 had no effect on the brood size (D) or hatch rate (E), compared with wild-type animals. Three independent experiments were performed and data are shown as mean ± SD. (F–I) Confocal images of animals expressing Phsp-4::GFP (ER stress reporter) (F), Phsp-60::GFP (mitochondrial stress reporter) (G), Pgpdh-1::GFP (osmolyte accumulation) (H), and Pgst-4::GFP (detoxification) (I) in wild-type and rabi-8(tm2518) mutant animals. All the reporters displayed the similar expression and distribution upon rabi-8 depletion. Scale bars: 10 μm.
Figure 3.
Figure 3.
Dysregulation of RAB-8 leads to reduced resistance to multiple environmental stressors. (A) Confocal images of wild-type, rab-8(tm2526), and rabi-8(tm2518) animals after a 48-h incubation with fluorescent dye rho123. Compared with wild-type animals, the fluorescence intensity of rho123 increased sixfold in rabi-8(tm2518) and fivefold in rab-8(tm2526), respectively. Data are shown as mean ± SD (n = 18 each, six animals of each genotype sampled in three different unit regions of each intestine defined by a 100 × 100 [pixel2] box positioned at random). Statistical significance was determined using a one-way ANOVA followed by a post-hoc test (Dunn’s Multiple Comparison Test) for multiple comparisons. ***P < 0.001. Data distribution was assumed to be normal but this was not formally tested. Scale bars: 20 μm. (B) Compared with wild-type animals, the survival rate of rab-8(tm2526) and rabi-8(tm2518) mutants was reduced after 24 h of P. aeruginosa exposure. PGP-1 overexpression (OE) improved the survival rate of both mutants. (C) Compared with wild-type animals, the survival rate of rab-8(tm2526) and rabi-8(tm2518) mutants was reduced upon colchicine (2 mM) treatment. PGP-1 overexpression improved the survival rate of both mutants. (D) Mutations in rab-8 and rabi-8 reduced the resistance to arsenite (2 mM). Data are shown as mean ± SD. Statistical significance was determined using a one-way ANOVA followed by a post-hoc test (Dunn’s Multiple Comparison Test) for multiple comparisons. *P < 0.05; **P < 0.01; ***P < 0.001; ns, no significance. Data distribution was assumed to be normal but this was not formally tested.
Figure 4.
Figure 4.
RABI-8 interacts with SMGL-1 and reduces its GEF activity toward RAB-8. (A) RABI-8 precipitated GFP::SMGL-1 in a representative Co-IP assay. (B) A representative immunoblot showing the GST-tagged SMGL-1 was pulled down by in vitro translated HA-RABI-8. (C) Confocal images and quantification showing colocalization between RABI-8::GFP and MC::SMGL-1 in the intestinal cells. Broad-spectrum intestinal autofluorescent lysosome-like organelles can be seen in blue. Pearson’s correlation coefficients for GFP and mCherry signals were calculated (n = 12 animals). The signals from the apical membrane were avoided by manual ROI selection. Scale bars: 10 μm. White asterisk indicates the intestinal lumen. (D) In vitro GEF assay. MANT-GDP release from RAB-8 was measured by adding GST only, GST-SMGL-1, and GST-SMGL-1 and GST-RABI-8. GST-SMGL-1 promoted the release of MANT-GDP from RAB-8, while the presence of RABI-8 inhibited the promotion. Data are shown as mean ± SD from three independent replicates. (E) In vitro GEF assay. MANT-GDP release from RAB-8 was facilitated by adding GST only, GST-SMGL-1, GST-SMGL-1 (crosslinked) and GST-SMGL-1 (crosslinked), and GST-RABI-8. Crosslinking assay was performed using DSG. Data are shown as mean ± SD from three independent replicates. Source data are available for this figure: SourceData F4.
Figure S3.
Figure S3.
RABI-8 does not affect the normal localization of SMGL-1 or the association of SMGL-1 with RAB-8. (A) Knock-in (KI) FLAG-RABI-8 via the CRISPR/Cas9 system to add an epitope tag (2xFLAG) to the CT of endogenous RABI-8. (B) Confocal images of intestinal cells expressing GFP-tagged NT and CT of RABI-8. (C) Confocal images of intestinal cells expressing GFP-tagged SMGL-1. Mutation in rabi-8 did not change the localization of GFP::SMGL-1. Data are shown as mean ± SD (n = 18 each, six animals of each genotype sampled in three different unit regions of each intestine defined by a 100 × 100 [pixel2] box positioned at random). Statistical significance was determined using a two-tailed, unpaired Student’s t test. ns, no significance. Data distribution was assumed to be normal but this was not formally tested. Yellow asterisks indicate intestinal lumen. (D) The membrane-to-cytosol ratio of GFP::SMGL-1 did not change notably in rabi-8(tm2518) mutants. Actin served as the loading control. Levels of SMGL-1 were normalized to the corresponding controls and set to one in the supernatant fraction. (E) GFP::SMGL-1 precipitated less MC::RAB-8 in rabi-8(tm2518) mutants in a representative Co-IP assay. (F) Confocal images and quantification showing partial colocalization between GFP::SMGL-1 and MC::RAB-8 in wild-type and rabi-8(tm2518) mutant animals. Pearson’s correlation coefficients for GFP and mCherry signals were calculated (n = 12 animals). Data are shown as mean ± SD (n = 12, 12 animals of each genotype of each intestine defined by a 100 × 100 [pixel2] box positioned at random). Statistical significance was determined using a two-tailed, unpaired Student’s t test. ns, no significance. Scale bars: 10 μm. Source data are available for this figure: SourceData FS3.
Figure 5.
Figure 5.
RABI-8 affects the oligomerization state of SMGL-1. (A) GFP::SMGL-1 precipitated MC::SMGL-1 in a representative Co-IP assay. Loss of RABI-8 increased the amount of precipitated MC::SMGL-1. Levels of MC::SMGL-1 are normalized to the corresponding GFP (set to 1 in wild-type animals). (B) The NT of SMGL-1 was pulled down by the full-length, NT, and CT of SMGL-1 in a representative protein pull-down assay. (C) Superose 6 increase SEC elution profile of SMGL-1 (black), RABI-8 (blue), and a mixture of SMGL-1 and RABI-8 (red). Right, from top to bottom: SDS-PAGE of the peak fractions from the SMGL-1–RABI-8, SMGL-1, and RABI-8 elution. Source data are available for this figure: SourceData F5.
Figure S4.
Figure S4.
RABI-8 does not alter the oligomerization state of SMGL-1 NT or CT. (A) A static light scattering assay indicated that SMGL-1 forms oligomers. The x-axis represents the elution time. The parameters monitored by LS (laser-light scattering) and UV (ultraviolet light) detectors were plotted as curves. The molecular weight was calculated according to LS measurements. Peak: 6.967 × 10⁵. MALS, multiangle light scattering. (B) Superose 6 increase SEC elution profile of SMGL-1 NT (black), RABI-8 (blue), and a mixture of SMGL-1 NT and RABI-8 (red). Below, from top to bottom: SDS-PAGE of the peak fractions from the SMGL-1 NT-RABI-8, SMGL-1 NT, and RABI-8 elution. (C) Superose 6 increase SEC elution profile of SMGL-1 CT (black), RABI-8 (blue), and a mixture of SMGL-1 CT and RABI-8 (red). Below, from top to bottom: SDS-PAGE of the peak fractions from the SMGL-1 CT-RABI-8, SMGL-1 CT, and RABI-8 elution.
Figure S5.
Figure S5.
The subcellular localization of RABI-8, RAB-8, and RAB-11. (A) Confocal images of intestinal cells expressing GFP-tagged RAB-11. RNAi-mediated knockdown of RAB-11 dramatically reduced the fluorescence intensity of GFP::RAB-11. Image brightness and contrast were adjusted identically for both images to reveal the contour of the intestinal cells in rab-11(RNAi) animals. Yellow asterisks indicate intestinal lumen. (B) A representative western blot showing expressional levels of GFP::RAB-11 in wild-type and rab-11(RNAi) animals. (C) GST-RABI-8 pulled down more HA-RAB-11(Q70L) than HA-RAB-11(T25N) in a representative pull-down assay. (D) Confocal images and quantification showing colocalization between RABI-8::GFP and organelle markers in the intestinal cells. RABI-8::GFP puncta overlapped with the subpopulation of RFP:RAB-11. RABI-8::GFP puncta were separated from RAB-5–labeled early endosomes, RME-1–labeled basolateral recycling endosomes and RAB-7–labeled late endosomes. In each set of images, broad-spectrum intestinal autofluorescent lysosome-like organelles can be seen in blue. Manders’ correlation coefficients for GFP and RFP signals were calculated (n = 12 animals). The signals from the apical membrane were avoided by manual ROI selection. Scale bars: 10 μm. White asterisks indicate intestinal lumen. (E) Confocal images of intestinal cells expressing GFP-tagged SID-2. Compared with wild-type animals, SID-2::GFP accumulated in intracellular structures in rab-11(RNAi) knockdown animals. For quantification, the signals from the apical membrane were avoided by manual ROI selection. Data are shown as mean ± SD (n = 18 each, six animals of each genotype sampled in three different unit regions of each intestine defined by a 100 × 100 [pixel2] box positioned at random). Statistical significance was determined using a two-tailed, unpaired Student’s t test. ***P < 0.001. Data distribution was assumed to be normal but this was not formally tested. Scale bars: 10 μm. Yellow asterisks indicate intestinal lumen. Dashed lines indicate the outline of the intestine. (F) Single-copy GFP::RAB-11; mScarlet::RAB-8 animals were imaged by structured illumination microscopy. Double arrows indicate the apical enriched RAB-11 sub-population. Scale bars: 5 μm. White asterisk indicates intestinal lumen. (G) Confocal images of intestinal cells expressing GFP-tagged RAB-8 in wild-type and rab-11(RNAi) animals. (H) Compared with wild-type animals, the GFP::RAB-11 was diffusive and formed smaller puncta in rfip-1; rfip-2 (RNAi) knockdown animals. Data are shown as mean ± SD (n = 18 each, six animals of each genotype sampled in three different unit regions of each intestine defined by a 100 × 100 [pixel2] box positioned at random). Statistical significance was determined using a two-tailed, unpaired Student’s t test. ***P < 0.001. Data distribution was assumed to be normal but this was not formally tested. Scale bars: 10 μm. Yellow asterisks indicate intestinal lumen. Source data are available for this figure: SourceData FS5.
Figure 6.
Figure 6.
RAB-11 recruits RABI-8 to vesicular endosomal compartments and regulates unconventional apical protein transport. (A) Confocal images of intestinal cells expressing GFP-tagged RABI-8. Compared with wild-type animals, rab-11 knockdown significantly reduced the number and intensity of RABI-8::GFP puncta, while mutation in rab-8 had no obvious effect. Data are shown as mean ± SD (n = 18 each, six animals of each genotype sampled in three different unit regions of each intestine defined by a 100 × 100 [pixel2] box positioned at random). Statistical significance was determined using a one-way ANOVA followed by a post-hoc test (Dunn’s Multiple Comparison Test) for multiple comparisons. ***P < 0.001; ns, no significance. Data distribution was assumed to be normal but this was not formally tested. Scale bars: 10 μm. (B) RABI-8 precipitated GFP::RAB-11 in a representative Co-IP assay. (C) Confocal images of intestinal cells expressing GFP-tagged PGP-1. Compared with wild-type animals, GFP::PGP-1 accumulated in intracellular structures in rab-11(RNAi) knockdown animals. For quantification, the signals from the apical membrane were avoided by manual ROI selection. Data are shown as mean ± SD (n = 18 each, six animals of each genotype sampled in three different unit regions of each intestine defined by a 100 × 100 [pixel2] box positioned at random). Statistical significance was determined using a two-tailed, unpaired Student’s t test. ***P < 0.001. Data distribution was assumed to be normal but this was not formally tested. About one cell length of the intestine is shown in each panel. Scale bars: 10 μm. Yellow asterisks indicate intestinal lumen. Dashed lines indicate the outline of the intestine. (D) Confocal images of wild-type and rab-11(RNAi) knockdown animals after a 48-h incubation with fluorescent dye rho123. Accumulation of rho123 was about 10-fold higher in rab-11(RNAi) than in wild-type animals. Data are shown as mean ± SD (n = 18 each, six animals of each genotype sampled in three different unit regions of each intestine defined by a 100 × 100 [pixel2] box positioned at random). Statistical significance was determined using a two-tailed, unpaired Student’s t test. ***P < 0.001. Data distribution was assumed to be normal but this was not formally tested. Scale bars: 20 μm. (E) Compared with wild-type animals, rab-11 knockdown reduced the survival rate after 24 h of P. aeruginosa exposure. PGP-1 overexpression (OE) improved the survival rate of rab-11(RNAi) animals. (F) Compared with wild-type animals, rab-11 knockdown reduced the survival rate upon colchicine (2 mM) treatment. PGP-1 overexpression improved the survival rate of rab-11(RNAi) animals. Statistical significance was determined using a one-way ANOVA followed by a post-hoc test (Dunn’s Multiple Comparison Test) for multiple comparisons. **P < 0.01; ***P < 0.001; ns, no significance. Data distribution was assumed to be normal but this was not formally tested. Source data are available for this figure: SourceData F6.
Figure 7.
Figure 7.
VTI-1 interacts with RAB-8 and is involved in unconventional apical protein transport. (A) Confocal images and quantification showing colocalization pattern between intracellular GFP::PGP-1 and several endosomal markers in rab-11(RNAi) knockdown animals. Intracellular GFP::PGP-1 puncta overlapped with subsets of MC::RAB-8. Intracellular GFP::PGP-1 puncta were separated from RAB-7–labeled late endosomes, and SDPN-1– and SNX-3–labeled early/sorting endosomes. (B) Confocal images and quantification showing colocalization pattern between intracellular GFP::PGP-1 and several endosomal markers in rfip-1; rfip-2 (RNAi) knockdown animals. Intracellular GFP::PGP-1 puncta overlapped with subsets of RFP::RAB-11 and MC::RAB-8. Intracellular GFP::PGP-1 puncta were separated from RAB-7–labeled late endosomes, SNX-3– and SDPN-1–labeled early/sorting endosomes, GOLG-4 and SYX-16–labeled trans-Golgi. In each set of images, broad-spectrum intestinal autofluorescent lysosome-like organelles can be seen in blue. Pearson’s correlation coefficients for GFP and MC/RFP signals were calculated (n = 12 animals). The signals from the apical membrane were avoided by manual ROI selection. (C) Confocal images and quantification showing the abnormal intracellular GFP::PGP-1 in vti-1(RNAi) and snap-29(RNAi) knockdown animals, in comparison with wild-type animals. For quantification, the signals from the apical membrane were avoided by manual ROI selection. Data are shown as mean ± SD (n = 18 each, six animals of each genotype sampled in three different unit regions of each intestine defined by a 100 × 100 [pixel2] box positioned at random). Statistical significance was determined using a one-way ANOVA followed by a post-hoc test (Dunn’s Multiple Comparison Test) for multiple comparisons. ***P < 0.001. Data distribution was assumed to be normal but this was not formally tested. (D) Confocal images and quantification showing the abnormal localization and decreased fluorescent intensity of GFP::VTI-1 in rab-8(RNAi) knockdown animals, in comparison with wild-type animals. Statistical significance was determined using a two-tailed, unpaired Student’s t test. ***P < 0.001. Data distribution was assumed to be normal but this was not formally tested. (E) Confocal images and quantification showing the intact localization of GFP::SNAP-29 in rab-8(RNAi) knockdown animals, in comparison with wild-type animals. Statistical significance was determined using a two-tailed, unpaired Student’s t test. ns, no significance. Data distribution was assumed to be normal but this was not formally tested. (F) GFP::VTI-1 precipitated MC::RAB-8 in a representative Co-IP assay. (G) Confocal images and quantification showing noticeable colocalization between GFP::VTI-1 and MC::RAB-8. Manders’ correlation coefficients for GFP and MC signals were calculated (n = 12 animals). Scale bars: 10 μm. White and yellow asterisks indicate intestinal lumen. Dashed lines indicate the outline of the intestine. Source data are available for this figure: SourceData F7.
Figure 8.
Figure 8.
RAB-8– and RAB-11–positive endosomes serve as intermediate carries in the unconventional apical protein transport. (A) Confocal images and quantification showing colocalization pattern between intracellular GFP::PGP-1 with MC::RAB-8, RFP::RAB-11, Golgi marker AMAN-2::RFP, and MC::GOLG-4 in wild-type animals kept at 10°C for 12 h. Intracellular GFP::PGP-1 puncta overlapped with subsets of RAB-8 and RAB-11 and were separated from AMAN-2–labeled cis- and medial-Golgi and GOLG-4–labeled trans-Golgi. In each set of images, broad-spectrum intestinal autofluorescent lysosome-like organelles can be seen in blue. Pearson’s correlation coefficients for GFP and MC/RFP signals were calculated (n = 12 animals). The signals from the apical membrane were avoided by manual ROI selection. White asterisks indicate intestinal lumen. Scale bars: 10 μm. (B) Transgenic animals of GFP::PGP-1 and single-copy mScarlet::RAB-11 or mScarlet::RAB-8 or MC::GOLG-4 were imaged live by spinning disk confocal microscope at 20°C after a 12 h incubation at 10°C. Images were captured every 0.5 s for 2 min. Series of images that depict mScarlet::RAB-11– and mScarlet::RAB-8–labeled vesicles transporting GFP-labeled PGP-1 towards the apical surface are shown (see Videos 1 and 2). RAB-11 puncta can be observed to either interact with the RAB-11–positive endosomal subpopulation located along the apical surface (indicated by arrowheads) or disappear below the PGP-1–labeled apical membrane (indicated by long arrows). Image series show the movement of GFP::PGP-1 vesicles (indicated by arrows), with a neighboring MC::GOLG-4–labeled Golgi (indicated by arrowheads) remaining stationary at the time interval (see Video 3). Scale bars: 4 μm.

Comment in

Similar articles

Cited by

References

    1. Ang, A.L., Taguchi T., Francis S., Fölsch H., Murrells L.J., Pypaert M., Warren G., and Mellman I.. 2004. Recycling endosomes can serve as intermediates during transport from the Golgi to the plasma membrane of MDCK cells. J. Cell Biol. 167:531–543. 10.1083/jcb.200408165 - DOI - PMC - PubMed
    1. Antonin, W., Holroyd C., Fasshauer D., Pabst S., Von Mollard G.F., and Jahn R.. 2000. A SNARE complex mediating fusion of late endosomes defines conserved properties of SNARE structure and function. EMBO J. 19:6453–6464. 10.1093/emboj/19.23.6453 - DOI - PMC - PubMed
    1. Apodaca, G., Gallo L.I., and Bryant D.M.. 2012. Role of membrane traffic in the generation of epithelial cell asymmetry. Nat. Cell Biol. 14:1235–1243. 10.1038/ncb2635 - DOI - PMC - PubMed
    1. Apodaca, G., Katz L.A., and Mostov K.E.. 1994. Receptor-mediated transcytosis of IgA in MDCK cells is via apical recycling endosomes. J. Cell Biol. 125:67–86. 10.1083/jcb.125.1.67 - DOI - PMC - PubMed
    1. Babbey, C.M., Ahktar N., Wang E., Chen C.C., Grant B.D., and Dunn K.W.. 2006. Rab10 regulates membrane transport through early endosomes of polarized Madin-Darby canine kidney cells. Mol. Biol. Cell. 17:3156–3175. 10.1091/mbc.e05-08-0799 - DOI - PMC - PubMed

Publication types

Substances