. 2023 Dec;72(12):4367-4383.
doi: 10.1007/s00262-023-03571-8. Epub 2023 Nov 29.

HPV-associated head and neck cancer is characterized by distinct profiles of CD8+ T cells and myeloid-derived suppressor cells

Affiliations

HPV-associated head and neck cancer is characterized by distinct profiles of CD8+ T cells and myeloid-derived suppressor cells

Benjamin A Kansy et al. Cancer Immunol Immunother. 2023 Dec.

Abstract

Patients with HPV--localized head and neck cancer (HNC) show inferior outcomes after surgery and radiochemotherapy compared to HPV-associated cancers. The underlying mechanisms remain elusive, but differences in immune status and immune activity may be implicated. In this study, we analyzed immune profiles of CD8+ T cells and myeloid-derived suppressor cells (MDSC) in HPV+ versus HPV- disease.The overall frequency of CD8+ T cells was reduced in HNC versus healthy donors but substantially increased after curative therapy (surgery and/or radiochemotherapy). In HPV+ patients, this increase was associated with significant induction of peripheral blood CD8+/CD45RA-/CD62L- effector memory cells. The frequency of HPV-antigen-specific CD8+ cells was low even in patients with virally associated tumors and dropped to background levels after curative therapy. Pre-therapeutic counts of circulating monocytic MDSC, but not PMN-MDSC, were increased in patients with HPV- disease. This increase was accompanied by reduced fractions of terminally differentiated CD8+ effector cells. HPV- tumors showed reduced infiltrates of CD8+ and CD45RO+ immune cells compared with HPV+ tumors. Importantly, frequencies of tumor tissue-infiltrating PMN-MDSC were increased, while percentages of Granzyme B+ and Ki-67+ CD8 T cells were reduced in patients with HPV- disease.We report differences in frequencies and relative ratios of MDSC and effector T cells in HPV- HNC compared with more immunogenic HPV-associated disease. Our data provide new insight into the immunological profiles of these two tumor entities and may be utilized for more tailored immunotherapeutic approaches in the future.

Keywords: CD8+ T cells; HPV; Head and neck cancer; MDSC; Oropharyngeal cancer.


Conflict of interest statement

The authors declare no financial interests. Sven Brandau is a member of the journals’ editorial board.

Figures

Fig. 1
Fig. 1
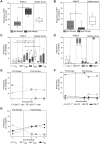
Differences in the CD8+ T cell compartment between HNC patients and healthy donors. PBMC from HNC patients and healthy donors were isolated by density gradient centrifugation, stored frozen until use, and analyzed by flow cytometry. Data are depicted as the relative frequency of CD8+ in CD3+ (A), CCR7+ in CD8+ (B), and CD62L+ in CD8 (C). In (D) expression of activation and exhaustion markers PD-1 and TIM-3 on CD8 cells was quantified by flow cytometry (DP = double positive, DN = double negative). (E) Depicts the gating strategy for CD8+ T cell phenotype subpopulations and representative examples of a HNC patient and a healthy donor. Gating was done as follows: naïve T cells (TN, CD45RA+ CD45RO CD62L+), central memory T cells (TCM, CD45RA CD45RO+ CD62L+), effector memory T cells (TEM, CD45RA CD45RO+ CD62L), and terminally differentiated effector memory RA T cells (TTD, CD45RA+ CD45RO CD62L). (F) Frequency of CD8+ T cell subsets in HNC patients and healthy donors. Data are presented as box plots showing median with percentiles (25th, 75th) and 5th/95th whiskers. The Mann–Whitney rank sum test (AC) and the Kruskal–Wallis ANOVA on ranks [post hoc: Dunn ‘s method] (D, F) were used for statistical analysis. * indicates a p value < 0.05
Fig. 2
Fig. 2
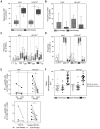
Pre-therapy to post-therapy changes in CD8+ T cells of HNC patients. Pre-therapy samples were obtained from tumor-bearing patients before the onset of therapy. Post-therapy samples were obtained at the first monitoring visit during routine tumor aftercare. Relative frequency of pre-therapy and post-therapy samples of CD8+ cells (A) and CCR7+/CD8+ cells (B) was determined in HNC patients and healthy donors. CD8+ T cell subsets (C) and expression of PD-1 and TIM-3 (D) were quantified by flow cytometry (DN = double negative, DP = double positive). In paired columns of the same color the left column represents the pre-therapy sample and the right column represents the post-therapy sample. Note the post-therapy increase in TEM and TTD in (C). (EG) shows a representative example of an extended longitudinal monitoring in a HNC patient. Blood was taken over a period of 15 month. Data are presented as box plots showing median with percentiles (25th, 75th) and 5th/95th whiskers. The Mann–Whitney Rank Sum test (AB) and the Kruskal–Wallis ANOVA on ranks [post hoc: Dunn‘s method] (CD) were used for statistical analysis. * indicates a p value < 0.05
Fig. 3
Fig. 3
Analysis of CD8+ T cells in HPV versus HPV+ patients. HPV16 status was determined by a HPV family gene probe followed by a nested PCR to determine viral subtype if HPV+. The relative frequency of CD8+ cells (A) and CCR7+/CD8+ cells (B) was determined in pre-therapy and post-therapy samples by flow cytometry. CD8+ T cell subsets (C) and expression of PD-1 and TIM-3 (D) were quantified by flow cytometry (DN = double negative, DP = double positive). In paired columns of the same color, the left column represents the pre-therapy sample and the right column represents the post-therapy sample. Note the post-therapy increase of TEM in HPV+ patients (C). (E) The frequency of HPV16 E7-specific CD8+ T cells was determined by flow cytometric dextramer analysis. Note the decrease of HPV-specific T cells in post-therapy samples of HPV+ patients. (F) IFN-γ ELISpot was used to determine the HPV16-specific cytokine response of CD8+ T cells, positive control: Phytohemagglutinin-L (PHA). Data are presented as box plots showing median with percentiles (25th, 75th) and 5th/95th whiskers. The Mann–Whitney rank sum test (AB, E) and the Kruskal–Wallis ANOVA on ranks [post hoc: Dunn‘s method] (CD) were used for statistical analysis. * indicates a p value < 0.05
Fig. 4
Fig. 4
Analysis of CD8+ T cells in HPV16-driven versus non-HPV-driven HNC. HPV16 RNA positivity was determined by immunohistochemistry for the surrogate markers pRb and p16. Whole tissue slides (FFPE) from each patient were stained for pRb and p16 with representative examples shown in (A). High p16 and low pRb indicate RNA positivity and HPV16-driven HNC. Low p16 and high pRb indicate RNA negativity. The relative frequency of CD8+ cells (B) and CCR7+/CD8+ cells (C) was determined in pre-therapy and post-therapy (surgery, surgery + R(C)Tx, primary R(C)Tx) samples by flow cytometry. CD8+ T cell subsets (D) and expression of PD-1 and TIM-3 (E) were quantified by flow cytometry (DN = double negative, DP = double positive). In paired columns of the same color the left column represents the pre-therapy sample and the right column represents the post-therapy sample. Note the post-therapy increase of TEM in HPV16RNA+ patients (D). Data are presented as box plots showing median with percentiles (25th, 75th) and 5th/95th whiskers. The Mann–Whitney rank sum test (BC) and the Kruskal–Wallis ANOVA on ranks [post hoc: Dunn‘s method] (DE) were used for statistical analysis. * indicates a p value < 0.05
Fig. 5
Fig. 5
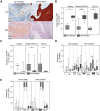
Peripheral blood MDSC frequency is linked to HPV status and correlates with T cell phenotype. MDSC analysis was performed in pre-therapy patient and healthy donor samples by flow cytometry. Polymorphonuclear MDSC (PMN-MDSC), monocytic MDSC (M-MDSC), and immature or early-stage MDSC (e-MDSC) were determined in HPV, HPV+ HNC patients, and healthy donors. Note the increased M-MDSC frequency in HPV patients (A). The gating strategy is shown by representative dot plots in (B). Frequency of M-MDSC in HPV patients correlates with expression of CD62L (C, weak, yet significant) and amounts of terminally differentiated T cells (TTD) (moderate, D). Data are presented as vertical point plot or scatter dot plot with regression line. The Mann–Whitney rank sum test (A) and linear regression (CD) were used for statistical analysis. * indicates a p value < 0.05
Fig. 6
Fig. 6
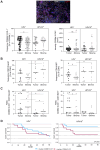
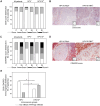
PMN MDSC fractions and CD8+ T cell ratios differ in HPV+ and HPV patients and are associated with survival in the HPV+ cohort. Analysis of 61 tumor tissue samples from patients with p16+ or p16 oropharyngeal cancer (second cohort, see Table 2) by multi-color immunofluorescence. The frequency and density of CD66b+/LOX1+ PMN-MDSC (A) and frequency of Granzyme B+ cytotoxic or Ki67+ proliferating (B) CD8+ T cells was determined by digital pathology using tissue studio software modules. (C) shows PMN-MDSC to effector T cell ratios. The prognostic value of the frequency of PMN-MDSC was analyzed in HPV+ and HPV patients using Kaplan–Meier curves and overall survival (D). Data are presented as median dot plots. The Mann–Whitney rank sum test and the Kruskal–Wallis ANOVA on ranks [post hoc: Dunn‘s method] were used for statistical analysis. Survival analysis is depicted in Kaplan–Meier curves. * indicates a p value < 0.05
Fig. 7
Fig. 7
T cell infiltration in the tumor microenvironment differs between HPV and HPV+ patients. Tumor microarrays (including several samples for each patient) were immunohistochemically stained for CD8 and CD45RO, respectively. Epithelial tumor cell nests (iT) and intratumoral stromal (St) regions were scored independently. A score based on the approximate percentage of stained cells (1: 0–10%, 2:10–50%, 3:50–80%, and 4:80–100%) was assigned to each region by three blinded, independent, and trained investigators. Score distribution was compared between all patients, HPV and HPV+ HNC patients (A, C). Representative tissue slides with scores for CD8 (B) and CD45RO (D) are shown. (E) A combined immunograde (IG) for CD8 and CD45RO was calculated by adding the number of high infiltrate regions of CD8 and CD45RO. The score for the immunograde ranged from 0 (no high infiltrate region) to 4 (all 4 regions are highly infiltrated). IG0 and IG1 were considered the low infiltrate group, whereas the high infiltrate group consists of IG2–IG4. Data are presented as stacked box plots. The Chi-square test (E) was used for statistical analysis. * indicates a p value < 0.05

Similar articles

Cited by

References

    1. Jung AC, et al. Biological and clinical relevance of transcriptionally active human papillomavirus (HPV) infection in oropharynx squamous cell carcinoma. Int J Cancer. 2010;126(8):1882–1894. doi: 10.1002/ijc.24911. - DOI - PubMed
    1. Dayyani F, et al. Meta-analysis of the impact of human papillomavirus (HPV) on cancer risk and overall survival in head and neck squamous cell carcinomas (HNSCC) Head Neck Oncol. 2010;2:15. doi: 10.1186/1758-3284-2-15. - DOI - PMC - PubMed
    1. Zhang W, et al. Integrative genomics and transcriptomics analysis reveals potential mechanisms for favorable prognosis of patients with hpv-positive head and neck carcinomas. Sci Rep. 2016;6:24927. doi: 10.1038/srep24927. - DOI - PMC - PubMed
    1. Mandal R, et al. The head and neck cancer immune landscape and its immunotherapeutic implications. JCI Insight. 2016;1(17):e89829. doi: 10.1172/jci.insight.89829. - DOI - PMC - PubMed
    1. Kimple RJ, et al. Enhanced radiation sensitivity in HPV-positive head and neck cancer. Cancer Res. 2013;73(15):4791–4800. doi: 10.1158/0008-5472.CAN-13-0587. - DOI - PMC - PubMed

MeSH terms

Substances