. 2023 Dec;9(48):eadh1436.
doi: 10.1126/sciadv.adh1436. Epub 2023 Nov 29.

Enhanced TP53 reactivation disrupts MYC transcriptional program and overcomes venetoclax resistance in acute myeloid leukemias

Affiliations

Enhanced TP53 reactivation disrupts MYC transcriptional program and overcomes venetoclax resistance in acute myeloid leukemias

Yuki Nishida et al. Sci Adv. 2023 Dec.

Abstract

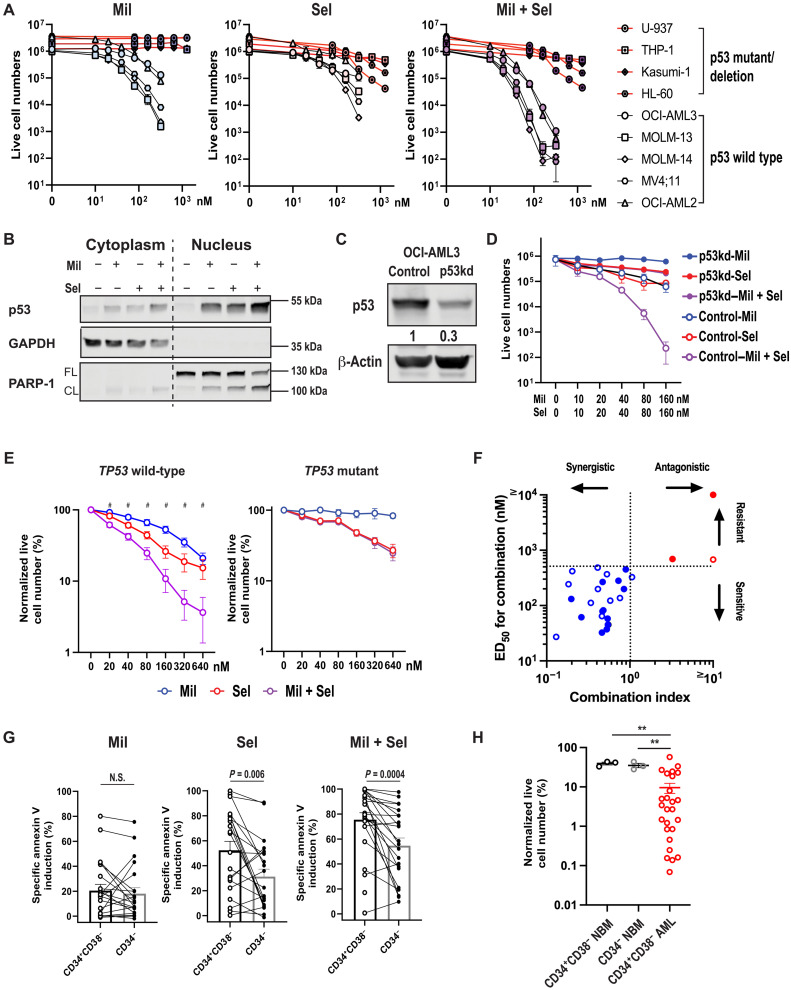
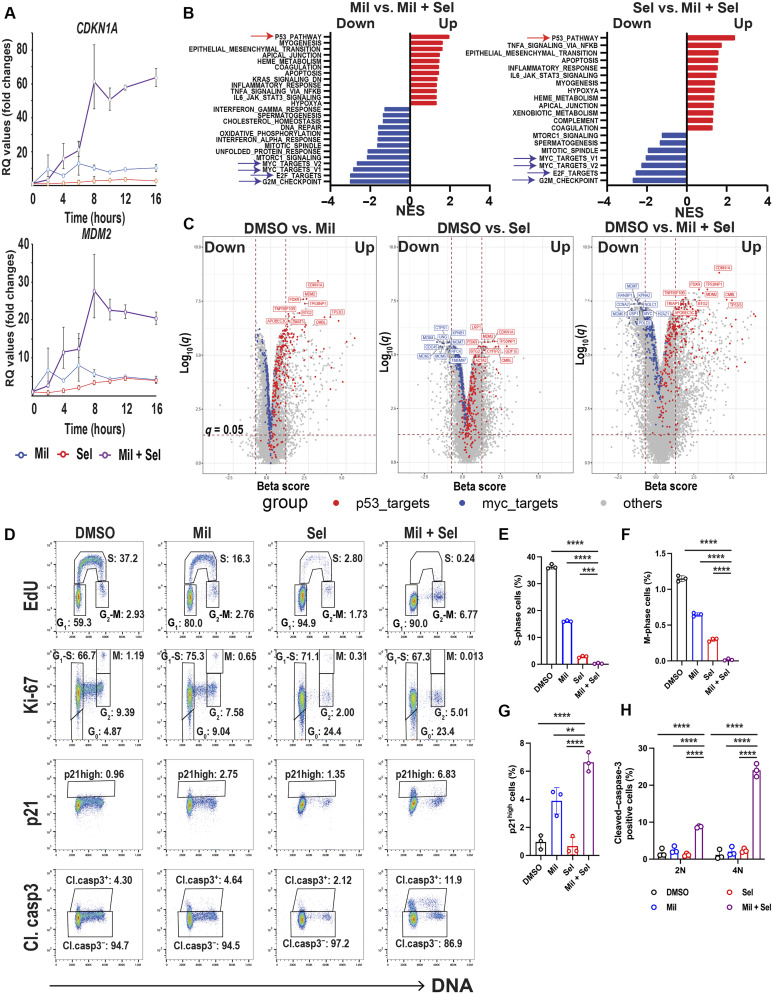
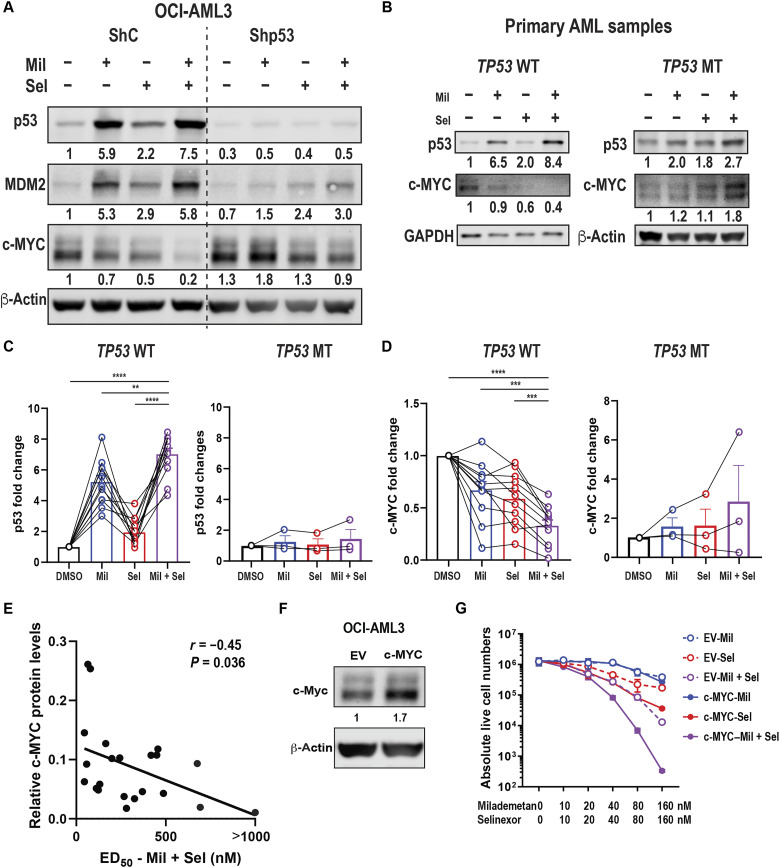
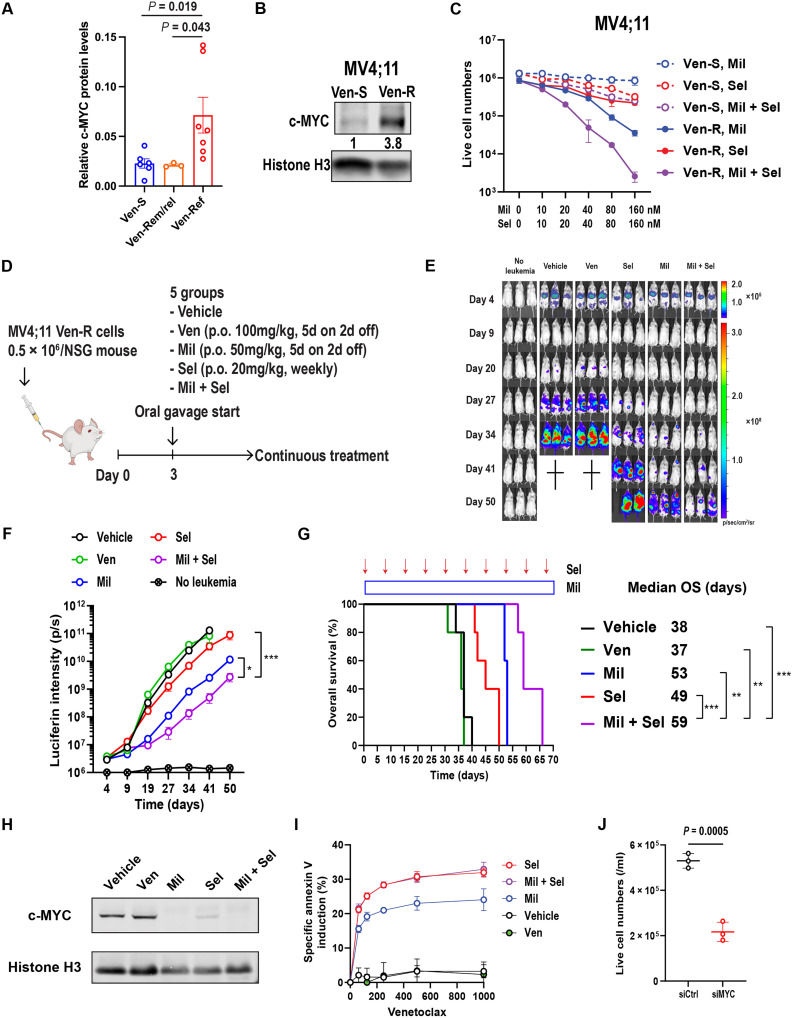
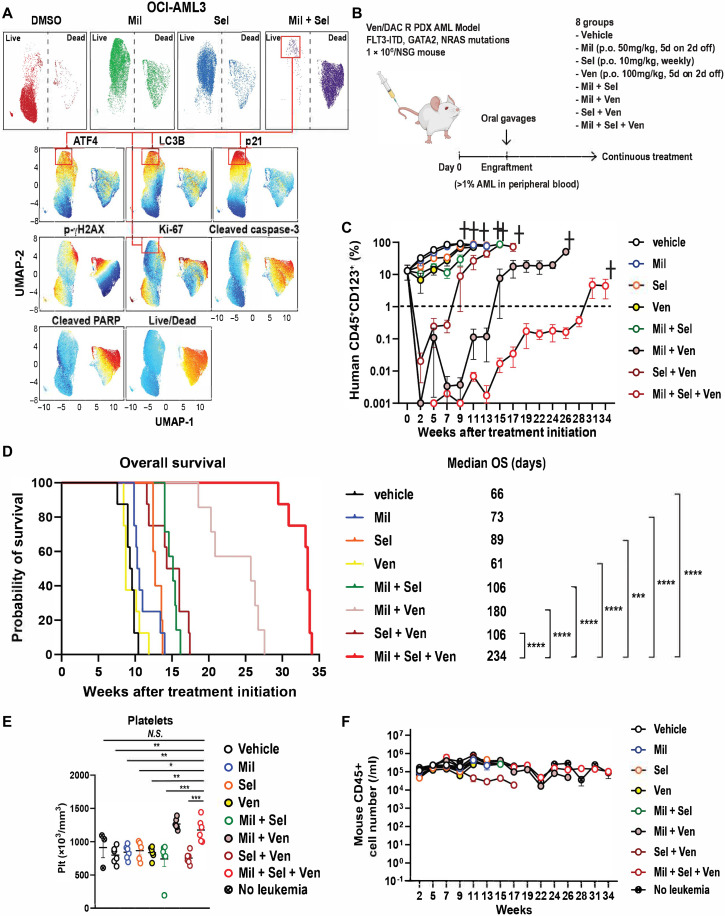
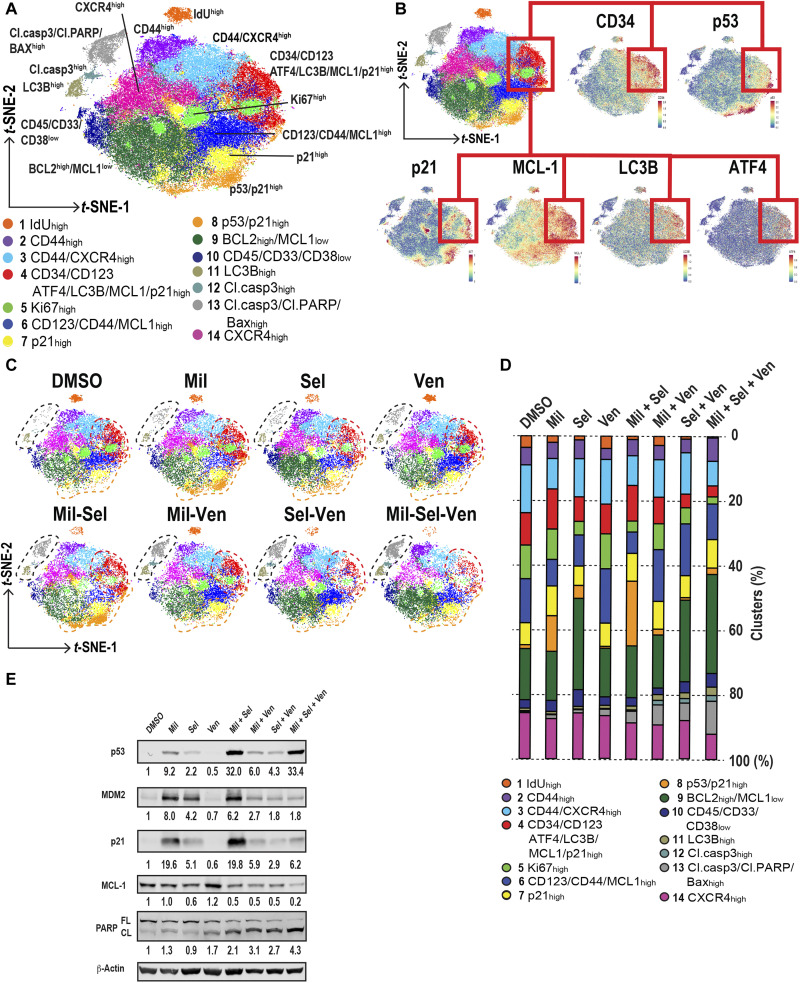
The tumor suppressor TP53 is frequently inactivated in a mutation-independent manner in cancers and is reactivated by inhibiting its negative regulators. We here cotarget MDM2 and the nuclear exporter XPO1 to maximize transcriptional activity of p53. MDM2/XPO1 inhibition accumulated nuclear p53 and elicited a 25- to 60-fold increase of its transcriptional targets. TP53 regulates MYC, and MDM2/XPO1 inhibition disrupted the c-MYC-regulated transcriptome, resulting in the synergistic induction of apoptosis in acute myeloid leukemia (AML). Unexpectedly, venetoclax-resistant AMLs express high levels of c-MYC and are vulnerable to MDM2/XPO1 inhibition in vivo. However, AML cells persisting after MDM2/XPO1 inhibition exhibit a quiescence- and stress response-associated phenotype. Venetoclax overcomes that resistance, as shown by single-cell mass cytometry. The triple inhibition of MDM2, XPO1, and BCL2 was highly effective against venetoclax-resistant AML in vivo. Our results propose a novel, highly translatable therapeutic approach leveraging p53 reactivation to overcome nongenetic, stress-adapted venetoclax resistance.


Figures

Fig. 1.
Fig. 1.. Dual MDM2/XPO1 inhibition accumulates nuclear p53 and induces synergistic cytoreduction in TP53 wild-type AML stem/progenitor cells.
(A) TP53 wild-type and TP53-mutant AML cell lines were treated with Mil, Sel, or Mil + Sel. (B) Immunoblots of cytoplasmic and nuclear fractionations of OCI-AML3 cells treated with Mil, Sel, or Mil + Sel for 12 hours. (C) Immunoblots of p53 in OCI-AML3 cells transfected with control short hairpin RNA (shRNA; control) and shp53 (p53kd). (D) OCI-AML3 control/p53kd cells were treated with Mil, Sel, or Mil + Sel. (E) TP53 wild-type (N = 27, left) and TP53-mutant (N = 3, right) primary AML samples were treated with Mil, Sel, or Mil + Sel. Data represent means ± SEM normalized live cell numbers of primary AML samples treated. #, significant differences in normalized live cell numbers after Mil + Sel versus Mil and Mil + Sel versus Sel. (F) A two-dimensional plot for combination indices and concentrations for ED50 values. TP53 wild-type and TP53-mutant primary AML samples are shown in blue and red, respectively. Open circles represent primary AML samples resistant to Ven-based regimens. (G) Percentages of specific apoptosis in CD34+CD38 immature versus CD34 mature AML cells treated with Mil, Sel, or Mil + Sel. Paired t tests were used for statistical comparisons. (H) Live cell numbers in CD34+CD38 and CD34 normal BM (NBM) and CD34+CD38 AML cells treated with Mil + Sel. The percentages of the live cell numbers were normalized to those of untreated cells. Data represent means ± SEM of the normalized live cell numbers of samples treated. A Mil and Sel concentration of 160 nM was used. GAPDH, glyceraldehyde-3-phosphate dehydrogenase; N.S., not significant. **P < 0.01.
Fig. 2.
Fig. 2.. Dual MDM2/XPO1 inhibition enhances p53 target transcription and dysregulates MYC transcriptional program, leading to cell cycle arrest.
(A) Relative quantitation (RQ) values by quantitative PCR for CDKN1A and MDM2 in OCI-AML3 cells treated with Mil, Sel, or Mil + Sel for the indicated time points. (B) Pathway analyses comparing Mil versus Mil + Sel and Sel versus Mil + Sel in RNA-seq in OCI-AML3 cells treated with Mil, Sel, or Mil + Sel for 12 hours. The top up-regulated and down-regulated pathways are indicated by red and blue arrows, respectively. NES, normalized enrichment score. (C) Volcano plots [beta score (magnitude) and q values (significance, −log10 scale)] from differential gene expression profiles in RNA-seq from OCI-AML3 cells DMSO versus Mil (left), Sel (middle), and versus Mil + Sel (right). The top 10 up-regulated TP53 targets and down-regulated MYC targets are indicated with red and blue colors, respectively. The remaining genes are indicated in gray. (D) Cell cycle analyses using multiparameter flow cytometry with Ki-67, p21, and cleaved caspase-3 in OCI-AML3 cells treated with Mil, Sel, or Mil + Sel for 24 hours. Caspase-3–negative cells were gated for EdU, Ki-67, and p21 panels. (E and F) Change in the percentages of cells in S (E) and M (F) phases in OCI-AML3 cells in indicated treatments. (G) The percentages of “p21 high” OCI-AML3 cells [rectangles shown in the third row of (D)] in indicated treatments. (H) Change of cell percentages of cleaved caspase-3–positive OCI-AML3 cells [rectangles shown in the fourth row of (D)] in indicated treatments for G1 (2N) and G2-M (4N) phases. A Mil and Sel concentration of 160 nM was used. **P < 0.01; ***P < 0.001; ****P < 0.0001.
Fig. 3.
Fig. 3.. Dual MDM2/XPO1 inhibition–mediated c-MYC reduction is p53 dependent and baseline c-MYC protein levels correlate with sensitivity to Mil + Sel.
(A) Immunoblot of p53, MDM2, and c-MYC in OCI-AML3 cells transfected with shRNA for scramble control (ShC) and p53 knockdown (Shp53) treated with Mil, Sel, or Mil + Sel for 12 hours. (B) Immunoblot of p53, MDM2, and c-MYC of TP53 wild-type (WT) and mutant (MT) primary AML samples treated with Mil, Sel, or Mil + Sel. (C) Protein levels of p53 in 10 TP53 WT (left) and 3 TP53 MT (right) primary AML samples. (D) Protein levels of c-MYC in 10 and 3 WT (left) and MT (right) TP53 primary AML samples. Data in (C) and (D) represent means ± SEM values. (E) The correlational plot of baseline c-MYC protein levels and ED50 values for Mil + Sel in primary AML samples. (F) Immunoblot of c-MYC in OCI-AML3 cells transfected with empty vector (EV) control or MYC-overexpressing plasmids (c-MYC). (G) Live cell numbers in OCI-AML3 EV and c-MYC cells treated with Mil, Sel, or Mil + Sel for 72 hours. A Mil and Sel concentration of 160 nM was used. **P < 0.01; ***P < 0.001; ****P < 0.0001.
Fig. 4.
Fig. 4.. Dual MDM2/XPO1 inhibition induces synergistic anti-leukemia effects in Ven-R AML cells.
(A) c-MYC protein levels in primary AML samples from patients sensitive to Ven-containing regimens (Ven-S; N = 6), those who had remission and then relapse (Ven-Rem/rel; N = 3), and those who had primarily refractory disease (Ven-Ref; N = 7). Data represent means ± SEM. (B) Immunoblot of c-MYC in MV4;11 Ven-S and resistant (Ven-R) cells. (C) Live cell numbers of MV4;11 Ven-S and Ven-R cells treated with Mil, Sel, or Mil + Sel for 72 hours. (D) Schematic diagram of in vivo xenograft model. (E) Images of leukemia burden measured by luciferin intensities in three representative mice from each treatment group. (F) Luciferin intensities of each treatment group (N = 8, 9, 8, 9, and 5 for vehicle, Ven, Mil, Sel, and Mil + Sel, respectively). (G) Survival curves of each treatment group and treatment durations of Mil (blue rectangle) and Sel (red arrows). (H) Immunoblots for c-MYC in MV4;11 Ven-R cells obtained from moribund mice in each in vivo treatment group. (I) Ven (48 hours)–specific annexin V induction in MV4;11 Ven-R cells after each in vivo treatment. (J) Live cell numbers of MV4;11 Ven-R cells treated with 200 nM of Ven (48 hours) with prior transfection with control siRNA (siCtrl) or MYC siRNA (siMYC) sequences. Histone H3 serves as the loading control in (B) and (H). **P < 0.01; ****P < 0.0001.
Fig. 5.
Fig. 5.. MDM2/XPO1 inhibition leaves alive p21high/Ki-67low AML cells and triple inhibition of MDM2, XPO1 and BCL2 exhibits superior anti-leukemia effects in Ven-R AML cells.
(A) Uniform manifold approximation and projection (UMAP) data of target protein levels determined in OCI-AML3 cells with indicated treatments (160 nM of Mil and/or Sel, 48 hours). Top: Two major populations of live (left) and dead (right) cells under each treatment condition. Bottom: Protein levels on a color scale with residual AML cells after Mil + Sel highlighted in connected red rectangles. (B) Schematic of the in vivo PDX AML model. (C) Percentages of live human AML cell numbers in PB specimens from mice treated with the indicated drugs. (D) OS of mice with indicated treatments (N = 8, 8, 8, 5, 7, 7, 8, and 8 for vehicle, Ven, Mil, Sel, Mil + Sel, Mil + Ven, Sel + Ven. and Mil + Sel + Ven groups, respectively). (E) Murine platelet counts in PB specimens in each treatment group at week of 7. (F) Murine CD45+ cell numbers in PB specimens collected from indicated treatment groups over the entire treatment courses (N = 6). Data represent means ± SEM values in (C), (E), and (F). *P < 0.05; **P < 0.01; ***P < 0.001; ****P < 0.0001.
Fig. 6.
Fig. 6.. Triple inhibition of MDM2, XPO1, and BCL2 induces apoptosis in p53 reactivation–responsive persistent AML cells with increased MCL1 along with stress responses.
(A) t-distributed stochastic neighbor embedding (t-SNE) plots generated by unsupervised clustering and dimension reduction using RphenoGraph. Clusters are annotated by numbers with distinct colors. (B) The t-SNE plot shown in (A) along with marker expression plots by t-SNE for CD34, p53, p21, MCL1, LC3B, and ATF4. Cluster 4 is connected by red lines and rectangles. (C) t-SNE plots of samples treated with each indicated treatment. Clusters 11, 12, and 13; cluster 4; and cluster 8 are circled by black, red, and orange dashed lines, respectively. (D) Proportions of each cluster in each sample with the indicated treatment in 195Pt-negative live cells. The colors correspond with the ones in the t-SNE plot shown in (A). (E) Immunoblots of indicated proteins collected from OCI-AML3 cells with indicated treatments (100 nM of Mil, Sel, and/or Ven for 24 hours).

References

    1. A. Vazquez, E. E. Bond, A. J. Levine, G. L. Bond, The genetics of the p53 pathway, apoptosis and cancer therapy. Nat. Rev. Drug Discov. 7, 979–987 (2008). - PubMed
    1. V. Llombart, M. R. Mansour, Therapeutic targeting of “undruggable” MYC. EBioMedicine 75, 103756 (2022). - PMC - PubMed
    1. J. S. Ho, W. Ma, D. Y. Mao, S. Benchimol, p53-Dependent transcriptional repression of c-myc is required for G1 cell cycle arrest. Mol. Cell. Biol. 25, 7423–7431 (2005). - PMC - PubMed
    1. T. J. Phesse, K. B. Myant, A. M. Cole, R. A. Ridgway, H. Pearson, V. Muncan, G. R. van den Brink, K. H. Vousden, R. Sears, L. T. Vassilev, A. R. Clarke, O. J. Sansom, Endogenous c-Myc is essential for p53-induced apoptosis in response to DNA damage in vivo. Cell Death Differ. 21, 956–966 (2014). - PMC - PubMed
    1. C. Lourenco, D. Resetca, C. Redel, P. Lin, A. S. MacDonald, R. Ciaccio, T. M. G. Kenney, Y. Wei, D. W. Andrews, M. Sunnerhagen, C. H. Arrowsmith, B. Raught, L. Z. Penn, MYC protein interactors in gene transcription and cancer. Nat. Rev. Cancer 21, 579–591 (2021). - PubMed

MeSH terms