. 2023 Nov 29;15(724):eadi0258.
doi: 10.1126/scitranslmed.adi0258. Epub 2023 Nov 29.

A T cell receptor β chain-directed antibody fusion molecule activates and expands subsets of T cells to promote antitumor activity

Affiliations

A T cell receptor β chain-directed antibody fusion molecule activates and expands subsets of T cells to promote antitumor activity

Jonathan Hsu et al. Sci Transl Med. .

Abstract

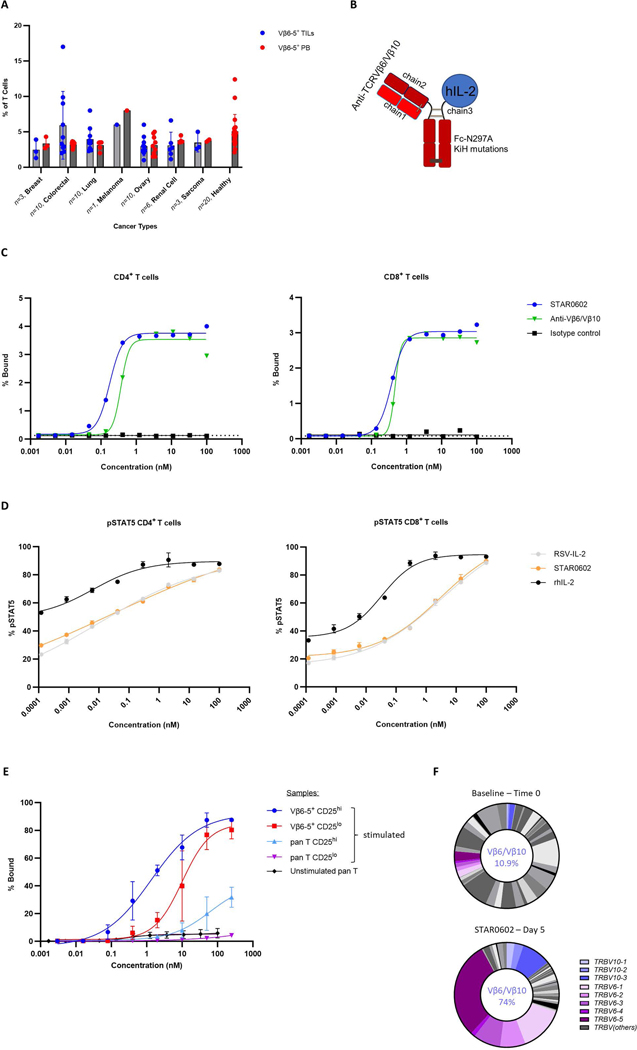
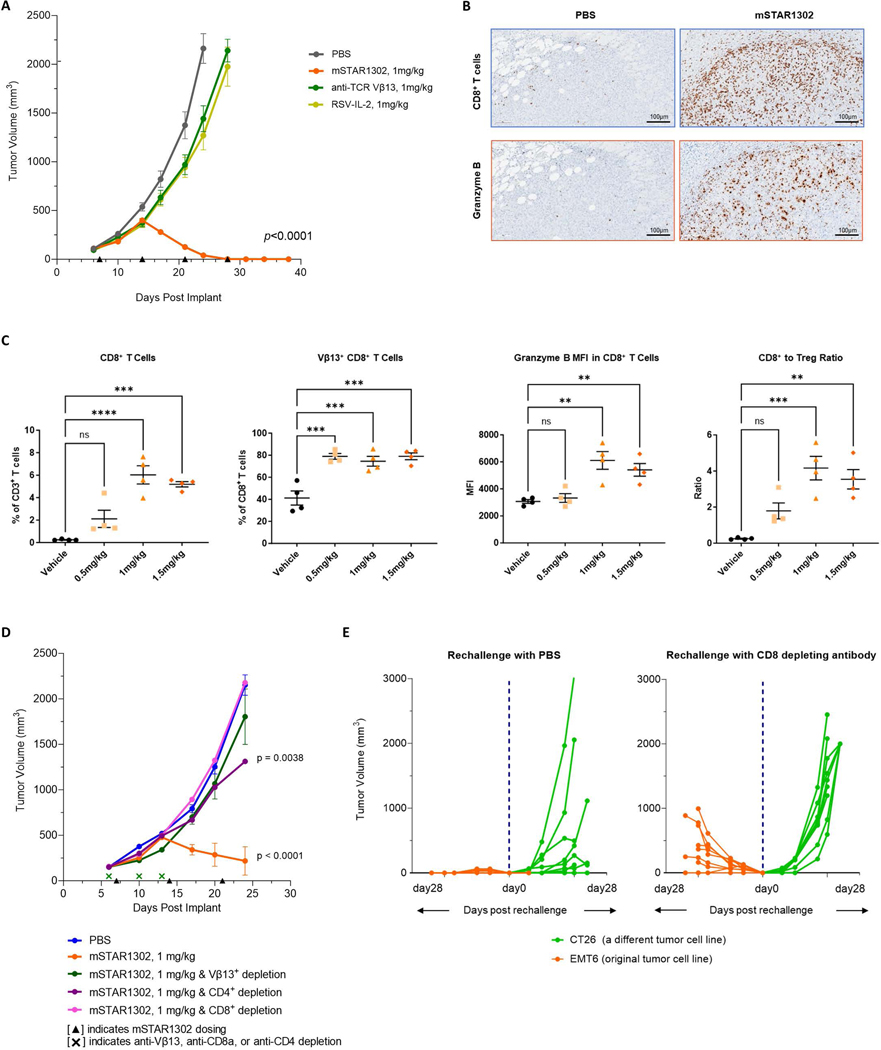
Despite the success of programmed cell death-1 (PD-1) and PD-1 ligand (PD-L1) inhibitors in treating solid tumors, only a proportion of patients respond. Here, we describe a first-in-class bifunctional therapeutic molecule, STAR0602, that comprises an antibody targeting germline Vβ6 and Vβ10 T cell receptors (TCRs) fused to human interleukin-2 (IL-2) and simultaneously engages a nonclonal mode of TCR activation with costimulation to promote activation and expansion of αβ T cell subsets expressing distinct variable β (Vβ) TCR chains. In solution, STAR0602 binds IL-2 receptors in cis with Vβ6/Vβ10 TCRs on the same T cell, promoting expansion of human Vβ6 and Vβ10 CD4+ and CD8+ T cells that acquire an atypical central memory phenotype. Monotherapy with a mouse surrogate molecule induced durable tumor regression across six murine solid tumor models, including several refractory to anti-PD-1. Analysis of murine tumor-infiltrating lymphocyte (TIL) transcriptomes revealed that expanded Vβ T cells acquired a distinct effector memory phenotype with suppression of genes associated with T cell exhaustion and TCR signaling repression. Sequencing of TIL TCRs also revealed an increased T cell repertoire diversity within targeted Vβ T cell subsets, suggesting clonal revival of tumor T cell responses. These immunological and antitumor effects in mice were recapitulated in studies of STAR0602 in nonhuman primates and human ex vivo models, wherein STAR0602 boosted human antigen-specific T cell responses and killing of tumor organoids. Thus, STAR0602 represents a distinct class of T cell-activating molecules with the potential to deliver enhanced antitumor activity in checkpoint inhibitor-refractory settings.


Conflict of interest statement

JH, MK, AB, JL, WH, GG, KS, JT, RS, RC, KL, and ZS are employees of Marengo Therapeutics and own stock in the company. AS has a consulting agreement in place with Marengo Therapeutics. RND, YTT, JS, and JLG report that their institute (NCI) has a Cooperative Research and Development Agreement (CRADA) with Marengo Therapeutics. JH, MK, GG and SP are inventors on patent applications US63/172,468 and PCT/US2022/023922 held/submitted by Marengo Therapeutics that cover anti-TCRVβ x Cytokine. EJW is a member of the Parker Institute for Cancer Immunotherapy and has consulting agreements with or is on the scientific advisory board for Merck, Roche, Pieris, Marengo Therapeutics and Surface Oncology. EJW has a patent licensing agreement on the PD-1 pathway with Roche–Genentech and is a founder of Arsenal Biosciences. J.L.G. as part of his official duties is an uncompensated co-chair of the SAB for Marengo.

Figures

Fig. 1.
Fig. 1.. Vβ6–5 T cells are detected in TILs, and STAR0602 binds with high affinity and selectivity in human T cells.
(A) Prevalence of Vβ6 TCR T cells in isolated TILs and PBMCs from patients with cancer (n=43) and from healthy donor PBMCs (n=20, data are presented as mean±SEM). (B) Schematic of STAR0602. (C) Binding curves for STAR0602 and control molecules to human CD4+ and CD8+ T cells (representative donor of n=3). (D) pSTAT5 activity comparing IL-2 bioactivity for STAR0602, RSV-IL-2 control, and rhIL-2 (representative donor of n=3, data are presented as mean ±SEM of technical duplicates). (E) STAR0602 binding to unstimulated and stimulated-sorted T cell populations (pan-T cells or Vβ6–5 sorted T cells comprising either high or low expression of CD25 following anti-CD3/CD28 stimulation or resting of cells, respectively) (representative donor of n=3, data are presented as mean ±SEM of technical triplicates). (F) Pie-chart of relative frequencies of human T cell Vβ6 (purple)- and Vβ10 (blue)-encoding transcripts before and after in vitro stimulation with STAR0602 at 10nM (n=3, data are presented as mean). Experiments in (E) and (F) were performed 2 times with similar results.
Fig. 2.
Fig. 2.. STAR0602 activates Vβ6/Vβ10 T cells in vitro with preferential expansion of CD8+ T cells with an atypical central memory-like phenotype.
(A) Expansion of human Vβ6/Vβ10 T cells with 10 nM STAR0602 over 8 days (representative donor of n=3). FSC, forward scatter. (B) Activation (CD25+) of human CD4+ (top) and CD8+ (bottom) T cells after a 5-day stimulation with STAR0602 (n=20, data are presented as mean±SEM) or controls. (C) Direct cell counts of human CD4+ and CD8+ T cells after a 5-day stimulation with STAR0602 (10nM) (n=4, data are presented as mean±SEM). (D) Representative flow cytometry plots showing the differentiation of Vβ6/Vβ10 CD8+ T cells to a central memory (CD95+ CD45RACCR7+) phenotype following a 7-day culture with STAR0602 (10 nM) or controls. (E) Summary analysis for CD4+ (left) and CD8+ (right) Vβ6/Vβ10 central memory T cells as a percentage of total Vβ6/Vβ10 T cells in (D); n=5, data are presented as mean±SEM. (F) Assessment of TCR and IL-2R signaling in purified CD8+ T cells stimulated with STAR0602 or controls by quantifying pSLP76, pERK, and pSTAT5 (representative donor of n=3, data are presented as mean ±SEM of technical replicates). (G) Percentage CD25+, IFN-γ+, and granzyme B+ triple positive CD8+ T cell subsets by flow cytometry after a 5-day stimulation with STAR0602 (10nM) or controls; n=4, data are presented as mean±SEM. Experiments in (B) are from 6 independent studies and (C) and (E) from 2 studies. Experiments in (G) were performed 2 times with similar results.
Fig. 3.
Fig. 3.. mSTAR1302 induces tumor regression and survival across multiple murine syngeneic solid tumor models.
(A) Tumor cell lines were implanted by subcutaneous injection. When tumors reached 80 to 150mm3, four or five intraperitoneal (IP) doses of mSTAR1302 were administered at a concentration of 1 mg/kg (CT26, EMT6, B16F10, MC38, and Renca) once weekly or 1.5 mg/kg (RM1) twice weekly. The individual tumor volumes were monitored by caliper measurements over time for a threshold of 2000mm3, which was the study endpoint; n=8–10 mice per group as indicated. Arrowheads indicate dosing days. (B) Survival curve for each tumor model. Significance was measured by Log-Rank-Mantel-Cox test (****p<0.0001). Studies with CT26 and EMT6 were performed 3 times and MC38 and B16F10 were performed 2 times with similar results.
Fig. 4.
Fig. 4.. mSTAR1302 induces tumor regression and protection from rechallenge in the EMT6 breast carcinoma model that is dependent on Vβ13 T cells.
(A) Antitumor activity of four treatments of mSTAR1302 (1 mg/kg once weekly) in EMT6 mice compared to control molecules (n=8, data are presented as mean±SEM, significance was measured by one-way ANOVA with Brown-Forsythe and Welch tests, p<0.0001). (B) IHC staining of EMT6 tumors for CD8+ T cells and granzyme B expression, and (C) immunophenotyping of TILs isolated from EMT6 mice on day 14 post tumor implant. n=4, data are presented as mean±SEM, significance was measured by one-way ANOVA with Dunnett’s multiple comparisons test, ****p<0.0001, ***p<0.001, **p<0.01, ns = not significant. MFI, mean fluorescence intensity. (D) Antitumor activity of mSTAR1302 in EMT6 mice with and without depleting anti-Vβ13, anti-CD8a (6/10 mice died due to immunogenicity from depletion antibody treatment), or anti-CD4 (n=10, data are presented as mean±SEM, significance was measured by one-way ANOVA with Brown-Forsythe and Welch tests, p<0.0001). (E) Cured EMT6 mice were rechallenged with EMT6 (orange curves), and CT26 (green curves) tumor cells in the absence of further treatment with mSTAR1302 and monitored for 28 days (left). n=9. The experiment in (E) was repeated in a cohort of mice that was depleted of CD8+ T cells (right).
Fig. 5.
Fig. 5.. mSTAR1302 induces a distinct gene signature in CD4+ and CD8+ TILs from the EMT6 breast carcinoma model, as measured by scRNA-seq.
(A) UMAP of 11,685 single CD4+ or CD8+ TILs isolated from EMT6 mice on day 14 post tumor implant following a single dose of mSTAR1302 (right) or PBS (left) from n=5 mice pooled per group. (B) Quantification (%) of cell subsets in EMT6 TILs from mice treated with PBS or mSTAR1302 and (C) quantification of Vβ13 T cells and indicated T cell ratios. (D) Heatmap of the number of differentially expressed genes (DEGs) in TILs when comparing Vβ13+ subsets from mSTAR1302 versus all T cell subsets in PBS-treated mice. (E) Heatmap of DEGs from the same samples as (D) constituting the gene signature in response to mSTAR1302 treatment compared to PBS across indicated T cell subsets. Expression values scaled for each gene. (F) Violin plots of selected DEGs in the same samples as (D) comparing imputed gene expression for PBS- and mSTAR1302-treated groups in CD8+ TEM cells.
Fig. 6.
Fig. 6.. mSTAR1302 increases TCR diversity in CD4+ and CD8+ Vβ TIL subsets from EMT6 breast carcinoma model.
(A) The top plot shows clonal CDR3 counts for targeted Vβ13 T cells (expressing Trbv13–2/3 transcripts) and non-targeted Vβ5 T cells (expressing Trbv5 transcripts) from EMT6 TILs. n=4 mice pooled per group. The lower bubble plots show total CDR3 counts and unique CDR3 sequences within the Trbv13–2/3 and Trbv5 genes in PBS- and mSTAR1302-treated groups (color indicates clonal size; size indicates percentage of total CDR3 counts within respective Trbv genes; text within each bubble indicates number of unique CDR3 sequences). (B) TCR diversity of TILs within Trbv13–2/3 or Trbv5 as in (A), calculated as inverse Simpson’s diversity index. (C) scRNA-seq UMAP indicating Trvb13–2/3 (red) and Trbv5 (purple) T cells in TILs from PBS- (left) and mSTAR1302-treated (right) mice. (D) Ex vivo tumor antigen recall assay within Vβ13 CD8+ T cell splenocytes isolated from EMT6-tumor bearing mice that were treated weekly with 0, 0.5, 1, or 1.5 mg/kg mSTAR1302, and co-cultured with EMT6 cell lysates for 16 hours to elicit T cell responses. B16F10 and CT26 tumor cell lysates were used as negative controls. Responses were quantified by IFN-γ intracellular flow cytometry staining. n=4 mice per group, significance was measured by two-way ANOVA with Bonferroni’s multiple comparisons test, ***p<0.001, **p<0.01, *p<0.05, data are presented as mean±SEM.
Fig. 7.
Fig. 7.. STAR0602 selectively expands target Vβ6 T cells in non-human primates with moderate cytokine release.
(A) STAR0602 serum concentrations after single IV dosing in cynomolgus monkeys; LLOQ, lower limit of quantification. n=2 (0.5 and 1.5 mg/kg), and n=3 (1 mg/kg), data are presented as mean±SEM. (B) CD8+ and CD4+ Vβ6/Vβ10 T cell and Treg frequency in blood after single STAR0602 1 mg/kg IV dose; n=3, data are presented as mean±SEM. (C) Serum concentrations of soluble CD25 and frequencies of pSTAT5+ CD8+ T cells following a single STAR0602 0.5 mg/kg IV dose; n=6, data are presented as mean±SEM. (D) Serum concentrations of indicated cytokines following a single STAR0602 0.5 mg/kg IV dose; n=6, data are presented as mean±SEM. (E) IL-5 concentrations and eosinophil counts measured before and after a single STAR0602 1mg/kg IV dose. The gray shaded region indicates the normal range of eosinophil counts; n=3, data are presented as mean±SEM.
Fig. 8.
Fig. 8.. STAR0602 shows antitumor activity in an ex vivo human tumor organoid model and expands antigen specific T cells.
(A) High content image of a human rectal cancer organoid with autologous TILs incubated with STAR0602 (3 μg/ml), anti-PD-1 (pembrolizumab, 10 μg/ml), or isotype control (3 μg/ml) for 5 days. Shown are immune (blue), tumor (red), and dead (green) cells. (B) Baseline Vβ6/Vβ10 T cell frequency in TILs from the four organoids. (C) Summary of cancer organoid killing across four models (n=4, data are presented as mean ±SEM of technical quadruplets. Significance was measured by one-way ANOVA with Dunnett’s multiple comparisons test, ****p<0.0001, **p<0.01, ns = not significant). (D) Ex vivo activation of HPV-16 specific T cells by STAR0602 in PBMCs from healthy donors (n=7, data are presented as mean±SEM, *p<0.05, ns = not significant). Significance was measured by the Wilcoxon signed rank test. (E) Ex vivo activation of HPV-16 specific T cells by STAR0602 in PBMCs from a patient with cervical cancer. In (D and E), PBMCs were treated for 1 hour with 1nM STAR0602, the isotype control, or media, and then stimulated with HPV-16 peptides or a negative control and stained for intracellular expression of IFN-γ, TNF-α, and IL-2, and CD107a; multifunctional T cells were those positive for 2 or more among these markers tested.

References

    1. Postow MA, Callahan MK, Wolchok JD, Immune checkpoint blockade in cancer therapy. J Clin Oncol 33, 1974–1982 (2015). - PMC - PubMed
    1. Garfall AL, Maus MV, Hwang WT, Lacey SF, Mahnke YD, Melenhorst JJ, Zheng Z, Vogl DT, Cohen AD, Weiss BM, Dengel K, Kerr ND, Bagg A, Levine BL, June CH, Stadtmauer EA, Chimeric Antigen Receptor T Cells against CD19 for Multiple Myeloma. N Engl J Med 373, 1040–1047 (2015). - PMC - PubMed
    1. Goebeler ME, Knop S, Viardot A, Kufer P, Topp MS, Einsele H, Noppeney R, Hess G, Kallert S, Mackensen A, Rupertus K, Kanz L, Libicher M, Nagorsen D, Zugmaier G, Klinger M, Wolf A, Dorsch B, Quednau BD, Schmidt M, Scheele J, Baeuerle PA, Leo E, Bargou RC, Bispecific T-Cell Engager (BiTE) Antibody Construct Blinatumomab for the Treatment of Patients With Relapsed/Refractory Non-Hodgkin Lymphoma: Final Results From a Phase I Study. J Clin Oncol 34, 1104–1111 (2016). - PubMed
    1. Moon EK, Wang LC, Dolfi DV, Wilson CB, Ranganathan R, Sun J, Kapoor V, Scholler J, Puré E, Milone MC, June CH, Riley JL, Wherry EJ, Albelda SM, Multifactorial T-cell hypofunction that is reversible can limit the efficacy of chimeric antigen receptor-transduced human T cells in solid tumors. Clin Cancer Res 20, 4262–4273 (2014). - PMC - PubMed
    1. Topalian SL, Hodi FS, Brahmer JR, Gettinger SN, Smith DC, McDermott DF, Powderly JD, Carvajal RD, Sosman JA, Atkins MB, Leming PD, Spigel DR, Antonia SJ, Horn L, Drake CG, Pardoll DM, Chen L, Sharfman WH, Anders RA, Taube JM, McMiller TL, Xu H, Korman AJ, Jure-Kunkel M, Agrawal S, McDonald D, Kollia GD, Gupta A, Wigginton JM, Sznol M, Safety, activity, and immune correlates of anti-PD-1 antibody in cancer. N Engl J Med 366, 2443–2454 (2012). - PMC - PubMed

Substances