. 2023 Nov 29;15(724):eabo5217.
doi: 10.1126/scitranslmed.abo5217. Epub 2023 Nov 29.

Radiation-induced bone loss in mice is ameliorated by inhibition of HIF-2α in skeletal progenitor cells

Affiliations

Radiation-induced bone loss in mice is ameliorated by inhibition of HIF-2α in skeletal progenitor cells

Wendi Guo et al. Sci Transl Med. .

Abstract

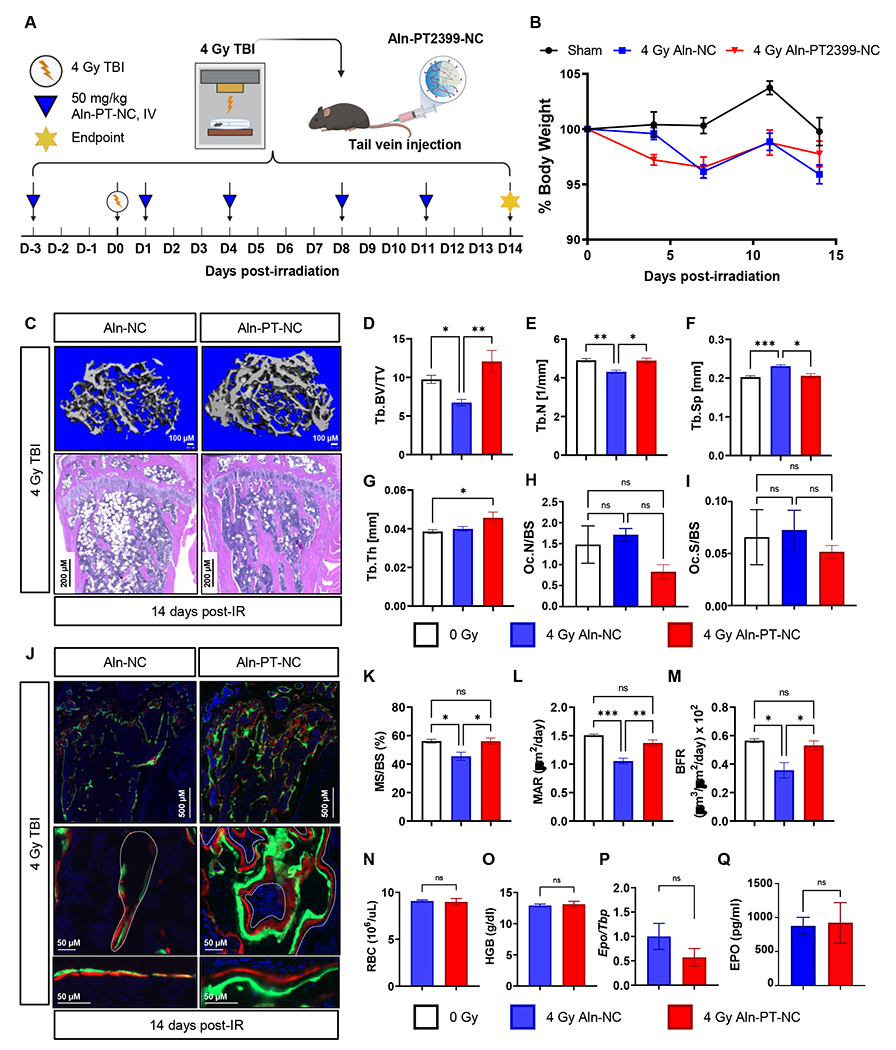
Radiotherapy remains a common treatment modality for cancer despite skeletal complications. However, there are currently no effective treatments for radiation-induced bone loss, and the consequences of radiotherapy on skeletal progenitor cell (SPC) survival and function remain unclear. After radiation, leptin receptor-expressing cells, which include a population of SPCs, become localized to hypoxic regions of the bone and stabilize the transcription factor hypoxia-inducible factor-2α (HIF-2α), thus suggesting a role for HIF-2α in the skeletal response to radiation. Here, we conditionally knocked out HIF-2α in leptin receptor-expressing cells and their descendants in mice. Radiation therapy in littermate control mice reduced bone mass; however, HIF-2α conditional knockout mice maintained bone mass comparable to nonirradiated control animals. HIF-2α negatively regulated the number of SPCs, bone formation, and bone mineralization. To test whether blocking HIF-2α pharmacologically could reduce bone loss during radiation, we administered a selective HIF-2α inhibitor called PT2399 (a structural analog of which was recently FDA-approved) to wild-type mice before radiation exposure. Pharmacological inhibition of HIF-2α was sufficient to prevent radiation-induced bone loss in a single-limb irradiation mouse model. Given that ~90% of patients who receive a HIF-2α inhibitor develop anemia because of off-target effects, we developed a bone-targeting nanocarrier formulation to deliver the HIF-2α inhibitor to mouse bone, to increase on-target efficacy and reduce off-target toxicities. Nanocarrier-loaded PT2399 prevented radiation-induced bone loss in mice while reducing drug accumulation in the kidney. Targeted inhibition of HIF-2α may represent a therapeutic approach for protecting bone during radiation therapy.


Conflict of interest statement

DGK owns stock and is on the scientific advisory board of Lumicell, which is commercializing intraoperative imaging technology. DGK is a co-founder of Xrad Therapeutics, which is developing radiosensitizers. These interests do not represent a conflict of interest with respect to the design, execution, or interpretation of the studies presented in this manuscript. The DGK laboratory receives research funding from Merck, Bristol Myers Squibb, and Varian Medical Systems, but this funding did not support the research described in this manuscript. CMT is a paid consultant for Xerient Pharmaceuticals. The remaining authors declare that they have no competing interests.

Figures

Fig. 1.
Fig. 1.. Radiation exposure disrupts the hypoxic bone microenvironment and is associated with a transient expansion of LepR+ stromal cells.
(A) Representative microCT and hematoxylin and eosin (H&E) images from 12-16 week old wild type (WT) mice that were untreated (sham 0 Gy) (n = 17) or treated with 4 Gy total body irradiation (TBI) (n = 3); scale bar 200 μm. (B to E) MicroCT analyses of trabecular bone parameters, (sham, n = 17; irradiated, n =3). (B) Trabecular bone volume/tissue volume (Tb.BV/TV), (C) trabecular number (Tb.N, 1/mm), (D) trabecular separation (Tb.Sp, mm), and (E) trabecular thickness (Tb.Th, mm) values are shown. (F) Fluorescent images of Lepr-tdTm mouse femoral bone. tdTomato+ cells (tdTm, red) and endomucin+ cells (endo, green), 3 and 14 days post-irradiation (4 Gy TBI). (G) Representative flow cytometry plots and (H) quantification of percent tdTm+ cells. (I) Representative flow cytometry plots and (J) quantification of percent endo+ cells from bone marrow aspirates of Lepr-tdTm animals at 3 and 14 days post-irradiation (4 Gy TBI); (sham, n = 5; irradiated day 3, n = 4; irradiated day 14, n = 7). SSC-A, side scatter area. (K and L) Fluorescent pimonidazole (PIMO) staining (green) in femoral bone of Lepr-tdTm mice 3 days post-irradiation (4 Gy TBI). Growth plate (GP), metaphysis (MP), pimonidazole and Lepr-tdTm+ cells (white arrows) (n = 3). (M) Percentage of PIMO+ cells per total cells and (N) percent tdTm+ cells per PIMO+ cells 3 days post-irradiation (4 Gy TBI). Scale bars: 10x: 100 μm, 40x: 50 μm. (n = 3). Data are presented as means ± SEM. Statistical analysis was performed using either (M and N) Student’s t-test or (B, C, D, E, H, and J) one-way ANOVA with Tukey’s post hoc test. *p < 0.05, **p < 0.01, ***p < 0.001, and ****p < 0.0001.
Fig. 2.
Fig. 2.. BMSCs and LepR+ cells respond to hypoxia by decreasing mineralization and stabilizing HIF-2α.
(A) Representative phase and fluorescent images of a tdTm+ colony and (B) quantification of percent of tdTm+ colonies per total colonies isolated from Lepr-tdTm mice (n = 4). (C) Representative flow cytometry scatter plots and (D) quantification of tdTm+ cells per total number of cells in BMSCs isolated from control and Lepr-tdTm animals (n = 3). (E) Representative images and (F) quantification of crystal violet (CV) stained colony-forming unit-fibroblast (CFU-F) assays from BMSCs isolated from WT control mice under normoxic 21% O2 and hypoxic 1% O2 conditions (n = 3). (G and H) Quantitative reverse transcription-PCR (qRT-PCR) of osteogenic BMSC cultures incubated in 21% O2 and 1% O2 for (G) Bsp and (H) Bglap (n = 3). (I) Representative western blot of HIF-2α protein in BMSCs under 21%, 2%, or 1% O2 conditions. (J to L) qRT-PCR of BMSC cultures incubated under 21%, 2% or 1% O2 conditions measuring mRNA expression of HIF target genes including (J) Glut1, (K) Pgk, and (L) Bnip3. (n = 3). (M) Representative western blot analysis of HIF-2α from BMSCs isolated from Epasfl/fl control (CNL) and HIF-2α cKO knockout mice (cKO) under 21% O2 and 1% O2 conditions (n = 2). (N and O) qRT-PCR of osteogenic BMSC cultures isolated from control and HIF-2α cKO for (N) Bglap and (O) Bsp (n = 3). (P) qRT-PCR of Epas1 from whole bone homogenates isolated from non-irradiated and 4 Gy TBI animals (n = 3). Scale bar 100 μm. Statistical analysis was performed using (F, G, H, N, O, and P) Student’s t-test or (J, K, and L) one-way ANOVA with Tukey’s post hoc test as appropriate. Data are presented as means ± SEM. *p < 0.05, **p < 0.01, ***p < 0.001, and ****p < 0.0001.
Fig. 3.
Fig. 3.. HIF-2α cKO alters the transcriptome of LepR+ cells and maintains a homeostatic hypoxic microenvironment following radiation injury.
(A) Transcriptomic analysis displayed as a heatmap showing a portion of differentially expressed genes (DEG) center-scaled by row (≥ 1.5 expression change, p < 0.05). (B and C) GO functional enrichment analysis of DEGs highlighting (B) downregulated and (C) upregulated putative processes when comparing tdTm+ cells isolated from irradiated Lepr-tdTm control to irradiated Lepr-tdTm-HIF-2α cKO animals; all cells were collected 14 days post-irradiation (n = 3 per group). FDR ≥ 0.05. (D) Representative flow cytometry plots and (E) analysis of percentage of tdTm+ cells from bone marrow aspirates of irradiated Lepr-tdTm (control, n = 7) and Lepr-tdTm-HIF-2α cKO (n = 3) animals at 14 days post-irradiation. (F) Representative images and quantification of CFU-F assays from irradiated Epas-1fl/fl control and HIF-2α cKO mice stained with (G) crystal violet (CV) and (H) alizarin red (AR), (n = 3 per group). (I) Representative fluorescent images and (J) quantification of images of femoral bones isolated from Lepr-tdTm control and Lepr-tdTm-HIF-2α cKO mice, stained with pimonidazole staining (PIMO, green) 3 days following 4 Gy TBI (n = 3). Scale bar 10x - 100 μm. Statistical analysis was performed using (E, G and H) Student’s t-test or (J) one-way ANOVA with Tukey’s post hoc test. Data are presented as means ± SEM. *p < 0.05, **p < 0.01, and ***p < 0.001.
Fig. 4.
Fig. 4.. HIF-2α deletion in Lepr-expressing cells prevents radiation-induced bone loss and promotes downstream osteoblast activity.
(A) Representative microCT of trabecular bone (upper panel), and cortical bone (lower panel). (B) H&E histological images from 12-16 week old non-irradiated and irradiated control and HIF-2α cKO animals. Scale bar 200 μm. (C to H) MicroCT analyses of bone parameters: (C) Tb.BV/TV, (D) Tb.N (1/mm), (E) Tb.Sp (mm), (F) Tb.Th (mm). (G) cortical area/tissue area (Ct.A/TA), and (H) cortical thickness (Ct.Th) (mm). non-irradiated (n = 6) and irradiated control (n = 7) and HIF-2α cKO animals (n = 4). (I) Representative microCT images from 12-16 week old Hif-1afl/fl (control) and Lepr-specific HIF-1α cKO (HIF-1α cKO) animals. (J to M) MicroCT analyses of trabecular bone parameters of control animals treated with 0 Gy (n = 10) or 4Gy control (n = 5), as well as HIF-1α cKO animals treated with 4Gy (n = 5). (J) Tb.BV/TV, (K) Tb.N (1/mm), (L) Tb.Sp, (mm), and (M) Tb.Th (mm) are shown. (N) Representative TRAP-stained tissue sections (n = 3) and quantification of (O) osteoclast number/bone surface (Oc.N/BS) (n = 3) and (P) osteoclast surface/bone surface (Oc.S/BS) (n = 3). Scale bar 100 μm. (Q) Representative calcein (green) and alizarin red (red) double labeled sections of the distal femur. Scale bar 500 μm (upper panel) and 50μm (lower panel). (R to T) Analysis of dynamic histomorphometric parameters including (R) mineralizing surface/bone (MS/BS) (%) surface, (S) mineral apposition rate (MAR) (μm2/day), and (T) bone formation rate (BFR) (μm3/μm2/day). (n = 3) . (U) Quantification of osmium tetroxide staining presented as adipose volume/total volume (AV/TV); 0 Gy Control (n = 4), 4 Gy Control (n = 7), 4 Gy HIF-2α cKO (n = 4). All analysis were performed on mice 14 days post-4 Gy TBI. Statistical analysis was performed using (R, S, and T) Student’s t-test or one-way (C, D, E, F, G, H, J, K, L, M, O, P, and U) ANOVA with Tukey’s post hoc test as appropriate. Data are presented as means ± SEM. *p < 0.05, **p < 0.01, and ***p < 0.001.
Fig. 5.
Fig. 5.. Oral PT2399 treatment ameliorates bone loss and induces mildly anemic phenotype following 8 Gy single limb radiation.
(A) Schematic of PT2399-mediated inhibition of HIF-2α. (B) Western blot analysis of HIF-2α in BMSCs treated with PT2399 (n = 2). (C) Schematic of single limb radiation treatment protocol. Green boxes showing the region of right hindlimb receiving 100% of 8 Gy, anterior-posterior/posterior-anterior (AP/PA) beams. (D) Schematic of oral PT2399 treatment regimen. (E) Representative microCT and (F) histological images of 12 week old non-irradiated and irradiated WT mice treated with vehicle or oral PT2399. Scale bar 200 μm (G) microCT analyses of Tb.BV/TV from non-irradiated mice treated with vehicle (n = 10) or PT2399 (n = 4) and irradiated WT mice treated with vehicle (n = 8) or PT2399 (n = 9). (H) Percentage body weight of animals across experimental time course. (I) Red blood cell (RBC) counts and (J) hemoglobin (HGB) of irradiated vehicle and PT2399 treated animals analyzed from whole blood CBC analysis. n ≥ 4 per group. (K) qRT-PCR analyses of Epo from kidney homogenates of irradiated vehicle and PT2399 treated animals, Tata box binding protein (Tbp) was used as a housekeeping gene. (L) Analysis of EPO in serum determined by ELISA in vehicle or PT2399 treated mice (n = 5). All analysis were performed on mice 14 days post-irradiation. Statistical analysis was performed using (I, J, K, and L) Student’s t-test or (G and H) one-way ANOVA with Tukey’s post hoc test as appropriate. Data are presented as means ± SEM. *p < 0.05, **p < 0.01, and ***p < 0.001.
Fig. 6.
Fig. 6.. Aln-PT-NC exhibit increased targeting to bone tissue and reduced accumulation in the kidney.
(A) Abbreviated schematic of Aln-PT-NC synthesis and drug loading. (B) In vivo fluorescence images of fluorescently-labeled non-targeted PT2399-loaded (Ctrl-PT-NC) and Alendronate (Aln)-conjugated PT2399 loaded (Aln-PT-NC) nanocarrier distribution 4 days and (C) 20 days post-treatment. (n = 3). Nanocarriers were conjugated with similar amounts of Cy7 dye for visualization by IVIS imaging. White arrows indicate Cy7-conjugated Aln-PT-NC colocalized to bone. (D) Representative IVIS images and (E) quantification of average radiant efficiency represented per gram of the tissue of non-targeted (Ctrl) and bone-targeted (Aln) nanocarrier in the vertebra, (F and G) femur, (H and I) tibia, and (J and K) kidney. n = 4 per group. Statistical analysis was performed using Student’s t-test. Data are presented as means ± SEM. *p < 0.05, **p < 0.01, ***p < 0.001, and ****p < 0.0001.
Fig. 7.
Fig. 7.. Aln-PT-NC treatment protects against bone loss associated with 4 Gy total body irradiation and attenuates anemic phenotype.
(A) Schematic of nanocarrier treatment regimen. (B) Percentage body weight of experimental animals across 14 days of treatment with unloaded Aln-conjugated nanocarrier (Aln-NC) and PT2399-loaded Aln-conjugated nanocarrier (Aln-PT-NC). (C) MicroCT and H&E images of Aln-NC and Aln-PT-NC treated animals (n = 5 per group). Scale bar 200 μm. (D to G) Quantification of trabecular bone parameters of Aln-NC and Aln-PT-NC treated animals at 14 days post-irradiation (n = 5 per group). Shown are (D) Tb.BV/TV, (E) Tb.N (1/mm), (F) Tb.N (mm), and (G) Tb.Sp (mm). Quantification of (H) Oc.N/BS and (I) Oc.S/BS. (J) Representative calcein (green) and alizarin red (red) double labeled sections of the distal femur from irradiated Aln-NC and Aln-PT-NC treated mice (n = 4) Scale bar 500 μm (upper panel) and 50μm (middle and lower panels). (K to M) Analysis of dynamic histomorphometric parameters using double labeling, reporting (K) MS/BS (%) (L) MAR (μm2/day), and (M) BFR (μm3/μm2/day) n = 3 per group. (N) RBC counts and (O) HGB analyzed from whole blood CBC analysis. (P) RT-qPCR analyses of Epo from kidney homogenates of Aln-NC and Aln-PT-NC treated mice. (Q) Analysis of EPO in serum determined by ELISA in Aln-NC and Aln-PT-NC treated mice. All analysis were performed on mice 14 days post-irradiation, n ≥ 5 per group, unless otherwise noted. Statistical analysis was performed using (N, O, P, and Q) Student’s t-test or (B, D, E, F, G, H, I, K, L, and M) one-way ANOVA with Tukey’s post hoc test as appropriate. Data are presented as means ± SEM. *p < 0.05, **p < 0.01, and ***p < 0.001.

References

    1. Barton MB, Jacob S, Shafiq J, Wong K, Thompson SR, Hanna TP, Delaney GP, Estimating the demand for radiotherapy from the evidence: a review of changes from 2003 to 2012. Radiother Oncol 112, 140–144 (2014). - PubMed
    1. Delaney G, Jacob S, Featherstone C, Barton M, The role of radiotherapy in cancer treatment: estimating optimal utilization from a review of evidence-based clinical guidelines. Cancer 104, 1129–1137 (2005). - PubMed
    1. Overgaard M, Spontaneous radiation-induced rib fractures in breast cancer patients treated with postmastectomy irradiation. A clinical radiobiological analysis of the influence of fraction size and dose-response relationships on late bone damage. Acta Oncol 27, 117–122 (1988). - PubMed
    1. Pierce SM, Recht A, Lingos TI, Abner A, Vicini F, Silver B, Herzog A, Harris JR, Long-term radiation complications following conservative surgery (CS) and radiation therapy (RT) in patients with early stage breast cancer. Int J Radiat Oncol Biol Phys 23, 915–923 (1992). - PubMed
    1. Baxter NN, Habermann EB, Tepper JE, Durham SB, Virnig BA, Risk of pelvic fractures in older women following pelvic irradiation. JAMA 294, 2587–2593 (2005). - PubMed

Substances