. 2023 Nov 29;15(724):eabp9599.
doi: 10.1126/scitranslmed.abp9599. Epub 2023 Nov 29.

Resident microbes shape the vaginal epithelial glycan landscape

Affiliations

Resident microbes shape the vaginal epithelial glycan landscape

Kavita Agarwal et al. Sci Transl Med. .

Abstract

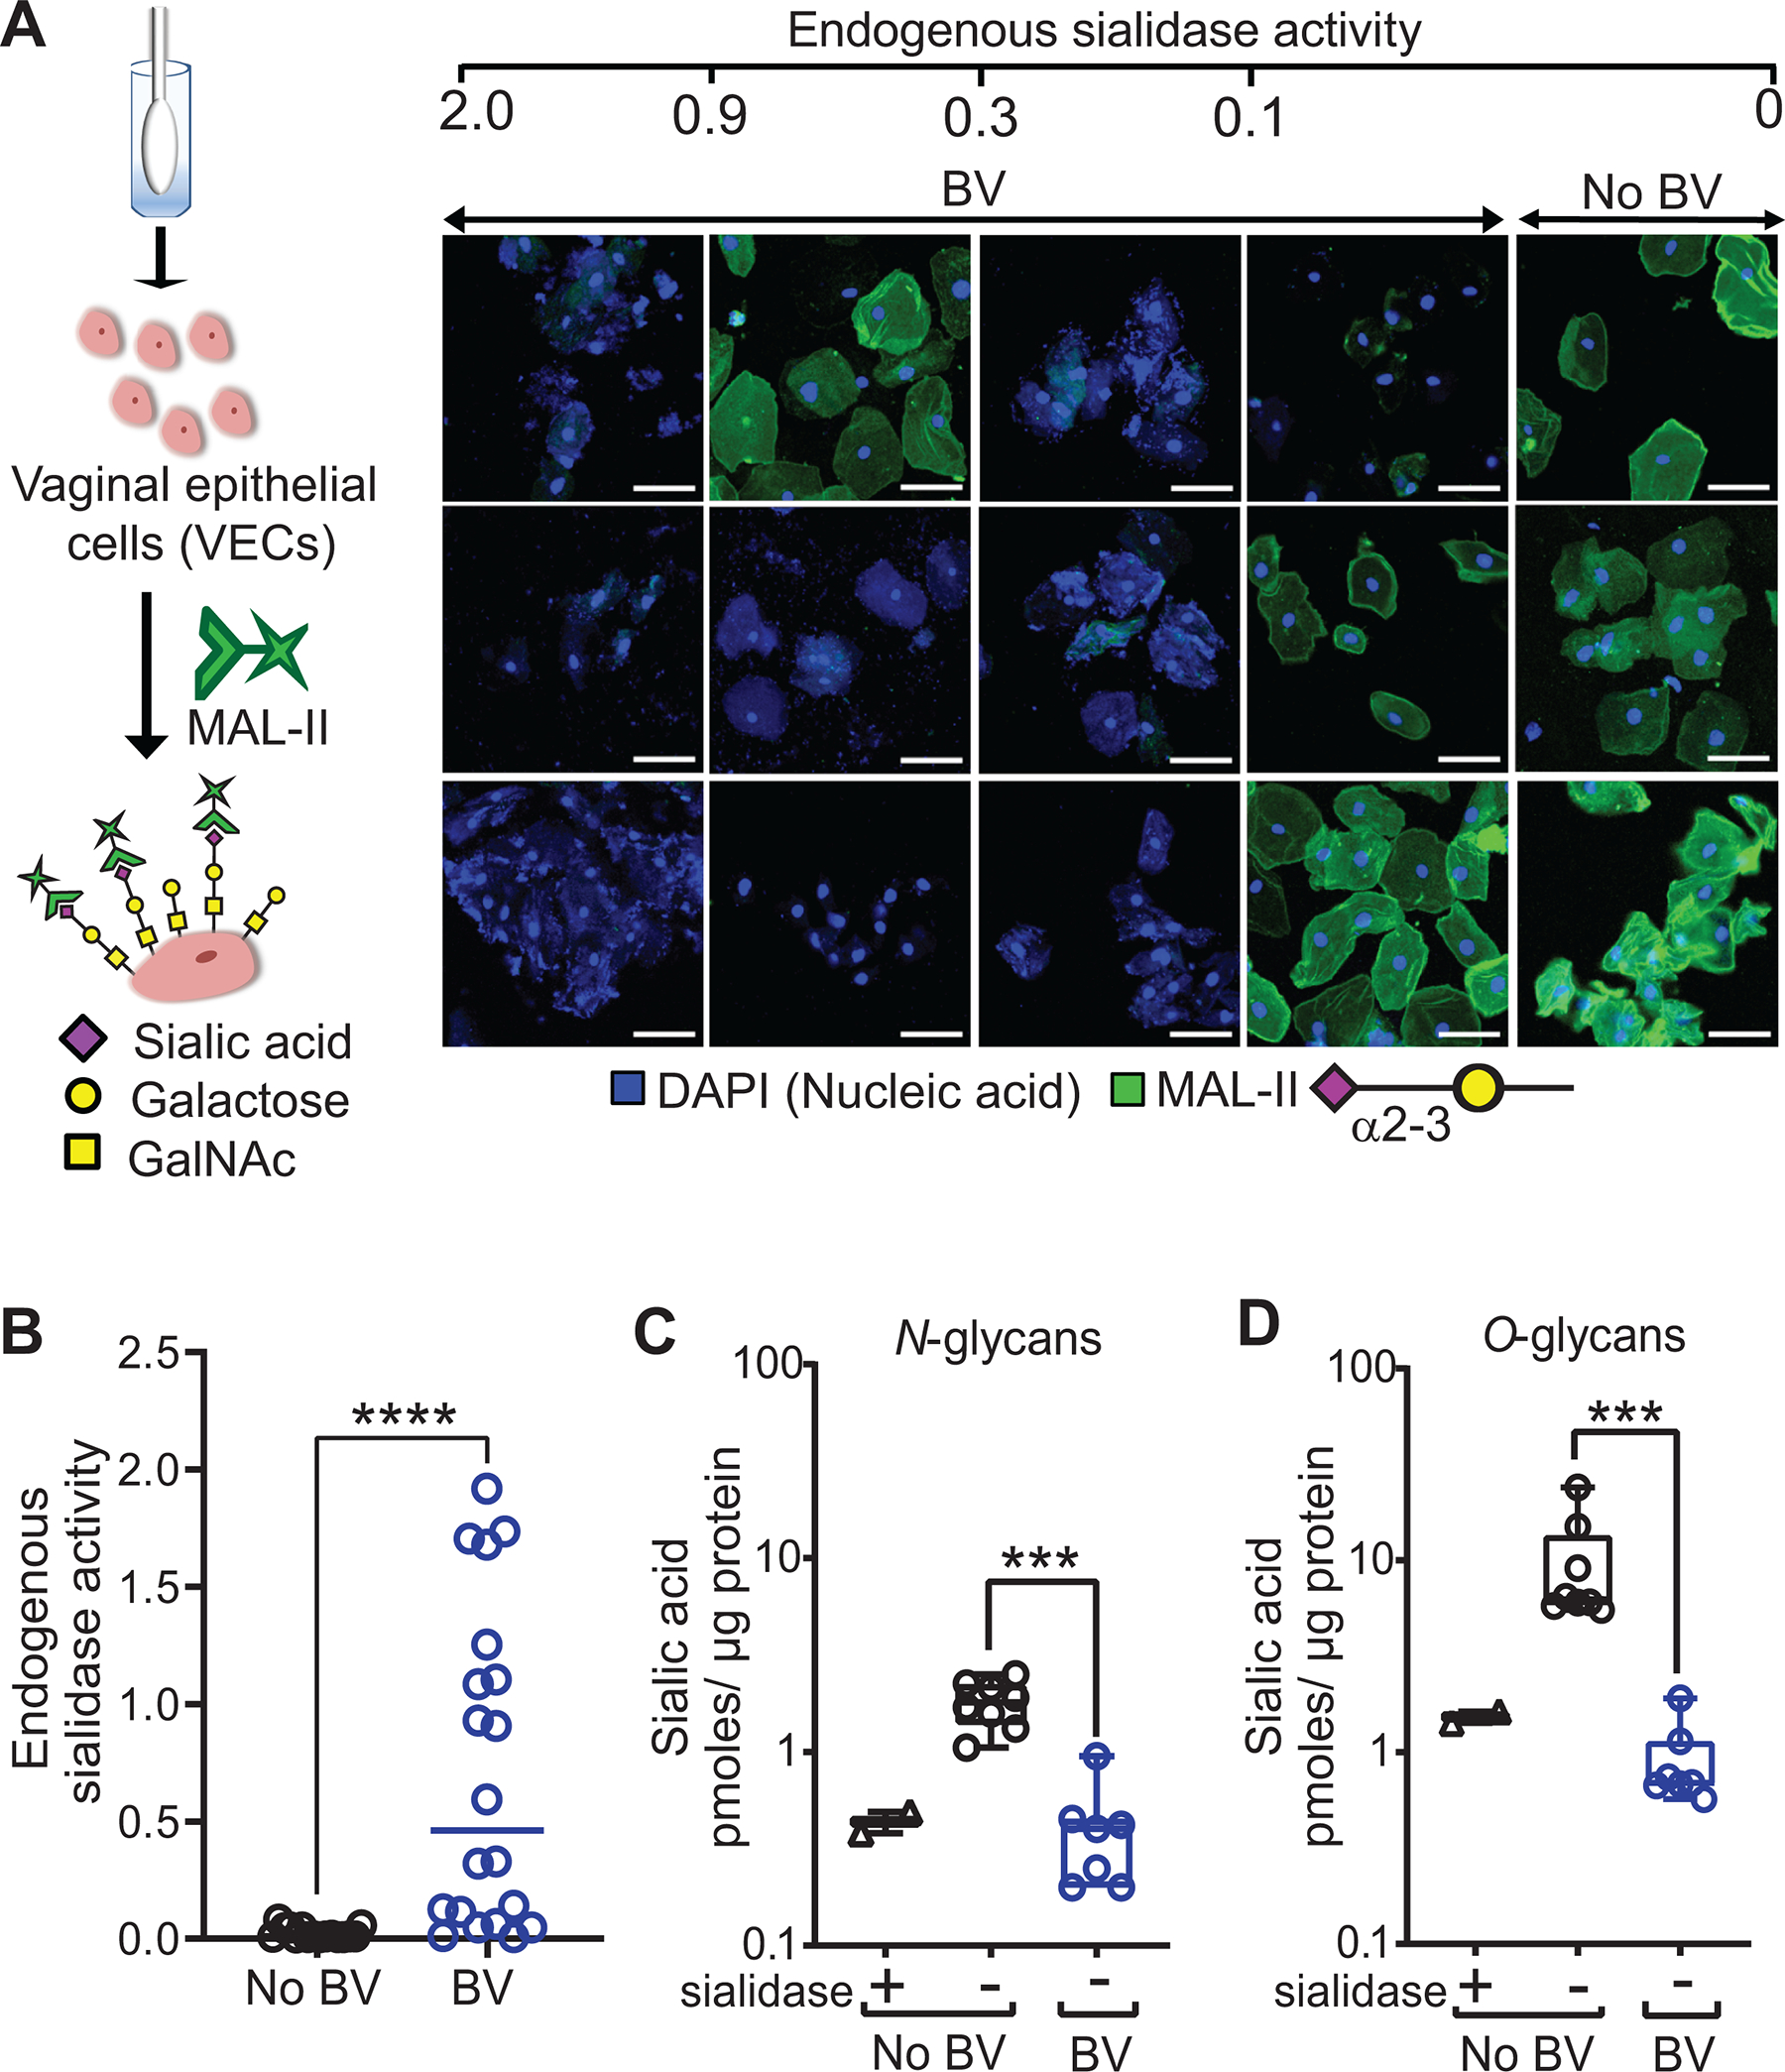
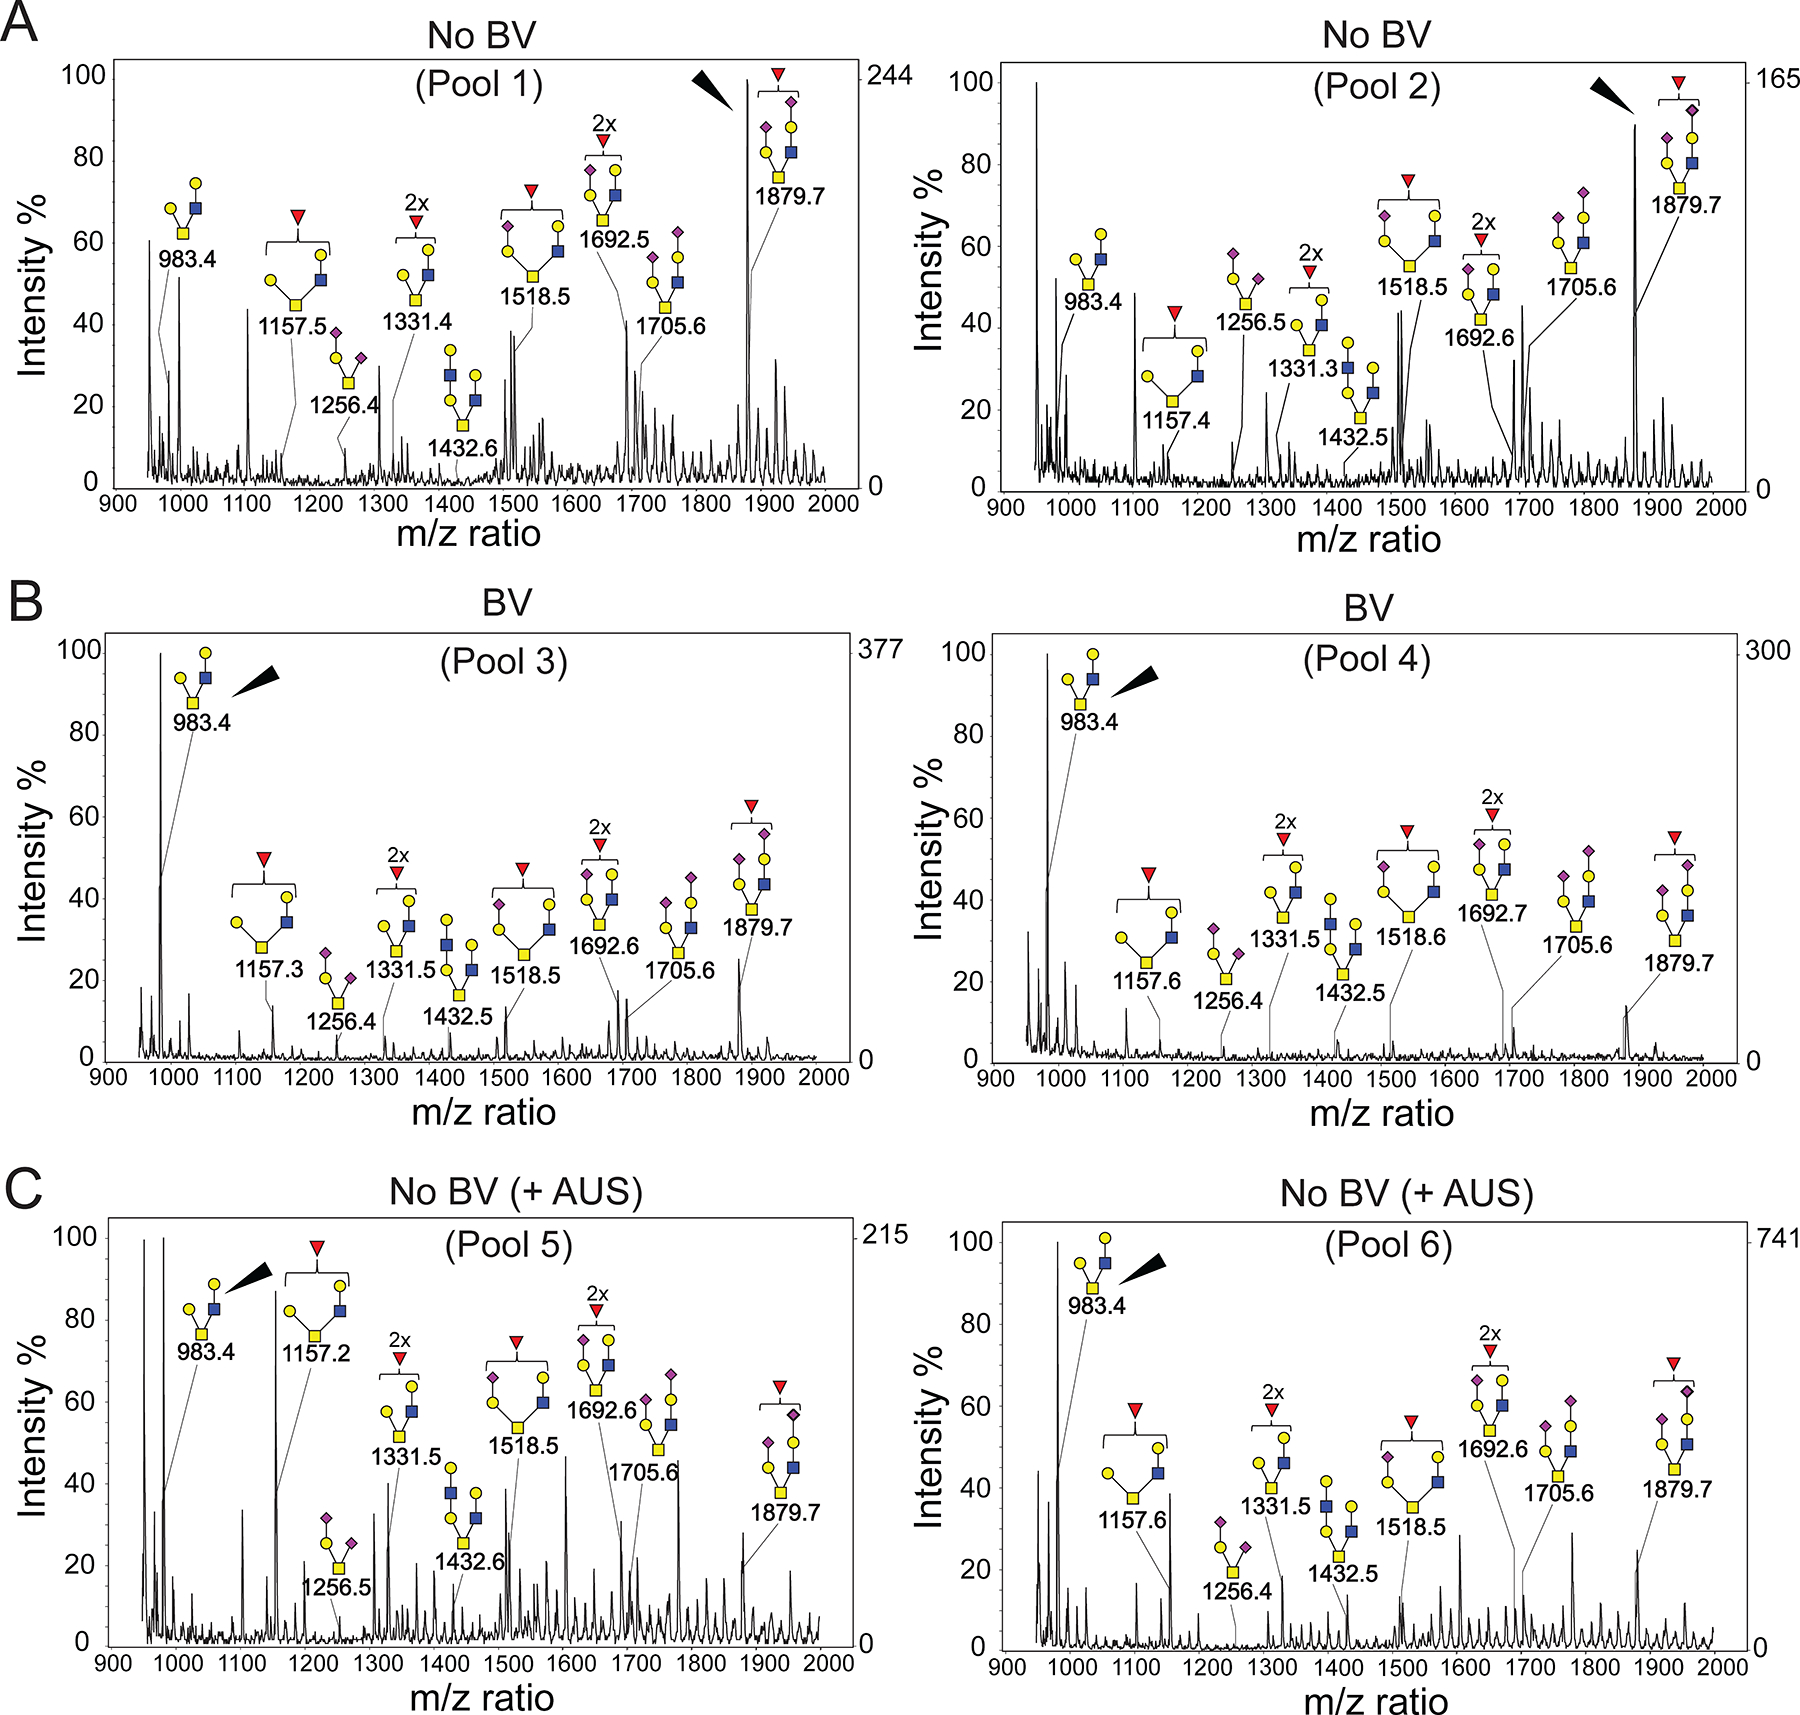
Epithelial cells are covered in carbohydrates (glycans). This glycan coat or "glycocalyx" interfaces directly with microbes, providing a protective barrier against potential pathogens. Bacterial vaginosis (BV) is a condition associated with adverse health outcomes in which bacteria reside in direct proximity to the vaginal epithelium. Some of these bacteria, including Gardnerella, produce glycosyl hydrolase enzymes. However, glycans of the human vaginal epithelial surface have not been studied in detail. Here, we elucidate key characteristics of the "normal" vaginal epithelial glycan landscape and analyze the impact of resident microbes on the surface glycocalyx. In human BV, glycocalyx staining was visibly diminished in electron micrographs compared to controls. Biochemical and mass spectrometric analysis showed that, compared to normal vaginal epithelial cells, BV cells were depleted of sialylated N- and O-glycans, with underlying galactose residues exposed on the surface. Treatment of primary epithelial cells from BV-negative women with recombinant Gardnerella sialidases generated BV-like glycan phenotypes. Exposure of cultured VK2 vaginal epithelial cells to recombinant Gardnerella sialidase led to desialylation of glycans and induction of pathways regulating cell death, differentiation, and inflammatory responses. These data provide evidence that vaginal epithelial cells exhibit an altered glycan landscape in BV and suggest that BV-associated glycosidic enzymes may lead to changes in epithelial gene transcription that promote cell turnover and regulate responses toward the resident microbiome.


Conflict of interest statement

Competing interests

Dr. Amanda Lewis is on the scientific advisory board of GlycoNet. Dr. Carlito B. Lebrilla is a co-founder and consultant for Infinant Health, InterVenn Bio, and BCD Bioscience. He is also a consultant for Turtle Tree. All other authors declare that they have no competing interests.

Figures

FIG. 1.
FIG. 1.. Depletion of sialic acids from vaginal glycans in women with BV.
(A) Left Panel: The schematic shows a summary of cell isolation and lectin staining. Representative mucin-type O-glycan structure of sialyl T-antigen, containing alpha1–3 linked sialic acid, is displayed on the cell surface. Right Panel: Representative confocal images of VECs stained with MAL-II lectin (green) recognizing α2–3-linked sialic acids from individual women without BV (n=3) and with BV (n=12). Specimens were compared across varying amounts of endogenous sialidase activity. Nuclei and bacterial cells (blue) are stained with DAPI. Scale bars = 50 μm. (B) Quantification of endogenous sialidase activity in the vaginal swab eluates using the fluorogenic substrate Neu5Ac-4-methyl umbelliferone (4MU-sialic acid). Data shown is the rate of 4MU hydrolysis and the points represent values for individual women (n=16 without BV and n=20 with BV). Data in A and B is combined from 3 independent experiments. Images shown in A are from a subset of specimens used in B. (C and D) Fluorimetric quantification of 1,2-diamino-4,5-methylenedioxybenzene (DMB)-labelled sialic acid (Neu5Ac) in isolated VEC N- and O-glycans, using reversed-phase chromatography after mild acid hydrolysis. Graph shows sialic acid quantification on glycans derived from protein extracts of pools of VECs from women with BV (Nugent scores 7–10, N=7 pools from a total n=45 specimens, with 5 or 10 specimens in each pool) and without BV (Nugent scores 0–3, No BV, N=8 pools from a total of n=55 specimens, with 5 or 10 specimens in each pool). Glycans derived from No BV VEC pools pretreated with sialidase from Arthrobacter ureafaciens were included as a control (N=2 pools with n=10 specimens in each pool). Data in C and D are from same pools of VECs and were combined from 2 independent experiments. Error bars show standard deviation for each group, Mann–Whitney U test was used. ***P < 0.001, ****P<0.0001. A total of n=151 specimens were used to generate these data. A subset of VEC pools from C and D were also used for studies reported in Fig. 2, Fig. 3 and table S2. See methods for pooling rationale.
FIG. 2.
FIG. 2.. Sialylated vaginal epithelial N-linked glycans are depleted in BV.
(A) Schematic for 2-amino benzamide (2AB) profiling of N- linked glycans by high performance anion exchange chromatography (HPAEC). Glycans were released using PNGase-F from protein extracts derived from VECs pools and fluorescently labelled with 2-AB prior to analysis by HPAEC. (B) HPAEC profiles of 2-AB labeled N-glycans derived from protein standards, with well-known glycan structures, RNase B and Bovine Fetuin; 2 pools of No BV VECs (n=10 specimens/pool); and 2 pools of BV VECs (n=10 specimens/pool). (C) HPAEC profiles of N-glycans derived from RNase B and Bovine Fetuin and pools of No BV VECs (same VEC pools as used in B, n=10 specimens/pool) pretreated with commercially available sialidase (+A.u. sialidase, dotted line) or with buffer alone (−A.u. sialidase, solid line). A.u. sialidase = sialidase from Arthrobacter ureafaciens. A total of n=40 specimens (from the CHOICE study) were used to generate data in Fig. 2B and Fig. 2C. VEC pools generated from these specimens were also used for studies reported in Fig. 1C, 1D and Fig. 3. See methods for pooling rationale. (D) Chromatograms show probable structures (based on monosaccharide composition) of VEC N-glycans derived from one individual woman without BV (upper panel) and with BV (lower panel). Relative abundances of N-glycan groups are shown in the bar graph next to the chromatograms. A complete list of N-glycan structures and composition, with their relative abundance, for these specimens is provided in data file S2. Structures of different types of N-glycans are depicted following the NCBI Symbol Nomenclature for Glycans (yellow circle, galactose; green circle, mannose; blue square, N-acetylglucosamine; purple diamond, sialic acid; red triangle, fucose).
FIG. 3.
FIG. 3.. MALDI-TOF spectra of permethylated O-glycans present in vaginal epithelial glycocalyx of individuals with and without BV.
(A) Mass spectra shows presence of sialylated core-1 and core-2 glycans in ‘normal’ (No BV) VECs. (B) Asialoglycans dominate (ion m/z = 983) among O-glycans derived from BV specimens. (C) Pools of VECs from individuals without BV (No BV) pretreated with exogenous sialidase (AUS) show a profile similar to BV specimens. Two different pools were analyzed for each condition (n=10 specimens/pool). Structures of different types of O-glycans are depicted following the NCBI Symbol Nomenclature for Glycans (red triangle, fucose; yellow circle, galactose; blue square, N-acetylglucosamine; yellow square, N-acetylgalactosamine; purple diamond, sialic acid). Arrowheads point to assigned O-glycan peaks with highest intensity in the spectra. Data is representative of 3 independent experiments. A total of n=60 specimens were used to generate these data. VEC pools generated from these specimens were also used for studies reported in Fig. 1C, 1D, Fig. 2 and table S2. See methods for pooling rationale.
FIG. 4.
FIG. 4.. Exposed galactose on the VEC surface in BV.
(A) Schematic: PNA-Rhodamine (PNA-Rh) binds to galactose residues, not masked by sialic acids, on VECs untreated or treated with sialidase. A.u. sialidase = sialidase from Arthrobacter ureafaciens. (B) Representative confocal images of PNA (red) stained VECs are shown from n=6 individual specimens. Images in the top and bottom are from the same specimen pretreated with exogenous sialidase (+A.u. sialidase) or with buffer alone (−A.u. sialidase, untreated control). Nuclei and bacterial cells (blue) are stained with DAPI. Images shown are representative of multiple fields of view for each specimen. Scale bars = 30 μm. (C) Representative image of a BV epithelial cell with surface bacteria observed as blue puncta close to the cell membrane, indicative of clue cells. Scale bars = 10 μm. (D-E) Flow cytometry quantification of PNA binding to BV and No BV VECs pretreated with exogenous sialidase (+A.u. sialidase) or buffer alone (untreated control). (D) Representative histogram overlays are shown from n=6 individual specimens. (E) Estimation of percentage cell surface exposed galactose residues, calculated as percentage ratio of mean fluorescence intensity (MFI) of PNA binding to untreated VECs versus VECs pretreated with A.u. sialidase (n=15 samples per group). When possible, data points on the graph represent epithelial cells from individual women (n=22, black/blue circles). However, some data points represent pooled samples from 2–5 women (when recovery yielded insufficient cell quantity for flow cytometry) (N=8 pools, circles filled with red). Data in B-E is combined from 3 independent experiments. Error bars on the graph show standard deviation for each group. Statistical analysis by Mann–Whitney U, ****P<0.0001. Sensitivity and specificity values were determined using two-sided Fisher’s exact test, with a galactose exposure threshold of 60% compared to the Nugent method. A total of n=46 specimens from individual women were used to generate the data in B-E. See methods for pooling rationale.
FIG. 5.
FIG. 5.. Epithelial cells emulate BV phenotypes when treated with Gardnerella sialidases.
(A-D) Cells from the same pool of VECs, from women with or without BV, were treated with emply vector (Control), commercial Arthrobacter ureafaciens sialidase (A.u.), recombinant Gardnerella NanH2 sialidase (NanH2), or recombinant Gardnerella NanH3 sialidase (NanH3) as indicated. (A) Fluorimetric quantification of sialic acid (Neu5Ac) released from No BV VECs treated with either vector control or sialidase enzymes. (B, C) Flow cytometry analysis of PNA binding to VECs. Galactose exposure was assessed by comparing PNA binding to A.u. sialidase treated cells from the same pool. (B) Galactose exposure on No BV VECs. (C) Galactose exposure on BV VECs (N=3 pools, with n=2–3 specimens in each pool). (D) Representative confocal images of VECs from women with and without BV, stained with PNA (red) lectin under control/sialidase treated condition. Nuclei and bacterial cells (blue) are stained with DAPI. Each row shows analysis of one pooled specimen. Scale bars are 50 μm. Data in A-D combined from 2 independent experiments. For No BV groups treated with vector control, A.u. sialidase, or G.v. NanH2 sialidase - N=10 pools, with n=2 – 5 specimens in each pool; for the No BV group treated with G.v. NanH3 sialidase- N=8 pools, with n=2 – 5 specimens in each pool. **p<0.01 (Wilcoxon signed rank test). A total of n=38 specimens from individual women were used to generate the data in A-D. Data in 6A, 6B, and 6D are from the same No BV VEC pools. Data in 6C and 6D are from the same BV VEC pools. See methods for pooling rationale.
FIG. 6.
FIG. 6.. The epithelial glycocalyx appears degraded in BV and Gardnerella sialidase is sufficient to establish this phenotype.
(A to C) Representative transmission electron microscopy (TEM) images of VECs from (A) No BV specimens - glycocalyx appears as a fuzzy layer close to epithelial cell membrane (indicated with arrowheads), (B) BV specimens, and (C) No BV specimens treated with recombinant Gardnerella sialidase (NanH2). (D, E) Pooled VECs from three of the No BV specimens were divided in half; one half was untreated (D) and the other half treated with recombinant Gardnerella NanH2 (E). Abundance of the glycocalyx was scored on a 0–4 scale, where four is “abundantly present” and zero is “none visible”. A total of ten TEM images were scored from each specimen (scoring rubric in fig. S11). Data points in the graph represent the average of three scores for each image. For No BV, N=40 images from n=4 specimens (same data in shown in D and E); BV, N=30 images from n=3 specimens; and No BV treated with NanH2, N=30 images from n=3 specimens. Images were acquired in a blinded fashion and scored by three observers blinded to the BV-status of the sample. All images were acquired at 25,000 X. Scale bars are 500 nm. ****p<0.0001 (Kruskal-Wallis with Dunn’s multiple comparisons test). A total of n=7 specimens were used to generate these data.
FIG. 7.
FIG. 7.. Treatment with Gardnerella sialidase NanH2 alters transcriptomic profile of the vaginal epithelial (VK2) cells.
(A) SDS-PAGE analysis of recombinant NanH2 expression in ClearColi BL21(DE3). M: Molecular weight marker; rNanH2 (100 kDa). Schematic above the gel depict plasmids without or with truncated nanH2 gene (red) used for transformation of ClearColi cells. (B) Fluorimetric quantification of DMB-labelled sialic acid (Neu5Ac) from VK2 cells treated with vector or rNanH2. (C) Fold-change for all the genes that were significantly altered (adj. p value < 0.05), at both 1 h and 2h, is shown in the bar graph. (D-E). Genes that had altered expression in VK2 cells treated with rNanH2, as compared to the vector control, are indicated in the scatterplots with expression (log cells per million [CPM]) shown on the x-axis and log-fold-change shown on the y-axis. Here, red dots denote genes that were significantly up-regulated and blue dots denote genes that were significantly down-regulated, with adj. p value < 0.05. Schematics were created with BioRender.com.

References

    1. Callahan BJ, DiGiulio DB, Goltsman DSA, Sun CL, Costello EK, Jeganathan P, Biggio JR, Wong RJ, Druzin ML, Shaw GM, Stevenson DK, Holmes SP, Relman DA, Replication and refinement of a vaginal microbial signature of preterm birth in two racially distinct cohorts of US women. Proc Natl Acad Sci U S A 114, 9966–9971 (2017). - PMC - PubMed
    1. Hillier SL, Bernstein KT, Aral S, A Review of the Challenges and Complexities in the Diagnosis, Etiology, Epidemiology, and Pathogenesis of Pelvic Inflammatory Disease. J Infect Dis 224, S23–S28 (2021). - PMC - PubMed
    1. Witkin SS, Linhares IM, Why do lactobacilli dominate the human vaginal microbiota? BJOG 124, 606–611 (2017). - PubMed
    1. Kroon SJ, Ravel J, Huston WM, Cervicovaginal microbiota, women's health, and reproductive outcomes. Fertil Steril 110, 327–336 (2018). - PubMed
    1. Amabebe E, Anumba DOC, The Vaginal Microenvironment: The Physiologic Role of Lactobacilli. Front Med (Lausanne) 5, 181 (2018). - PMC - PubMed