. 2023 Nov 20;13(48):33887-33904.
doi: 10.1039/d3ra04398c. eCollection 2023 Nov 16.

Photodynamic toluidine blue-gold nanoconjugates as a novel therapeutic for Staphylococcal biofilms

Affiliations

Photodynamic toluidine blue-gold nanoconjugates as a novel therapeutic for Staphylococcal biofilms

Mohammad Okkeh et al. RSC Adv. .

Abstract

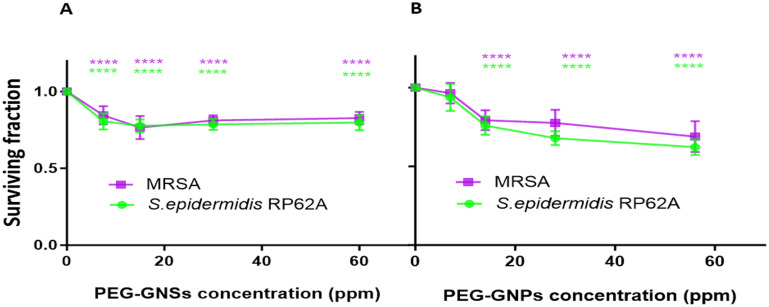
Staphylococci are among the most frequent bacteria known to cause biofilm-related infections. Pathogenic biofilms represent a global healthcare challenge due to their high tolerance to antimicrobials. In this study, water soluble polyethylene glycol (PEG)-coated gold nanospheres (28 ppm) and nanostars (15 ppm) with electrostatically adsorbed photosensitizer (PS) Toluidine Blue O (TBO) ∼4 μM were successfully synthesized and characterized as PEG-GNPs@TBO and PEG-GNSs@TBO. Both nanoconjugates and the TBO 4 μM solution showed remarkable, if similar, antimicrobial photodynamic inactivation (aPDI) effects at 638 nm, inhibiting the formation of biofilms by two Staphylococcal strains: a clinical methicillin-resistant Staphylococcus aureus (MRSA) isolate and Staphylococcus epidermidis (S. epidermidis) RP62A. Alternatively in biofilm eradication treatments, the aPDI effects of PEG-GNSs@TBO were more effective and yielded a 75% and 50% reduction in viable count of MRSA and S. epidermidis RP62A preformed biofilms, respectively and when compared with untreated samples. This reduction in viable count was even greater than that obtained through aPDI treatment using a 40 μM TBO solution. Confocal laser microscopy (CLSM) and scanning electron microscope (SEM) images of PEG-GNSs@TBO's aPDI treatments revealed significant changes in the integrity and morphology of biofilms, with fewer colony masses. The generation of reactive oxygen species (ROS) upon PEG-GNSs@TBO's aPDI treatment was detected by CLSM using a specific ROS fluorescent probe, demonstrating bright fluorescence red spots across the surfaces of the treated biofilms. Our findings shine a light on the potential synergism between gold nanoparticles (AuNPs) and photosensitizers in developing novel nanoplatforms to target Staphylococcal biofilm related infections.


Conflict of interest statement

There are no conflicts to declare.

Figures

Fig. 1
Fig. 1. PEG-GNPs@TBO and PEG-GNSs@TBO synthesis scheme. Schematic illustration for the coating process of [A] GNPs and [B] GNSs with HS-PEG-COOH, and afterwards their electrostatic conjugation with TBO molecules. Abbreviations: GNPs: gold nanospheres, GNSs: gold nanostars, TBO: toluidine blue O, HS-PEG-COOH: thiolated polyethylene glycol with carboxylic acid end moiety (schematic illustration created with https://BioRender.com).
Fig. 2
Fig. 2. Schematic illustration for the experimental setup of biofilm inhibition and eradication treatments: [I] biofilm inhibition treatments: (A) overnight bacteria culture, (B) seeding bacteria into culture plate with the addition of treatments afterwards, (C) laser irradiation, (D) incubation for 24 hours at 37 °C to induce biofilms formation, (E) crystal violet assay for biofilm formations detection, (F) reading CV absorbance values at 590 nm using the microplate reader. [II] Biofilm eradication treatments: (A) overnight bacteria culture, (B) incubation for 24 hours at 37 °C to induce biofilms formation, (C) treatments addition to the preformed biofilms, (D) laser irradiation, (E) MTT assay to detect bacterial viability after treatments, (F) reading solubilized formazan salts absorbance values at 570 nm using the microplate reader (schematic illustration created with https://BioRender.com).
Fig. 3
Fig. 3. Physicochemical characterization of GNPs and GNSs suspensions. UV-vis absorption spectra of GNPs [A] and GNSs [D]; TEM images of GNPs [B] and GNSs [E] (TEM scale bar: 200 nm); zeta-potential measurements of GNPs [C] and GNSs [F]; hydrodynamic diameter measurements of GNPs and GNSs suspensions at the pH of synthesis [G]. Data were expressed as mean ± standard deviations (n = 3). TEM images [within the black frames] represent specific sections from the same corresponding images at a larger magnification.
Fig. 4
Fig. 4. Stability evaluation of PEG-GNPs@TBO and PEG-GNSs@TBO suspensions. UV-vis absorption spectra of PEG-GNPs@TBO [A] and PEG-GNSs@TBO [B] recorded at different times as indicated. PEG-GNPs@TBO (light rose eppendorf) and PEG-GNSs@TBO (light grey eppendorf) suspensions images taken at different times as indicated [C]. Hydrodynamic diameter measurements of PEG-GNPs@TBO and PEG-GNSs@TBO recorded at different times as indicated [D].
Fig. 5
Fig. 5. Dose-dependent effects of PEG-GNPs and PEG-GNSs on Staphylococcal biofilm formations. To evaluate the intrinsic dose-dependent effect of PEG-GNPs [A and C] and PEG-GNSs [B and D] on biofilm formations by MRSA and S. epidermidis RP62A planktonic cultures, CV assay was performed. Percentage of biofilm mass formation was calculated as indicated in Materials and methods in Section 2.2.6.1. Data were expressed as mean ± standard deviations (n = 3). Test groups were compared to the untreated samples using one-way variance analysis (ANOVA), followed by Bonferroni post hoc, for multiple comparisons where: *p < 0.05, **p < 0.01, ***p < 0.001, ****p < 0.0001. [C and D] Qualitative images of bacterial biofilm biomass stained with CV after incubation with PEG-GNPs [C] and PEG-GNSs [D], compared to the control.
Fig. 6
Fig. 6. aPDI effects of PEG-GNPs@TBO and PEG-GNSs@TBO on Staphylococcal biofilm formations. To evaluate the aPDI effects exerted by PEG-GNPs@TBO, PEG-GNSs@TBO or TBO alone on biofilm formations by MRSA [A and B] and S. epidermidis RP62A [C and D] planktonic cultures, CV assay was performed. Percentage of biofilm mass formations was calculated as indicated in Materials and methods in Section 2.2.6.1. Data were expressed as mean ± standard deviations (n = 3). Test groups were compared using one-way variance analysis (ANOVA), followed by Bonferroni post hoc, for multiple comparisons where: ****p < 0.0001. SEM images of MRSA [E and F] and S. epidermidis RP62A [G and H] planktonic cultures upon PEG-GNS@TBO treatment in dark conditions and with laser exposure as indicated. SEM images [within black frames] represent specific sections from same corresponding images at a larger magnification.
Fig. 7
Fig. 7. Dose-dependent effects of PEG-GNPs and PEG-GNSs on the bacterial viability of preformed Staphylococcal biofilms. To evaluate the intrinsic dose-dependent effects of PEG-GNPs [A] and PEG-GNSs [B] on the bacterial cell viability of 24 hour preformed biofilms of MRSA and S. epidermidis RP62A, an MTT assay was performed. PEG-GNSs and PEG-GNPs were incubated with the preformed biofilms for 24 hours at 37 °C prior to conducting the MTT assay. Surviving fraction was calculated as indicated in Materials and methods in Section 2.2.6.1. Data were expressed as mean ± standard deviations (n = 3). Test groups were compared to the untreated samples using one-way variance analysis (ANOVA), followed by Bonferroni post hoc, for multiple comparisons where: ****p < 0.0001.
Fig. 8
Fig. 8. aPDI effects of PEG-GNPs@TBO or PEG-GNSs@TBO on the bacterial viability of preformed Staphylococcal biofilms. To evaluate the aPDI effect on the bacterial viability of 24 hour preformed biofilms of MRSA [A and B] and S. epidermidis RP62A [C and D] upon treatments with PEG-GNPs@TBO, PEG-GNSs@TBO or TBO alone, an MTT assay was performed. Surviving fraction was calculated as indicated in Materials and methods in Section 2.2.6.1. Data were expressed as mean ± standard deviations (n = 3). Test groups were compared using one-way variance analysis (ANOVA), followed by Bonferroni post hoc, for multiple comparisons where: *p < 0.05, ***p < 0.001, ****p < 0.0001. Live/dead 3D CLSM projections of MRSA [E and F] and S. epidermidis RP62A [G and H] preformed biofilms upon treatment with PEG-GNSs@TBO in dark conditions and with laser exposure as indicated. Live cells were stained in green by SYTO 9 and dead cells stained in red by propidium iodide PI. Scale bar: 100 μm.
Fig. 9
Fig. 9. Bacterial biofilms images after aPDI effect of PEG-GNSs@TBO. SEM images of MRSA [A and B] and S. epidermidis RP62A [C and D] preformed biofilms upon treatment with PEG-GNSs@TBO in dark conditions and with laser exposure as indicated (scale bar: 10 μm). SEM images [within black frames] represent specific sections from same corresponding images at a larger magnification. Tapping mode 2D AFM topographical images for the same samples studied: MRSA [E and F] and S. epidermidis RP62A [G and H] preformed biofilms upon PEG-GNSs@TBO treatment both in dark conditions and with laser exposure, respectively (scale bar: 2 μm).
Fig. 10
Fig. 10. Fluorescent detection of ROS formation after treatment with PEG-GNSs@TBO. CellROX® Deep Red/Hoechst 33342 stained CLSM images for the ROS detection on MRSA [A and B] and S. epidermidis RP62A [C and D] preformed biofilms upon treatment with PEG-GNSs@TBO in dark conditions and with laser exposure as indicated. Scale bar: 50 μm. CLSM images [within the yellow frames] represent a selected section from the same corresponding images at a larger magnification. Mean of fluorescence intensity [E and F], expressed as CTCF (corrected total cell fluorescence), determined for MRSA [E] and S. epidermidis RP62A [F] after laser exposure. Data were expressed as mean ± standard deviations (n = 3). Test groups were compared using Student's t-test where: **p < 0.01.

References

    1. Chadwick P. R. Revised UK guidelines for the control of methicillin-resistant Staphylococcus aureus in hospitals. Int. J. Antimicrob. Agents. 1999;11(2):89–91. doi: 10.1016/S0924-8579(98)00103-4. - DOI - PubMed
    1. Honma K. Tawara Y. Okuda K. Detection of methicillin-resistant staphylococcus aureus in human saliva and on denture surfaces. Bull. Tokyo Dent. Coll. 1994;35(4):217–220. - PubMed
    1. Deurenberg R. H. Stobberingh E. E. The evolution of Staphylococcus aureus. Infect., Genet. Evol. 2008;8(6):747–763. doi: 10.1016/J.MEEGID.2008.07.007. - DOI - PubMed
    1. Lewis P. O. Heil E. L. Covert K. L. Cluck D. B. Treatment strategies for persistent methicillin-resistant Staphylococcus aureus bacteraemia. J. Clin. Pharm. Ther. 2018;43(5):614–625. doi: 10.1111/JCPT.12743. - DOI - PubMed
    1. Rolo J. Worning P. Boye Nielsen J. et al., Evidence for the evolutionary steps leading to mecA-mediated β-lactam resistance in staphylococci. PLoS Genet. 2017;13(4):e1006674. doi: 10.1371/JOURNAL.PGEN.1006674. - DOI - PMC - PubMed