

SARS-CoV-2 testing in the Slovak Republic from March 2020 to September 2022 - summary of the pandemic trends
- PMID: 38020161
- PMCID: PMC10658709
- DOI: 10.3389/fmed.2023.1225596
SARS-CoV-2 testing in the Slovak Republic from March 2020 to September 2022 - summary of the pandemic trends
Abstract
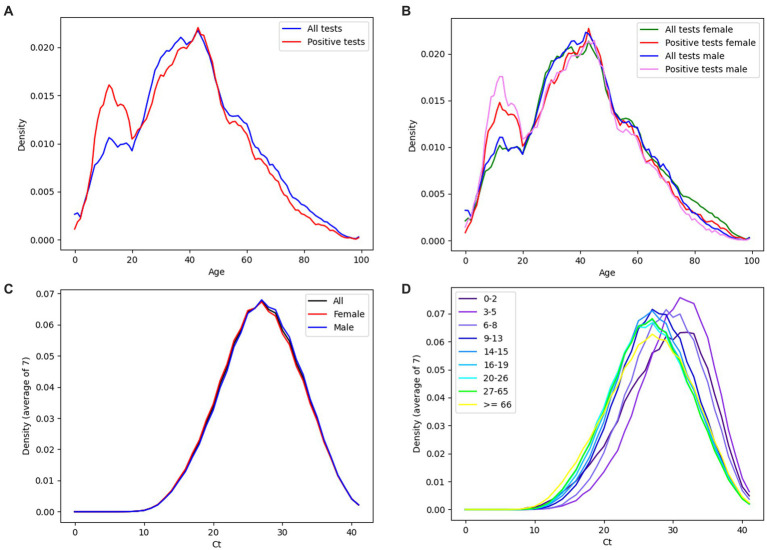
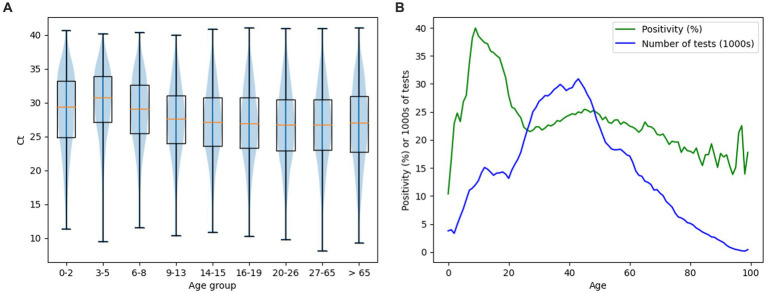
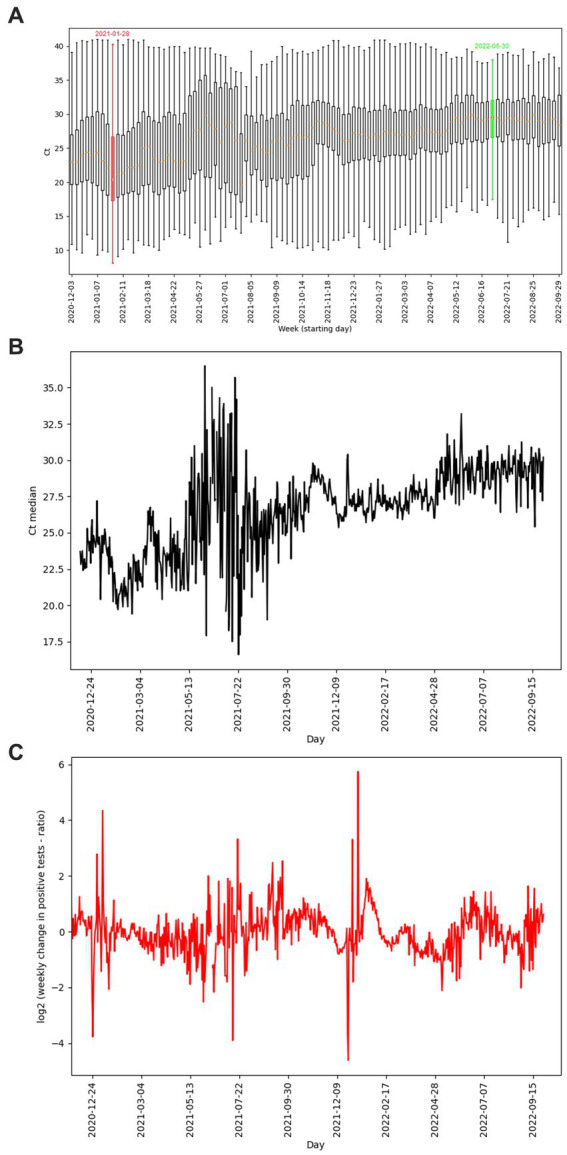
The COVID-19 pandemic has been part of Slovakia since March 2020. Intensive laboratory testing ended in October 2022, when the number of tests dropped significantly, but the state of the pandemic continues to this day. For the management of COVID-19, it is important to find an indicator that can predict pandemic changes in the community. The average daily/weekly Ct value with a certain time delay can predict changes in the number of cases of SARS-CoV-2 infection, which can be a useful indicator for the healthcare system. The study analyzed the results of 1,420,572 RT-qPCR tests provided by one accredited laboratory during the ongoing pandemic in Slovakia from March 2020 to September 2022. The total positivity of the analyzed tests was 24.64%. The average Ct values found were the highest in the age group of 3-5 years, equal to the number 30.75; the lowest were in the age group >65 years, equal to the number 27. The average weekly Ct values ranged from 22.33 (pandemic wave week) to 30.12 (summer week). We have summarized the results of SARS-CoV-2 diagnostic testing in Slovakia with the scope defined by the rate and positivity of tests carried out at Medirex a.s. laboratories.
Keywords: COVID-19; Ct value; RT-qPCR; Slovakia; age groups; pandemic; statistics.
Copyright © 2023 Janostiakova, Gnip, Kodada, Saade, Blandova, Mikova, Tibenska, Repiska and Minarik.
Conflict of interest statement
AG and GM are employed by Medirex Group Academy n.p.o., Nitra, Slovakia. EM and ET are employed by Medirex, a.s., Pezinok, Slovakia. The remaining authors declare that the research was conducted in the absence of any commercial or financial relationships that could be construed as a potential conflict of interest.
Figures
Similar articles
-
Comparison of SARS-CoV-2 Detection by Rapid Antigen and by Three Commercial RT-qPCR Tests: A Study from Martin University Hospital in Slovakia.Int J Environ Res Public Health. 2021 Jul 1;18(13):7037. doi: 10.3390/ijerph18137037. Int J Environ Res Public Health. 2021. PMID: 34280974 Free PMC article.
-
The Relationship Between Population-Level SARS-CoV-2 Cycle Threshold Values and Trend of COVID-19 Infection: Longitudinal Study.JMIR Public Health Surveill. 2022 Nov 8;8(11):e36424. doi: 10.2196/36424. JMIR Public Health Surveill. 2022. PMID: 36240022 Free PMC article.
-
Surveillance Metrics of SARS-CoV-2 Transmission in Central Asia: Longitudinal Trend Analysis.J Med Internet Res. 2021 Feb 3;23(2):e25799. doi: 10.2196/25799. J Med Internet Res. 2021. PMID: 33475513 Free PMC article.
-
Effectiveness and cost-effectiveness of four different strategies for SARS-CoV-2 surveillance in the general population (CoV-Surv Study): a structured summary of a study protocol for a cluster-randomised, two-factorial controlled trial.Trials. 2021 Jan 8;22(1):39. doi: 10.1186/s13063-020-04982-z. Trials. 2021. PMID: 33419461 Free PMC article.
-
[SARS-CoV-2 and Microbiological Diagnostic Dynamics in COVID-19 Pandemic].Mikrobiyol Bul. 2020 Jul;54(3):497-509. doi: 10.5578/mb.69839. Mikrobiyol Bul. 2020. PMID: 32755524 Review. Turkish.
Cited by
-
Coronavirus-two infection among adults: A scoping review of literature published in 2023-24.Pak J Med Sci. 2025 Jun;41(6):1788-1798. doi: 10.12669/pjms.41.6.12201. Pak J Med Sci. 2025. PMID: 40621515 Free PMC article. Review.
References
-
- Ministerstvo zdravotnictva SR . (2020) Slovensko zaznamenalo prvý potvrdený prípad ochorenia COVID-19. Available at: https://www.health.gov.sk/Clanok?koronavirus-pripad-prvy-opatrenia (Accessed November 23, 2022).
-
- Ministerstvo zdravotnictva SR . (2020) COVID-19: Zákaz návštev nemocníc, domovov sociálnych služieb. Available at: https://www.health.gov.sk/Clanok?koronavirus-krizovy-stab-opatrenia (Accessed November 23, 2022).
-
- Ministerstvo zdravotnictva SR . (2020) COVID-19: Krízový štáb zavádza prísne opatrenia, zatvárajú sa školy, letiská. Available at: https://www.health.gov.sk/Clanok?koronavirus-opatrenia-sprisnene (Accessed November 23, 2022).
-
- WHO . (2023) Statement on the fourteenth meeting of the International Health Regulations (2005) Emergency Committee regarding the coronavirus disease (COVID-19) pandemic. Available at: https://www.who.int/news/item/30-01-2023-statement-on-the-fourteenth-mee... (Accessed March 3, 2023).
-
- NCZI . (2023) Available at: https://covid-19.nczisk.sk/sk (Accessed March 7, 2023).
LinkOut - more resources
Full Text Sources
Miscellaneous