Clinical Trial
. 2023 Nov 3:36:11899.
doi: 10.3389/ti.2023.11899. eCollection 2023.

Donor-Derived Cell-Free DNA (dd-cfDNA) in Kidney Transplant Recipients With Indication Biopsy-Results of a Prospective Single-Center Trial

Affiliations
Clinical Trial

Donor-Derived Cell-Free DNA (dd-cfDNA) in Kidney Transplant Recipients With Indication Biopsy-Results of a Prospective Single-Center Trial

Louise Benning et al. Transpl Int. .

Abstract

Donor-derived cell-free DNA (dd-cfDNA) identifies allograft injury and discriminates active rejection from no rejection. In this prospective study, 106 kidney transplant recipients with 108 clinically indicated biopsies were enrolled at Heidelberg University Hospital between November 2020 and December 2022 to validate the clinical value of dd-cfDNA in a cohort of German patients. dd-cfDNA was quantified at biopsy and correlated to histopathology. Additionally, dd-cfDNA was determined on days 7, 30, and 90 post-biopsy and analyzed for potential use to monitor response to anti-rejection treatment. dd-cfDNA levels were with a median (IQR) % of 2.00 (0.48-3.20) highest in patients with ABMR, followed by 0.92 (0.19-11.25) in patients with TCMR, 0.44 (0.20-1.10) in patients with borderline changes and 0.20 (0.11-0.53) in patients with no signs of rejection. The AUC for dd-cfDNA to discriminate any type of rejection including borderline changes from no rejection was at 0.72 (95% CI 0.62-0.83). In patients receiving anti-rejection treatment, dd-cfDNA levels significantly decreased during the 7, 30, and 90 days follow-up compared to levels at the time of biopsy (p = 0.006, p = 0.002, and p < 0.001, respectively). In conclusion, dd-cfDNA significantly discriminates active rejection from no rejection. Decreasing dd-cfDNA following anti-rejection treatment may indicate response to therapy. Clinical Trial Registration: https://drks.de/search/de/trial/DRKS00023604, identifier DRKS00023604.

Keywords: dd-cfDNA; donor-derived cell-free DNA; kidney transplantation; rejection; response to therapy.


Conflict of interest statement

This study received funding from CareDx Inc. (Brisbane, CA). The funder had the following involvement with the study: funding for kits and supplies for dd-cfDNA testing.

Figures

FIGURE 1
FIGURE 1
Study design to evaluate the diagnostic potential of donor-derived cell-free DNA (dd-cfDNA) in kidney transplant recipients with indication biopsy. (A) Donor-derived cell-free DNA, donor-specific HLA antibodies (DSA) and non-HLA antibodies were determined on the day of biopsy as well as 7, 30 and 90 days post-biopsy. Clinical follow-up was at 180 days post-biopsy. (B) Of the 108 allograft biopsies, 36 (33%) were classified as different types of rejection, whereof 7 biopsies were graded as ABMR, 6 as TCMR, and 23 as borderline changes. The 72 biopsies with no signs of rejection were graded either as interstitial fibrosis and tubular atrophy (IFTA, N = 29), polyomavirus nephropathy (BKVAN, N = 13), normal/unspecific (N = 8), or with other changes (N = 22). Other changes (*) included acute tubular injury (ATI, N = 8), recurrent disease (N = 4), infection (N = 1), CNI toxicity (N = 1), or IFTA with signs of CNI toxicity (N = 8). ABMR, antibody-mediated rejection; BKVAN, BK virus-associated nephropathy; CNI, calcineurin-inhibitor; IFTA, interstitial fibrosis and tubular atrophy; KTR, kidney transplant recipients; N, number; T, time point; TCMR, T cell-mediated rejection.
FIGURE 2
FIGURE 2
Heat map of histopathological lesion scores according to the BANFF classification and the polyomavirus-associated interstitial nephritis score as well as donor-derived cell-free DNA levels and the presence of donor-specific and non-HLA antibodies for 108 kidney allograft biopsies. The 108 allograft biopsies are grouped according to histopathological diagnosis. Color-coding indicates BANFF lesion scores and dd-cfDNA levels. The presence of donor-specific antibodies with a mean fluorescence intensity of >500 and >1,000, as well as the presence of any non-HLA antibodies is indicated in purple. ABMR, antibody-mediated rejection; ah, hyaline arteriolar thickening; ATI, acute tubular injury; BKVAN, BK virus-associated nephropathy; cg, glomerular basement membrane double contours; ci, interstitial fibrosis; CNI, calcineurin-inhibitor toxicity; ct, tubular atrophy; cv, vascular fibrous intimal thickening; dd-cfDNA, donor-derived cell-free DNA; DSA, donor-specific antibodies; g, glomerulitis; i, interstitial inflammation; IFTA, interstitial fibrosis and tubular atrophy; mm, mesangial matrix thickening; non-HLA AB, non-HLA antibodies (angiotensin II type 1 receptor/endothelin receptor subtype A/major histocompatibility complex class I-related chain A); ptc, peritubular capillaritis; PVI, polyomavirus-associated interstitial nephritis score; t, tubulitis; v, intimal arteritis; TCMR, T cell-mediated rejection; i-IFTA, inflammation in the area of IFTA. (*) Two biopsies showed mixed rejection with concomitant borderline lesions and were categorized as ABMR due to low numbers of mixed rejections. (**) Based on clinical judgement, this biopsy was categorized as borderline changes, despite the presence of glomerulitis, peritubular capillaritis, C4d deposition, and low-level DSA (MFI 505). Of note, the biopsy was conducted 14 days after a living kidney donation, DSA were not detected subsequently and eGFR as well as dd-cfDNA improved upon sole corticosteroid treatment.
FIGURE 3
FIGURE 3
Donor-derived cell-free DNA (dd-cfDNA) and estimated glomerular filtration rate at time of biopsy. (A) Donor-derived cell-free DNA was highest in patients with antibody-mediated rejection, compared to patients with T cell-mediated rejection, borderline changes, and patients with no histopathological signs of rejection. The x-axis displays the respective group, dd-cfDNA levels are shown log-transformed on the y-axis. Box plots display the distribution of data, with a horizontal line denoting the median. The bottom and top edges of the box indicate the 25th and 75th percentiles respectively. Individual results are shown as dots. The red dotted line indicates a dd-cfDNA level of 1%, whereas the green dotted line indicates a dd-cfDNA level of 0.5%, corresponding to different cut-points defined in other studies investigating dd-cfDNA as a biomarker for allograft injury. Below the level of 0.5%, the risk of rejection is low. (B) Estimated glomerular filtration rate at time of biopsy did not differ significantly between patients with any type of rejection and no rejection. The x-axis displays the respective group, eGFR is shown on the y-axis. Box plots display the distribution of data, with a horizontal line denoting the median. The bottom and top edges of the box indicate the 25th and 75th percentiles respectively. Individual results are shown as dots. ABMR, antibody-mediated rejection; dd-cfDNA, donor-derived cell-free DNA; eGFR, estimated glomerular filtration rate; N, number; TCMR, T cell-mediated rejection; ***p < 0.001; *p < 0.05.
FIGURE 4
FIGURE 4
ROC Curves for donor-derived cell-free DNA and estimated glomerular filtration rate to discriminate different types of rejection from no rejection at time of biopsy. ROC curves to discriminate (A) any type of rejection, including borderline changes, (B) antibody-mediated rejection, (C) T cell-mediated rejection, and (D) borderline changes from no rejection.100%-specificity in % is displayed on the x-axis, sensitivity in % on the y-axis. dd-cfDNA is plotted in red, whereas the ROC curve for eGFR is plotted in blue for all ROC curves. Respective AUC and 95% CI is given in red for dd-cfDNA and in blue for eGFR at the bottom of each graph. ABMR, antibody-mediated rejection; AUC, area under the curve; CI, confidence interval; dd-cfDNA, donor-derived cell-free DNA; eGFR, estimated glomerular filtration rate; ROC, receiver operating characteristics; TCMR, T cell-mediated rejection.
FIGURE 5
FIGURE 5
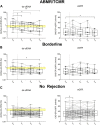
Longitudinal changes in donor-derived cell-free DNA and estimated glomerular filtration rate. (A) In patients with antibody-mediated or T cell-mediated rejection (N = 13), donor-derived cell-free DNA (dd-cfDNA) decreased comparing levels from time at biopsy (T0) to 7 days (T1), 30 days (T2) and 90 days (T3) post-biopsy. Estimated glomerular filtration rate (eGFR) remained largely unchanged. (B) For patients with borderline changes who received corticosteroid pulse therapy (N = 19), dd-cfDNA decreased significantly comparing levels at time of biopsy (T0) to levels 90 days post-biopsy (T3), whereas no significant differences were seen in eGFR when comparing values obtained at 7 (T1), 30 (T2), 90 (T3), and 180 days (T4) follow-up to eGFR at biopsy (T0). (C) No significant differences in dd-cfDNA levels were observed in patients with no histopathological signs of rejection (N = 72), whereas eGFR improved slightly in these patients comparing eGFR at biopsy (T0) to levels at 7 days post-biopsy (T1). The x-axis displays the respective time point, dd-cfDNA levels are shown log-transformed and eGFR is displayed linearly on the y-axis. Box plots display the distribution of data, with a horizontal line denoting the median. The bottom and top edges of the box indicate the 25th and 75th percentiles, respectively. Individual results are shown as dots. The red dotted line indicates a dd-cfDNA level of 1%, whereas the green dotted line indicates a dd-cfDNA level of 0.5%, corresponding to different cut-points defined in other studies investigating dd-cfDNA as a biomarker for allograft injury. Below the dd-cfDNA level of 0.5%, the risk of rejection is low. ABMR, antibody-mediated rejection; dd-cfDNA, donor-derived cell-free DNA; CKD-EPI eGFR, Chronic Kidney Disease Epidemiology Collaboration estimated glomerular filtration rate; TCMR, T cell-mediated rejection. **p < 0.01; *p < 0.05.

Comment in

References

    1. Meier-Kriesche H, Schold JD, Srinivas TR, Kaplan B. Lack of Improvement in Renal Allograft Survival Despite a Marked Decrease in Acute Rejection Rates Over the Most Recent Era. Am J Transpl (2004a) 4:378–83. 10.1111/j.1600-6143.2004.00332.x - DOI - PubMed
    1. Meier-Kriesche H, Schold JD, Kaplan B. Long-Term Renal Allograft Survival: Have We Made Significant Progress or Is It Time to Rethink Our Analytic and Therapeutic Strategies? Am J Transpl (2004b) 4:1289–95. 10.1111/j.1600-6143.2004.00515.x - DOI - PubMed
    1. Lamb KE, Lodhi S, Meier-Kriesche H-U. Long-Term Renal Allograft Survival in the United States: A Critical Reappraisal. Am J Transpl (2011) 11:450–62. 10.1111/j.1600-6143.2010.03283.x - DOI - PubMed
    1. Coemans M, Süsal C, Döhler B, Anglicheau D, Giral M, Bestard O, et al. Analyses of the Short- and Long-Term Graft Survival After Kidney Transplantation in Europe Between 1986 and 2015. Kidney Int (2018) 94:964–73. 10.1016/j.kint.2018.05.018 - DOI - PubMed
    1. Madden RL, Mulhern JG, Benedetto BJ, O’Shea MH, Germain MJ, Braden GL, et al. Completely Reversed Acute Rejection Is Not a Significant Risk Factor for the Development of Chronic Rejection in Renal Allograft Recipients. Transpl Int (2000) 13:344–50. 10.1007/s001470050712 - DOI - PubMed

Publication types

Substances