. 2023 Oct 31:11:1144936.
doi: 10.3389/fcell.2023.1144936. eCollection 2023.

Kinetic modelling of sterol transport between plasma membrane and endo-lysosomes based on quantitative fluorescence and X-ray imaging data

Affiliations

Kinetic modelling of sterol transport between plasma membrane and endo-lysosomes based on quantitative fluorescence and X-ray imaging data

Daniel Wüstner et al. Front Cell Dev Biol. .

Abstract

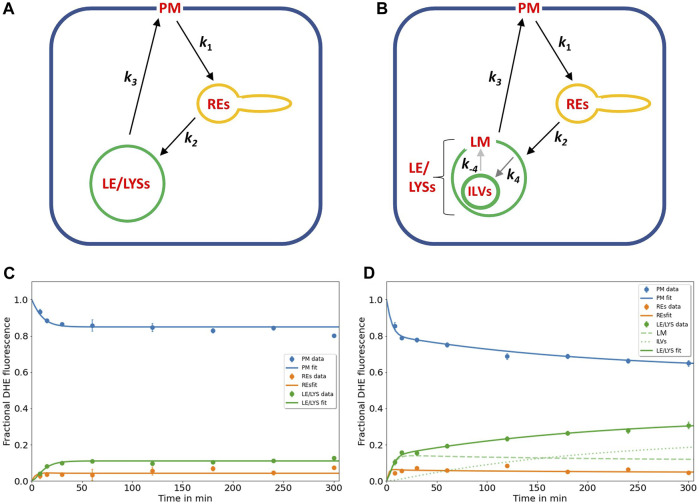
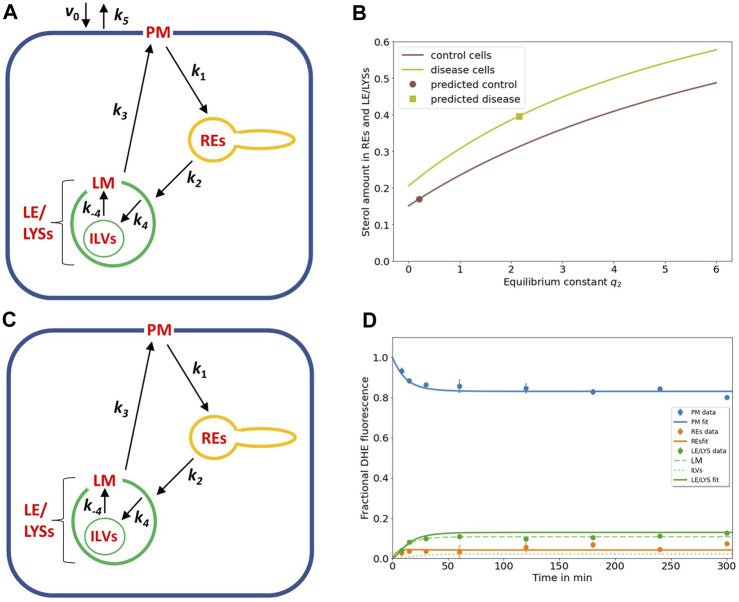
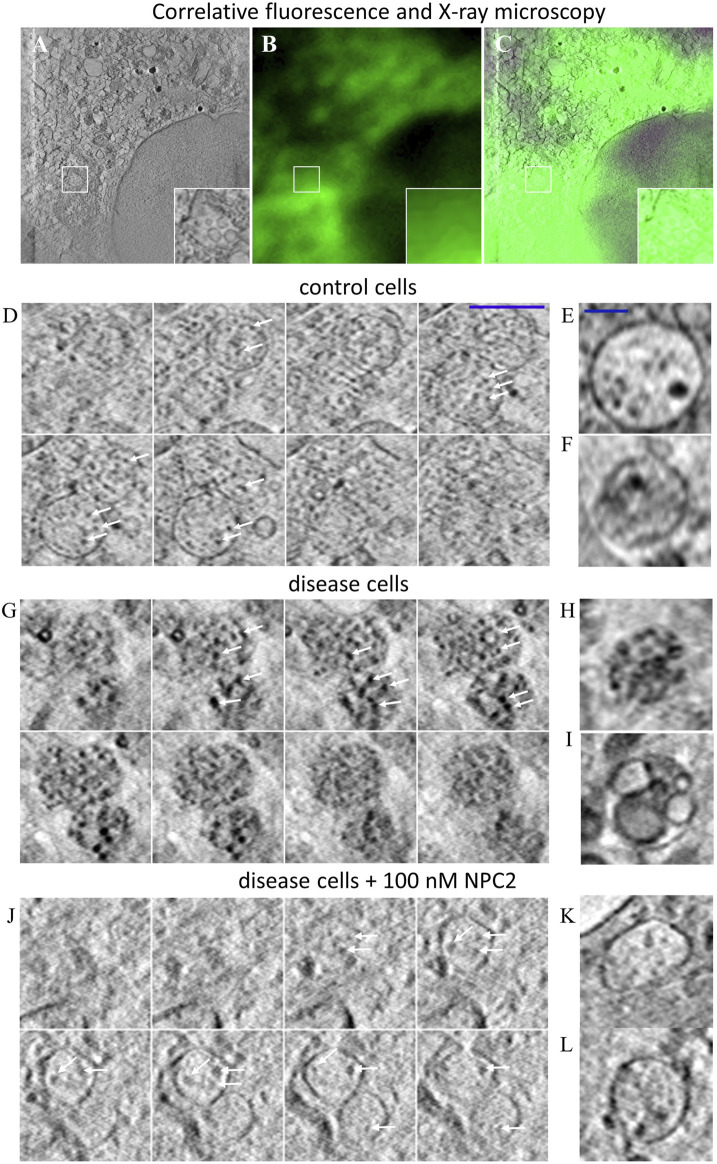
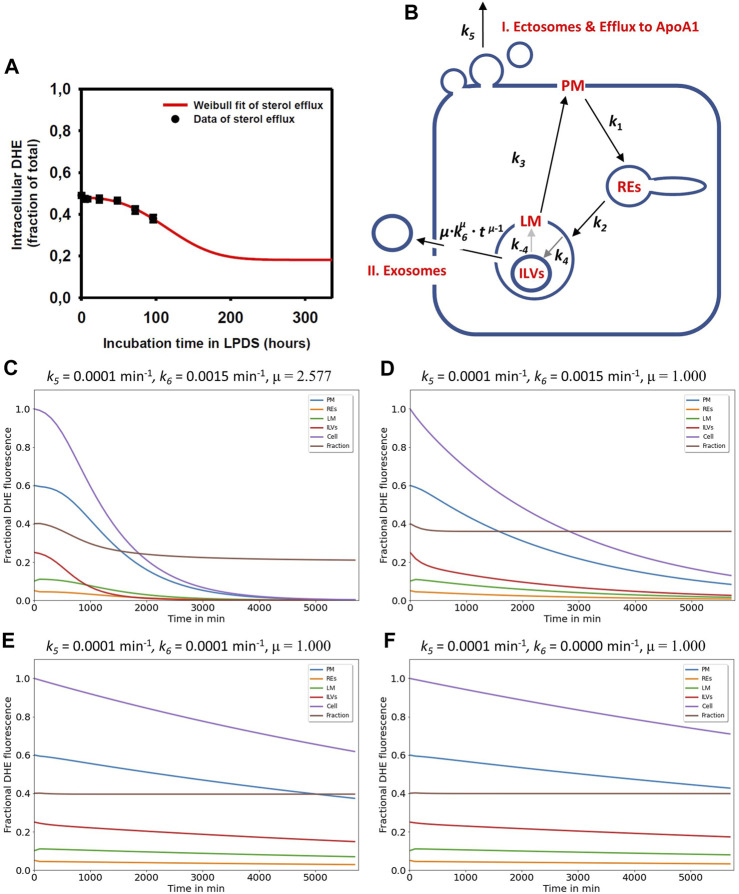
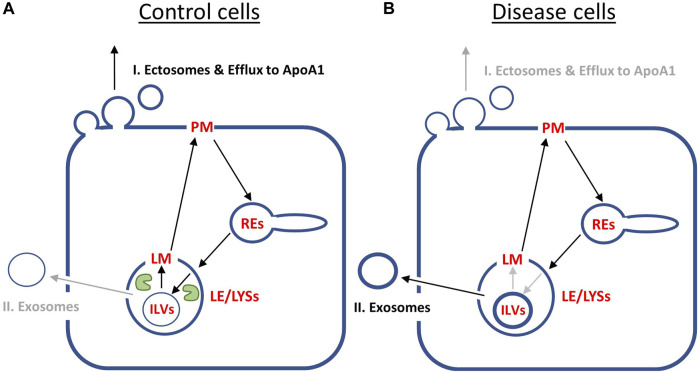
Niemann Pick type C1 and C2 (NPC1 and NPC2) are two sterol-binding proteins which, together, orchestrate cholesterol transport through late endosomes and lysosomes (LE/LYSs). NPC2 can facilitate sterol exchange between model membranes severalfold, but how this is connected to its function in cells is poorly understood. Using fluorescent analogs of cholesterol and quantitative fluorescence microscopy, we have recently measured the transport kinetics of sterol between plasma membrane (PM), recycling endosomes (REs) and LE/LYSs in control and NPC2 deficient fibroblasts. Here, we use kinetic modeling of this data to determine rate constants for sterol transport between intracellular compartments. Our model predicts that sterol is trapped in intraluminal vesicles (ILVs) of LE/LYSs in the absence of NPC2, causing delayed sterol export from LE/LYSs in NPC2 deficient fibroblasts. Using soft X-ray tomography, we confirm, that LE/LYSs of NPC2 deficient cells but not of control cells contain enlarged, carbon-rich intraluminal vesicular structures, supporting our model prediction of lipid accumulation in ILVs. By including sterol export via exocytosis of ILVs as exosomes and by release of vesicles-ectosomes-from the PM, we can reconcile measured sterol efflux kinetics and show that both pathways can be reciprocally regulated by the intraluminal sterol transfer activity of NPC2 inside LE/LYSs. Our results thereby connect the in vitro function of NPC2 as sterol transfer protein between membranes with its in vivo function.

Keywords: Niemann-Pick disease type C2; X-ray microscopy; cholesterol efflux; differential equations; diffusion; kinetic modelling; sterol; time-delay.


Conflict of interest statement

The authors declare that the research was conducted in the absence of any commercial or financial relationships that could be construed as a potential conflict of interest.

Figures

FIGURE 1
FIGURE 1
Kinetic modelling of sterol circulation between plasma membrane and LE/LYSs. (A), sketch of the model describing sterol transport in control cells with sterol circulation between plasma membrane (PM; compartment 1), the recycling endosomes (REs; compartment 2) and late endosomes/lysosomes (LE/LYSs; compartment 3). The compartments are connected as indicated by the arrows, and sterol transport between them is parametrized by the given rate constants. (B), to model the pulse-chase data for disease cells, the LE/LYSs must be subdivided into the lysosomal-membrane (LM, compartment 3) and intraluminal vesicles (ILVs, compartment 4), as otherwise the bi-phasic sterol accumulation in LE/LYSs cannot be explained, (B). Sterol exchange between the third and fourth compartment is bi-directional (with rate constants k 4 and k -4, respectively), but experimentally, we can only assess the sum of both compartments as LE/LYSs. In disease fibroblasts, the bidirectional exchange between limiting membrane and internal vesicles of LE/LYSs is assumed to be very slow due to lack of a functional NPC2 protein (grey arrows between LM and ILVs in B). C, D, fitting of the models to the experimental time courses of DHE transport in control cells (C) and disease cells (D), respectively. The data was generated in our previous publication (Berzina et al., 2018). Results are shown for DHE in the PM (blue symbols, data; blue line, fit), for REs (orange symbols data; orange line, fit) and for LE/LYSs (green symbols, data; green straight line fit). For disease cells, LE/LYSs are modelled as sub-compartmentalized into limiting membrane (LM, compartment 3; green dashed line in D and thin green line in B) and ILVs (green dotted line in D and thick green line in B). See text for further information and Table 1 for derived parameters.
FIGURE 2
FIGURE 2
NPC2-mediated sterol transfer between ILVs and limiting membrane of endo-lysosomes determines the extent of intracellular sterol accumulation. (A), extension of the kinetic model by including sterol influx with constant rate v0 and efflux from the PM with rate constant k5 allows for a steady state analysis (see text and Eqs S1–S4). (B), the sterol fraction in REs and LE/LYSs relative to total cellular sterol was calculated according to Eq. S4 and is plotted as function of the equilibrium constant between ILVs and the endo-lysosomal membrane (i.e., q2 = k4/k-4) for control cells (brown line) and NPC2-deficient cells (light green line), respectively. The calculated sterol fraction for the value of q 2 obtained by comparing the model with the experiments is indicated by a brown circle for control cells and a light green square for disease cells, respectively. (C,D), the full model with sub-compartmentalized LE/LYSs was applied to the data of control cells, assuming that sterol exchange between ILVs (A, C, thin green lines) and the limiting membrane of endo-lysosomes is restored in the presence of NPC2 (A, C, thick green lines, and black arrows inside green LEL/LYSs with rate constants k 4 and k -4). (D), experimental data for intensity of DHE in control fibroblasts (symbols) is compared to the simulated full model with estimated parameter values for rate constants k 1 to k 3 (see Table 1) and inferred rate constants k 4 = 0.01686 min-1 and k -4 = 0.0843 min-1 corresponding to a ratio of q 2 = k 4/k -4 = 0.2 for the sterol fraction. For these conditions, most sterol in LE/LYSs would reside in the limiting membrane (LM, dashed green line) and much less in ILVs (dotted green line) compared to disease cells (see Figure 1D). See text for further information.
FIGURE 3
FIGURE 3
Correlative fluorescence and X-ray microscopy reveal enlarged and lipid-rich intraluminal vesicles in NPC2-deficient fibroblasts. Human fibroblasts were labeled with the cholesterol analogue TopFluor-cholesterol, cryo-frozen and imaged by soft X-ray tomography at the Synchrotron BESSY II as described in Materials and methods. (A–C), correlative X-ray and fluorescence imaging of an NPC-deficient fibroblast showing the sum projection of five central image planes from a reconstructed X-ray tomogram (A, inset shows zoomed box with an endo-lysosome containing ILVs), the corresponding fluorescence image of TopFluor-cholesterol (B) and the overlay (C). (D–L), montage of X-ray reconstructions of multivesicular LE/LYSs with luminal content in control cells (D–F), and NPC2-deficient cells (G–L), either left untreated (G–I) or treated with 100 nM NPC2 for 48 h (J–L). Shown are sum projections of three consecutive frames corresponding to a depth of field of 58.8 nm calculated along a 3D stack reconstructed from each X-ray tomogram. Arrows point to ILVs, which are small and almost transparent in control cells but larger and dark in disease cells due to enrichment of carbon in lipid depositions. Treatment with purified NPC2 reduces dark luminal content of endo-lysosomes, indicating removal of the lipid deposits. Small panel to the right show additional examples of multivesicular LE/LYSs of control cells (E,F), untreated disease cells (H,I) and disease cells treated with NPC2 (K,L). See main text for more information.
FIGURE 4
FIGURE 4
Simulation of cholesterol efflux via two pathways reconciles measured efflux kinetics in NPC2-deficient cells. (A), the measured efflux kinetics of DHE from human fibroblasts lacking functional NPC2 is expressed as fractional intracellular intensity (black symbols) and reproduced from Figure 1 of (Juhl et al., 2021b) with permission. The data is fit to a Weibull survival function (red line) allowing for extrapolation of the efflux kinetics beyond the measured 96 h. (B), the efflux model is based on the full compartment model and includes additionally sterol efflux from the PM via release of ectosomes and efflux to ApoA1 (I.) as well as sterol efflux directly from LE/LYSs via release of ILVs as exosomes (II.). (C–F), simulation of cholesterol efflux from disease cells for different parameter combinations for sterol efflux, i.e., rate constants k5 and k6 and the shape parameter μ were varied, while rate constants k1 to k-4 were fixed to the values determined for NPC2-deficient cells (see Table 1). Simulated time courses are shown for PM (blue lines), REs (orange lines), the limiting membrane of endo-lysosomes (green lines, ‘LE/LYS’), the ILVs (red lines) and the total cell (violet lines). In addition, the entire intracellular sterol pool (i.e., sum of REs, LM and ILVs) was calculated and normalized to the total cellular pool (brown lines). This calculated intracellular sterol fraction can be directly compared to the experimentally determined fractional DHE intensity in cells (compare panel A with brown lines in panels (C–F). Clearly, the efflux parameter combinations derived for disease cells and shown in panel (C) fit the data best. See main text for further explanations.
FIGURE 5
FIGURE 5
Simulation of cholesterol efflux from control and disease cells predicts reciprocal regulation of the two identified pathways by NPC2. Simulation of cholesterol efflux from disease cells (straight lines) or control cells (dashed lines), either with initial sterol amounts in each compartment as found in disease cells (A, B) or as found in disease and control cells, respectively (C, D). Rate constants k6 and the shape parameter μ were kept constant at k 6 = 0.0015 min-1 and µ = 2.57, while rate constants k1 to k-4 were fixed to the values determined for NPC2-deficient cells (straight lines and Table 1) or to the values inferred for control cells (dashed lines and Table 1). In the latter case, the rate constants k4 to k-4 were set to two- and either four- or tenfold the value estimated for k4 in disease cells, to obtain either q2 = 0.5 or 0.2 for control cells. This simulates the more efficient transport of sterol from ILVs back to the limiting membrane of LE/LYSs in the presence of NPC2 and is indicated in the panels. Rate constant k5, which describes sterol release from the PM, was varied as described on the top of each panel. Simulated time courses are shown for PM (blue lines), REs (orange lines), the limiting membrane of endo-lysosomes (green lines, ‘LE/LYS’), the ILVs (red lines) and the total cell (violet lines). Also, the entire intracellular sterol pool (i.e., sum of REs, LM and ILVs) was calculated and normalized to the total cellular pool (brown lines). One finds that total sterol drops faster in disease than in control cells, if the rate constant for sterol efflux from the PM, k 5, is low (C, straight and dashed violet lines). Also, for control and disease cells increasing k 5 ten-fold accelerates the drop in total and PM sterol, but it does not change the intracellular sterol fraction (compare C and D; brown dashed and straight lines). See main text for further explanations.
FIGURE 6
FIGURE 6
Summary of model predictions on reciprocal regulation of cholesterol efflux pathways by NPC2 activity inside endo-lysosomes. (A), in control cells, NPC2 protein inside LE/LYSs (green ‘pac man’) mediates efficient cholesterol transfer from ILVs to the limiting membrane (LM) of endo-lysosomes. This allows for preferred shuttling of sterol back to the PM for efflux via pathway I., i.e., sterol release from the PM as ectosomes and/or by efflux to ApoA1. Therefore, the cholesterol content of ILVs is low (thin blue ring inside LE/LYSs in A), and only little sterol will efflux via pathway II, i.e., lysosomal exocytosis and release of exosomes. (B), in disease fibroblasts, the lack of NPC2 results in slow and inefficient cholesterol transfer between ILVs and LM of LE/LYSs. As a consequence, cholesterol build’s up in ILVs (thick blue ring inside LE/LYSs in B). This results in preferred cholesterol efflux via pathway II, i.e., secretion of exosomes, which are nothing but transformed ILVs released from cells. See text for further explanations.

Similar articles

References

    1. Abdul-Hammed M., Breiden B., Adebayo M. A., Babalola J. O., Schwarzmann G., Sandhoff K. (2010). Role of endosomal membrane lipids and NPC2 in cholesterol transfer and membrane fusion. J. Lipid Res. 51, 1747–1760. 10.1194/jlr.M003822 - DOI - PMC - PubMed
    1. Agulleiro J. I., Fernandez J. J. (2015). Tomo3D 2.0--exploitation of advanced vector extensions (AVX) for 3D reconstruction. J. Struct. Biol. 189, 147–152. 10.1016/j.jsb.2014.11.009 - DOI - PubMed
    1. Appelqvist H., Nilsson C., Garner B., Brown A. J., Kagedal K., Ollinger K. (2011). Attenuation of the lysosomal death pathway by lysosomal cholesterol accumulation. Am. J. Pathol. 178, 629–639. 10.1016/j.ajpath.2010.10.030 - DOI - PMC - PubMed
    1. Appelqvist H., Waster P., Kagedal K., Ollinger K. (2013). The lysosome: from waste bag to potential therapeutic target. J. Mol. Cell Biol. 5, 214–226. 10.1093/jmcb/mjt022 - DOI - PubMed
    1. Babalola J. O., Wendeler M., Breiden B., Arenz C., Schwarzmann G., Locatelli-Hoops S., et al. (2007). Development of an assay for the intermembrane transfer of cholesterol by Niemann-Pick C2 protein. Biol. Chem. 388, 617–626. 10.1515/BC.2007.063 - DOI - PubMed