. 2023 Oct 13;14(11):5749-5763.
doi: 10.1364/BOE.502022. eCollection 2023 Nov 1.

Time domain diffuse Raman spectroscopy using single pixel detection

Affiliations

Time domain diffuse Raman spectroscopy using single pixel detection

Alessandro Bossi et al. Biomed Opt Express. .

Abstract

Diffuse Raman spectroscopy (DIRS) extends the high chemical specificity of Raman scattering to in-depth investigation of thick biological tissues. We present here a novel approach for time-domain diffuse Raman spectroscopy (TD-DIRS) based on a single-pixel detector and a digital micromirror device (DMD) within an imaging spectrometer for wavelength encoding. This overcomes the intrinsic complexity and high cost of detection arrays with ps-resolving time capability. Unlike spatially offset Raman spectroscopy (SORS) or frequency offset Raman spectroscopy (FORS), TD-DIRS exploits the time-of-flight distribution of photons to probe the depth of the Raman signal at a single wavelength with a single source-detector separation. We validated the system using a bilayer tissue-bone mimicking phantom composed of a 1 cm thick slab of silicone overlaying a calcium carbonate specimen and demonstrated a high differentiation of the two Raman signals. We reconstructed the Raman spectra of the two layers, offering the potential for improved and quantitative material analysis. Using a bilayer phantom made of porcine muscle and calcium carbonate, we proved that our system can retrieve Raman peaks even in the presence of autofluorescence typical of biomedical tissues. Overall, our novel TD-DIRS setup proposes a cost-effective and high-performance approach for in-depth Raman spectroscopy in diffusive media.


Conflict of interest statement

The authors declare no potential conflicts of interest.

Figures

Fig. 1.
Fig. 1.
Schematic representations of the measurement setup. The top panel illustrates the configuration of the measurement setup, highlighting all key components and connections. Probe lenses: LP1 f = 100 mm, LP2 f = 20 mm, LP3 f = 25 mm and LP4 f = 36 mm. The bottom panel focuses specifically on the spectrometer setup, providing a detailed depiction of its components and arrangement. TCSPC, Time Correlated Single Photon counting. Spectrometer lenses, LS1 f = 100 mm, LS2 f = 100 mm, LS3 f = 100 mm and LS4 f = 50 mm.
Fig. 2.
Fig. 2.
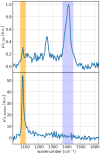
Temporal (left) and spectral (right) resolution analysis of the time-domain diffuse Raman spectrometer, utilizing an excitation wavelength of 852 nm. The measured temporal FWHM is 280 ps, while the spectral FWHM is 11 cm1 .
Fig. 3.
Fig. 3.
Reference spectra of calcium carbonate (right) and PDMS (left). The Raman spectrum was obtained using a confocal microscope (X73, Olympus Europa SE & Co. KG, Hamburg, Germany) equipped with an excitation wavelength of 660 nm and the collected light coupled to a spectrometer (Isoplane160, Princeton Instruments, Trenton, NJ, USA) with a 600 lines/mm grating and a CCD sensor(PIXIS256F, Princeton Instruments, Trenton, NJ, USA).
Fig. 4.
Fig. 4.
Comparison of Raman spectra obtained using the monochromator mode (left) and Hadamard mode (right), employing identical integration times. Notably, the Hadamard mode exhibits significantly reduced noise levels compared to the traditional monochromator approach, enhancing the overall data quality.
Fig. 5.
Fig. 5.
Temporal evolution of Raman spectra of the PDMS-calcite phantom. The left panel illustrates the evolution using a colormap, while the right panel displays the spectra at different time-gates. The Raman signal of calcium carbonate (orange) at 1086 cm1 arrives later than the PDMS signal (blue) at 1411 cm1 , indicating a delayed response of the calcium carbonate component.
Fig. 6.
Fig. 6.
The left panel presents the temporal evolution of the Raman signal for both the top layer (PDMS) and bottom layer (calcium carbonate). The Raman photons originating from the bottom layer exhibit a noticeable delay compared to those from the top layer due to the additional travel path through the first layer. On the right, the calculated enhancement factor is depicted, showcasing a smooth profile until 1 ns and subsequently displaying increased noise at later times due to the extremely low photon counts from the top layer.
Fig. 7.
Fig. 7.
Temporal evolution of Raman spectra of the porcine loin-calcite phantom. The left panel illustrates the evolution using a colormap, while the right panel displays the spectra at different time-gates. The Raman signal of calcium carbonate (orange) at 1086 cm1 is barely visible because of autofluorescence over the whole spectral range. Only in late time gates we can distinguish the peak from the background.
Fig. 8.
Fig. 8.
Reconstruction of the relative Raman scattering coefficient for the two layers, with the intensity normalized to the maximum value of the top layer.

References

    1. Mosca S., Dey P., Salimi M., Gardner B., Palombo F., Stone N., Matousek P., “Spatially Offset Raman Spectroscopy - How Deep?” Anal. Chem. 93(17), 6755–6762 (2021).10.1021/acs.analchem.1c00490 - DOI - PubMed
    1. Stone N., Baker R., Rogers K., Parker A. W., Matousek P., “Subsurface probing of calcifications with spatially offset Raman spectroscopy (SORS): Future possibilities for the diagnosis of breast cancer,” Analyst 132(9), 899–905 (2007).10.1039/b705029a - DOI - PubMed
    1. Stone N., Matousek P., “Advanced transmission Raman spectroscopy: A promising tool for breast disease diagnosis,” Cancer Res. 68(11), 4424–4430 (2008).10.1158/0008-5472.CAN-07-6557 - DOI - PubMed
    1. Dooley M., McLaren J., Rose F. R., Notingher I., “Investigating the feasibility of spatially offset Raman spectroscopy for in-vivo monitoring of bone healing in rat calvarial defect models,” J. Biophotonics 13(10), e202000190 (2020).10.1002/jbio.202000190 - DOI - PubMed
    1. Conti C., Botteon A., Colombo C., Pinna D., Realini M., Matousek P., “Advances in Raman spectroscopy for the non-destructive subsurface analysis of artworks: Micro-SORS,” (2020).

LinkOut - more resources