

Application of a new multi-locus variable number tandem repeat analysis (MLVA) scheme for the seasonal investigation of Cryptosporidium parvum cases in Wales and the northwest of England, spring 2022
- PMID: 38021189
- PMCID: PMC10665698
- DOI: 10.1016/j.crpvbd.2023.100151
Application of a new multi-locus variable number tandem repeat analysis (MLVA) scheme for the seasonal investigation of Cryptosporidium parvum cases in Wales and the northwest of England, spring 2022
Abstract
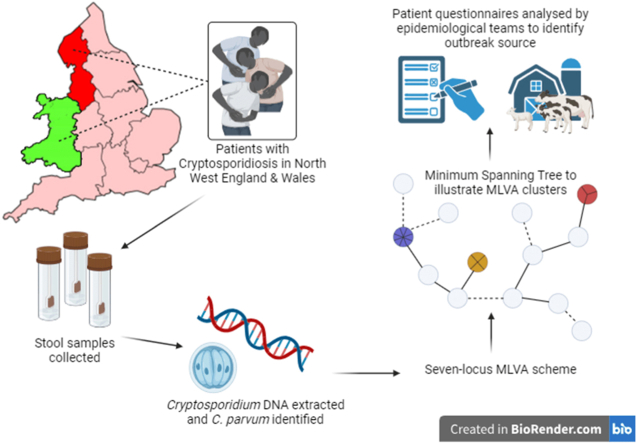
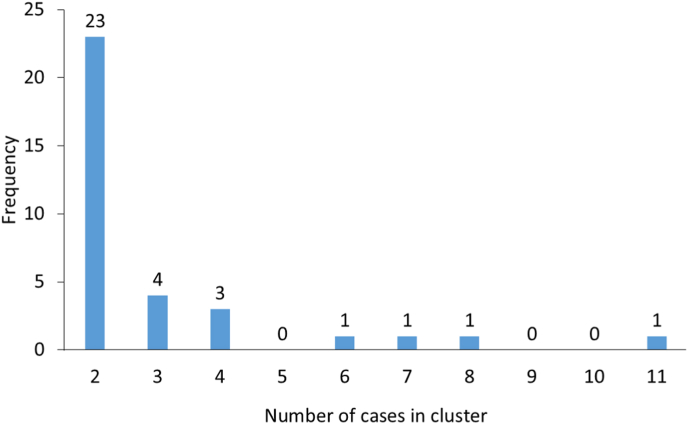
The protozoan Cryptosporidium parvum is an important cause of gastroenteritis in humans and livestock, and cryptosporidiosis outbreaks are common. However, a multi-locus genotyping scheme is not widely adopted. We describe the further development and application of a seven-locus multi-locus variable number of tandem repeats analysis (MLVA) scheme. From 28th March to 31st July 2022, confirmed C. parvum stools (n = 213) from cryptosporidiosis patients (cases) in Wales (n = 95) and the north west of England (n = 118) were tested by MLVA. Typability (defined as alleles identified at all seven loci in a sample) was 81.2% and discriminatory power estimated by Hunter Gaston Discriminatory Index was 0.99. A MLVA profile was constructed from the alleles, expressed in chromosomal order. Profiles were defined as simple (single allele at each locus) or mixed (more than one allele at any locus). A total of 161 MLVA profiles were identified; 13 were mixed, an additional 38 simple profiles contained null records, and 110 were complete simple profiles. A minimum spanning tree was constructed of simple MLVA profiles and those identical at all seven loci defined genetic clusters of cases (here, null records were considered as an allele); 77 cases formed 25 clusters, ranging from two to nine (mode = two) cases. The largest cluster, following epidemiological investigation, signalled a newly-identified outbreak. Two other cases with mixed profiles that contained the outbreak alleles were included in the outbreak investigation. In another epidemiologically-identified outbreak of six initial cases, MLVA detected two additional cases. In a third, small outbreak of three cases, identical MLVA profiles strengthened the microbiological evidence. Review of the performance characteristics of the individual loci and of the seven-locus scheme suggested that two loci might be candidates for review, but a larger dataset over a wider geographical area and longer timeframe will help inform decision-making about the scheme by user laboratories and stakeholders (such as public health agencies). This MLVA scheme is straightforward in use, fast and cheap compared to sequence-based methods, identifies mixed infections, provides an important tool for C. parvum surveillance, and can enhance outbreak investigations and public health action.
Keywords: Cluster; Cryptosporidium parvum; MLVA; Multi-locus; Outbreak; Subtyping.
© 2023 The Authors.
Conflict of interest statement
The authors declare that they have no known competing financial interests or personal relationships that could have appeared to influence the work reported in this paper.
Figures

References
-
- Caroli S., Santoni S., Ronfort J. AMaCAID: A useful tool for accurate marker choice for accession identification and discrimination. Mol. Ecol. Res. 2011;11:733–738. - PubMed
-
- Chalmers R.M., Giles M. Zoonotic cryptosporidiosis in the UK - challenges for control. J. Appl. Microbiol. 2010;109:1487–1497. - PubMed
-
- Chalmers R.M., Robinson G., Hotchkiss E., Alexander C., May S., Gilray J., et al. Suitability of loci for multiple-locus variable-number of tandem-repeats analysis of Cryptosporidium parvum for inter-laboratory surveillance and outbreak investigations. Parasitology. 2017;144:37–47. - PubMed
LinkOut - more resources
Full Text Sources
