. 2020 Dec;13(4):e12655.
doi: 10.1111/jfr3.12655. Epub 2020 Aug 13.

Flood risk in past and future: A case study for the Pawtuxet River's record-breaking March 2010 flood event

Affiliations

Flood risk in past and future: A case study for the Pawtuxet River's record-breaking March 2010 flood event

Soroush Kouhi et al. J Flood Risk Manag. 2020 Dec.

Abstract

In March 2010, a sequence of three major rainfall events in New England (United States) led to a record-breaking flooding event in the Pawtuxet River Watershed with a peak flow discharge of about 500-year return period. After development of hydrological and hydraulic models, a number of factors that played important roles in the impact of this flooding and other extreme events including river structures (reservoirs, historical textile mill dams, and bridges) were investigated. These factors are currently omitted within risk assessments tools such as flood insurance rate maps. Some management strategies that should be considered for future flood risk mitigation were modeled and discussed. Furthermore, to better understand possible future risks in a warmer climate, another extreme flood event was simulated. The synthetic/hypothetical storm (Hurricane Rhody with two landfalls) was created based on the characteristics of the historical hurricanes that severely impacted this region in the past. It was shown that while the first landfall of this hurricane did not lead to significant flood risk, the second landfall could generate more rain and flooding equivalent to a 500-year event. Results and the methodology of this study can be used to better understand and assess future flood risk in similar watersheds.

Keywords: HEC‐RAS; climate change; flood risk; hurricane; river flooding.


Figures

FIGURE 1
FIGURE 1
Map of the Pawtuxet River watershed. The watershed and subbasins borders are shown in black. The locations of the USGS stream gauges, meteorological station, reservoirs, and a few river structures are also shown. Locations of CFSR nodes to extract hindcast rainfall data are shown on the top right subfigure. CFSR, Climate Forecast System Reanalysis; USGS, United States Geological Survey
FIGURE 2
FIGURE 2
Historical flood frequency per year at the USGS 01116500 in Cranston from 1940 to 2017. The colour of the bars show the severity of the floods based on the flowrate. USGS, United States Geological Survey
FIGURE 3
FIGURE 3
Flooding of Warwick Mall (in the Main Branch of Pawtuxet River) during March 2010 event (credit A. P.)
FIGURE 4
FIGURE 4
The aerial photo of the Pontiac Dam (in the Main Branch of the Pawtuxet River) during March 2010 event (Richardson, 2016)
FIGURE 5
FIGURE 5
A snapshot of the Pawtuxet Village Bridge and some wood debris upstream of this bridge in the river channel that might be mobilized during a flooding event
FIGURE 6
FIGURE 6
Rhode Island annual precipitation from 1960, and projected to 2099. Two projections are shown corresponding to low and high emissions scenarios (Hayhoe et al., 2007). The straight lines show linear trendlines for each scenario
FIGURE 7
FIGURE 7
Spatial variability of daily precipitation in the area. Comparison of precipitation at various hindcast nodes as well as observed data are shown. See Figure 1 for locations of the nodes
FIGURE 8
FIGURE 8
The flowchart of a distributed hydrologic and hydraulic modelling system for flood risk assessment (Knebl, Yang, Hutchison, & Maidment, 2005)
FIGURE 9
FIGURE 9
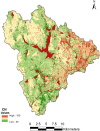
The CN map of the Pawtuxet River watershed. High CN values indicate reservoirs (water bodies) and urbanized areas (east region) that generate more runoff. CN, Curve Number
FIGURE 10
FIGURE 10
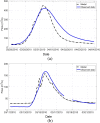
Comparison of hydrographs based on the observed data and calibrated HEC‐HMS model for (a) March 29 to April 4, 2010 (peak error of 6%), and (b) March 11 to March 21, 2010 (peak error of 6%) at USGS 01116500 in Cranston, RI. HEC‐HMS, Hydrologic Engineering Center's Hydrologic Modeling System; USGS, United States Geological Survey
FIGURE 11
FIGURE 11
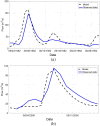
Comparison of the HEC‐HMS model results and the observed data for (a) June 1982 (peak error of 10%), and (b) June 2006 (peak error of 3%) at USGS 01116500 in Cranston, RI. HEC‐HMS, Hydrologic Engineering Center's Hydrologic Modeling System; USGS, United States Geological Survey
FIGURE 12
FIGURE 12
Effect of precipitation data on simulated flow discharge at USGS 01116500 in Cranston (a) Uncertainty in the several sources of the precipitation data: observed precipitation, NWS, ECMWF, CFSR, upper 90% limit, and lower 90% limit, and (b) Uncertainty in the HEC‐HMS flow discharges corresponding to several sources of precipitation data. CFSR, Climate Forecast System Reanalysis; ECMWF, European Centre for Medium‐Range Weather Forecast; HEC‐HMS, Hydrologic Engineering Center's Hydrologic Modeling System; NWS, National Weather Service; USGS, United States Geological Survey
FIGURE 13
FIGURE 13
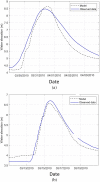
Comparison of modelled (HEC‐RAS) and observed stage hydrographs at USGS 01116500 in Cranston, RI; (a) March 29 to April 4, 2010 (2% error for peak elevation), and (b) March 11 to March 21, 2010 (1.8% error for peak elevation). Elevations are in NAVD 88. HEC‐HMS, Hydrologic Engineering Center's River Analysis System; USGS, United States Geological Survey
FIGURE 14
FIGURE 14
Inflow and outflow hydrographs at the Scituate Reservoir during March 2010 event; (a) assuming a full reservoir; (b) when the initial water level at the reservoir is assumed 1.2 m below the spillway crest
FIGURE 15
FIGURE 15
Impact of the Pontiac Diversion Dam on the flood. Reduced flooding areas (if the dam was removed) are shown in yellow: (a) 50‐year flooding event, and (b) 500‐year flooding event
FIGURE 16
FIGURE 16
Change in flooding extent due to accumulation of debris at the Pawtuxet Village Bridge assuming (a) 50‐ and (b) 500‐year event scenarios
FIGURE 17
FIGURE 17
Change in the flood zone in the vicinity of the Warwick Mall due to the change in precipitation for a 100‐year event for before 2010, after 2010, and relative 95% confidence limits
FIGURE 18
FIGURE 18
Comparison of the flooded area for a 100‐year flood event in the Main Branch assuming several scenarios at downstream of the river for tides (i.e., high tides), storm surge (100 year), and sea level rise (SLR; 3.5 m)
FIGURE 19
FIGURE 19
Time series of the rainfall generated by Hurricane Rhody in the Pawtuxet River Watershed (top), and the simulated discharge by HEC‐HMS at the USGS stream gauge in Cranston (bottom). The peak flow discharge of the record‐breaking March 2010 is shown for comparison. HEC‐HMS, Hydrologic Engineering Center's River Analysis System; USGS, United States Geological Survey

References

    1. Abbe, T. B. , & Montgomery, D. R. (2003). Patterns and processes of wood debris accumulation in the queets river basin, Washington. Geomorphology, 51(1–3), 81–107.
    1. Ahmad, A. , El‐Shafie, A. , Razali, S. F. M. , & Mohamad, Z. S. (2014). Reservoir optimization in water resources: A review. Water Resources Management, 28(11), 3391–3405.
    1. Anderson, J. R. (1976). A land use and land cover classification system for use with remote sensor data (Vol. 964). Washington, DC: US Government Printing Office.
    1. Barnes, H. H. (1967). Roughness characteristics of natural channels, Number 1849. Washington, DC: US Government Printing Office.
    1. Bednarek, A. T. (2001). Undamming rivers: A review of the ecological impacts of dam removal. Environmental Management, 27(6), 803–814. - PubMed