Comment
. 2023 Oct 31:14:1281687.
doi: 10.3389/fimmu.2023.1281687. eCollection 2023.

Integrated analysis of single-cell RNA-seq and bulk RNA-seq reveals RNA N6-methyladenosine modification associated with prognosis and drug resistance in acute myeloid leukemia

Affiliations
Comment

Integrated analysis of single-cell RNA-seq and bulk RNA-seq reveals RNA N6-methyladenosine modification associated with prognosis and drug resistance in acute myeloid leukemia

Zhongzheng Li et al. Front Immunol. .

Abstract

Introduction: Acute myeloid leukemia (AML) is a type of blood cancer that is identified by the unrestricted growth of immature myeloid cells within the bone marrow. Despite therapeutic advances, AML prognosis remains highly variable, and there is a lack of biomarkers for customizing treatment. RNA N6-methyladenosine (m6A) modification is a reversible and dynamic process that plays a critical role in cancer progression and drug resistance.

Methods: To investigate the m6A modification patterns in AML and their potential clinical significance, we used the AUCell method to describe the m6A modification activity of cells in AML patients based on 23 m6A modification enzymes and further integrated with bulk RNA-seq data.

Results: We found that m6A modification was more effective in leukemic cells than in immune cells and induced significant changes in gene expression in leukemic cells rather than immune cells. Furthermore, network analysis revealed a correlation between transcription factor activation and the m6A modification status in leukemia cells, while active m6A-modified immune cells exhibited a higher interaction density in their gene regulatory networks. Hierarchical clustering based on m6A-related genes identified three distinct AML subtypes. The immune dysregulation subtype, characterized by RUNX1 mutation and KMT2A copy number variation, was associated with a worse prognosis and exhibited a specific gene expression pattern with high expression level of IGF2BP3 and FMR1, and low expression level of ELAVL1 and YTHDF2. Notably, patients with the immune dysregulation subtype were sensitive to immunotherapy and chemotherapy.

Discussion: Collectively, our findings suggest that m6A modification could be a potential therapeutic target for AML, and the identified subtypes could guide personalized therapy.

Keywords: N6-methyladenosine modification; acute myeloid leukemia; single-cell transcriptome; subtype; tumor microenvironment.


Conflict of interest statement

The authors declare that the research was conducted in the absence of any commercial or financial relationships that could be construed as a potential conflict of interest.

Figures

Figure 1
Figure 1
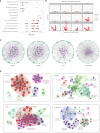
Identification of active and inactive m6A methylation cells in AML. (A) Score of 23 m6A modification activity. The threshold was chosen as 0.048 and the m6A modification score of 8,465 cells exceeded the threshold value (The dotted lines overlaying each distribution represent Gaussian fits to the distribution data.). (B) The volcano plot illustrates the differential expression of genes between m6A modification-active cells and m6A modification-inactive cells. (C) GO gene set enrichment analysis results were shown as lollipop plot where on x-axis, -log of FDR adjusted p-value for GO terms were shown. (D) Barplot of significantly activated pathways in the m6A-active (blue) and m6A-inactive (green) cells. (E) Stacked barplots showing the frequencies of m6A-active and m6A-inactive cells in 14 cell types (p-value > 0.05: ns, p-value < 0.05: *, 0.05 < p-value < 0.01:**, 0.01 < p-value < 0.001:***, 0.001 < p-value < 0.0001:****).
Figure 2
Figure 2
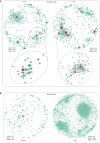
Effect of m6A modification status on transcriptional regulatory networks and pathway enrichment in four types of leukemia cells (A) Bubble plot showing the genes that were differentially expressed between m6A-active and m6A-inactive in each cell type. Node sizes correspond to -log10 of FDR adjusted p-value. (B) The volcano plots of differential transcription factor activity analysis of single-cell RNA sequencing data performed on each cell type comparing m6A-active cells vs. m6A-inactive cells. (C) Regulatory networks of transcription factors in four major types of leukemia cells (cDC-like, GMP-like, LSPCs and ProMono-like). (D) Pathway enrichment network of four major types of leukemia cells.
Figure 3
Figure 3
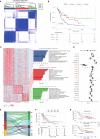
Gene regulatory network of m6A-inactive and m6A-active cells in leukemic cells and immune cells. (A) Gene regulatory network of m6A-inactive and m6A-active cells in leukemic cells (inactive: Cutoff = 0.9, Node = 284, Edge = 883; active: Cutoff = 0.9, Node = 256, Edge = 873). (B) Gene regulatory network of m6A-inactive and m6A-active cells in immune cells (inactive: Cutoff = 0.9, Node = 146, Edge = 260; active: Cutoff = 0.9, Node = 2036, Edge = 11078).
Figure 4
Figure 4
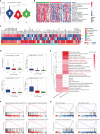
Classification of AML subtypes using the m6A-related genes in leukemia cells by K-means analysis. (A) K = 3 was identified as the optimal value for consensus clustering. (B) Kaplan-Meier curves of overall survival (OS) among the three subtypes in the TCGA LAML cohort. (C) The enrichment statistics of ssGSEA signaling pathways of immune dysregulation subtype, hormone regulation subtype and cellular adaptation subtype. (D) The expression levels of m6A-associated genes of immune dysregulation subtype, hormone regulation subtype and cellular adaptation subtype. (E) Sankey plot showing the correlation between the classification of AML subtypes using the m6A-related genes and French-American-British classification of acute myeloid leukemia. (F) The survival curve demonstrates the prognostic outcomes of FAB classification from TCGA-LAML. (G) Kaplan-Meier curves of OS among the three subtypes in two other GEO datasets (GSE146173 and GSE106291).
Figure 5
Figure 5
Comparison of genomic alterations of the three AML subtypes. (A) The genomic alterations among the three subtypes of the TCGA LAML cohort. (B) Mutation percentage of mostly mutated genes. (C) Tumor mutant burden difference among the three subtypes in the TCGA LAML cohort. (D) The Burden of Copy Number gain and the Burden of Copy Number Loss among the three subtypes in the TCGA LAML cohort. (E) Distinct Copy number alterations (CNA) profile among the three subtypes.
Figure 6
Figure 6
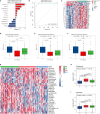
The three AML subtypes exhibited different immune statuses. (A) The ESTIMATE scores among the three subtypes in the TCGA LAML cohort. (B) The activation degree of 17 immune pathways in each tumor sample among the three subtypes. (C) The expression levels of 78 immunomodulators among the three subtypes. (D) Boxplot showing the activation status of suppressor proteins in different subtypes. (E) The pathway enrichment analysis on the top 100 differentially expressed genes in CA and ID subgroup. (F, G) GSEA results showing the activated signaling pathways in ID and CA subgroup. p-value > 0.05: ns, p-value < 0.05:*, 0.05 < p-value < 0.01: **, 0.01<p-value<0.001:***.
Figure 7
Figure 7
The three AML subtypes exhibited different drug resistance. (A) Features selected by Elastic-Net regression to differentiate between CR and NR samples. (B) ROC curves for the performance of GSE178926 cohort in predicting immunotherapy response. (C) Differentially expressed genes between CR and NR samples in GSE178926 cohort (Response score is the immunotherapy response score calculated by the elastic network model). (D) Boxplot showing the AZA+Pembro response score of the TCGA LAML cohort and (E, F) two GEO cohorts. (G) The heatmap showing the sensitivity of the three AML subtypes to different compounds. (H, I) Sensitivity of the three AML subtypes to Pazopanib, Dasatinib.

Comment on

References

    1. Xuan L, Liu Q. Maintenance therapy in acute myeloid leukemia after allogeneic hematopoietic stem cell transplantation. J Hematol Oncol (2021) 14:4. doi: 10.1186/s13045-020-01017-7 - DOI - PMC - PubMed
    1. Roundtree IA, Evans ME, Pan T, He C. Dynamic RNA modifications in gene expression regulation. Cell (2017) 169:1187–200. doi: 10.1016/j.cell.2017.05.045 - DOI - PMC - PubMed
    1. Huang H, Weng H, Chen J. m(6)A modification in coding and non-coding RNAs: roles and therapeutic implications in cancer. Cancer Cell (2020) 37:270–88. doi: 10.1016/j.ccell.2020.02.004 - DOI - PMC - PubMed
    1. Deng X, Su R, Weng H, Huang H, Li Z, Chen J. RNA N(6)-methyladenosine modification in cancers: current status and perspectives. Cell Res (2018) 28:507–17. doi: 10.1038/s41422-018-0034-6 - DOI - PMC - PubMed
    1. Ma S, Chen C, Ji X, Liu J, Zhou Q, Wang G, et al. . The interplay between m6A RNA methylation and noncoding RNA in cancer. J Hematol Oncol (2019) 12:121. doi: 10.1186/s13045-019-0805-7 - DOI - PMC - PubMed

Publication types

Substances