. 2023 Nov 6:14:1286087.
doi: 10.3389/fimmu.2023.1286087. eCollection 2023.

Genetic and immunological insights into COVID-19 with acute myocardial infarction: integrated analysis of mendelian randomization, transcriptomics, and clinical samples

Affiliations

Genetic and immunological insights into COVID-19 with acute myocardial infarction: integrated analysis of mendelian randomization, transcriptomics, and clinical samples

Zequn Zheng et al. Front Immunol. .

Abstract

Background: Globally, most deaths result from cardiovascular diseases, particularly ischemic heart disease. COVID-19 affects the heart, worsening existing heart conditions and causing myocardial injury. The mechanistic link between COVID-19 and acute myocardial infarction (AMI) is still being investigated to elucidate the underlying molecular perspectives.

Methods: Genetic risk assessment was conducted using two-sample Mendelian randomization (TSMR) to determine the causality between COVID-19 and AMI. Weighted gene co-expression network analysis (WGCNA) and machine learning were used to discover and validate shared hub genes for the two diseases using bulk RNA sequencing (RNA-seq) datasets. Additionally, gene set enrichment analysis (GSEA) and single-cell RNA-seq (scRNA-seq) analyses were performed to characterize immune cell infiltration, communication, and immune correlation of the hub genes. To validate the findings, the expression patterns of hub genes were confirmed in clinical blood samples collected from COVID-19 patients with AMI.

Results: TSMR did not find evidence supporting a causal association between COVID-19 or severe COVID-19 and AMI. In the bulk RNA-seq discovery cohorts for both COVID-19 and AMI, WGCNA's intersection analysis and machine learning identified TLR4 and ABCA1 as significant hub genes, demonstrating high diagnostic and predictive value in the RNA-seq validation cohort. Single-gene GSEA and single-sample GSEA (ssGSEA) revealed immune and inflammatory roles for TLR4 and ABCA1, linked to various immune cell infiltrations. Furthermore, scRNA-seq analysis unveiled significant immune dysregulation in COVID-19 patients, characterized by altered immune cell proportions, phenotypic shifts, enhanced cell-cell communication, and elevated TLR4 and ABCA1 in CD16 monocytes. Lastly, the increased expression of TLR4, but not ABCA1, was validated in clinical blood samples from COVID-19 patients with AMI.

Conclusion: No genetic causal link between COVID-19 and AMI and dysregulated TLR4 and ABCA1 may be responsible for the development of immune and inflammatory responses in COVID-19 patients with AMI.

Keywords: ABCA1; COVID-19; TLR4; acute myocardial infarction; causal relationship; immune dysregulation.


Conflict of interest statement

The authors declare that the research was conducted in the absence of any commercial or financial relationships that could be construed as a potential conflict of interest.

Figures
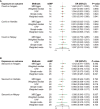
Figure 1
Figure 1
Two-sample Mendelian randomization (TSMR) analyses of COVID-19 and the risk of acute myocardial infarction (AMI). Summary statistics of genome-wide association studies in the COVID-19 (Covid) (A) or severe COVID-19 (Sevcovid) (B) cohorts were used for exposure and summary statistics of genome-wide association studies (GWAS) in the coronary artery disease (CAD) or AMI cohorts (Aragam, Hartiala, and Nikpey) were used for outcome analyses. The risk of exposure versus outcome was presented as odds ratio (OR). SNP, single nucleotide polymorphism; IVW, Inverse variance weighted; 95%CI, 95% confidence interval.
Figure 2
Figure 2
Weighted gene co-expression network analysis (WGCNA) of differentially expressed genes (DEGs) in COVID-19 and AMI. (A) Details of the GEO datasets involved in this study. (B) Volcano plot of DEGs in COVID-19 patients. (C) Volcano plot of DEGs in AMI patients. (D) Hierarchical clustering tree representing module-identification in COVID-19 co-expression patterns. (E) Hierarchical clustering tree representing module identification in AMI co-expression patterns.
Figure 3
Figure 3
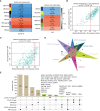
Shared genes of COVID-19 and AMI patients identified in disease-associated modules. (A) Correlation of module eigengenes (MEs) in COVID-19 and AMI patients. (B) Correlation between gene significance (GS) and MEturquoise membership in COVID-19 patients. (C) Correlation between GS and MEturquoise membership in AMI patients. (D) Identification of the intersection genes in each module positively associated with COVID-19 and AMI. (E) Specific presentation of the intersecting genes by UpSetR. Each shared genetic symbol between the modules of the disease is presented.
Figure 4
Figure 4
Fold change in expression of shared genes for COVID-19 and AMI and their functional and pathway enrichment analysis. (A) Shared gene expression fold changes (Log2FC) (disease vs. control). Four genes with opposite expression trends are marked in red. (B) Enriched Gene Ontology (GO) biological process (BP) of shared genes. (C) Enriched GO molecular function (MF) of shared genes. (D) Enriched GO cellular component (CC) of shared genes. (E) KEGG pathway enrichment analysis of shared genes.
Figure 5
Figure 5
Identification of hub genes in shared disease genes. (A) Protein-protein interaction (PPI) network of disease-shared genes. (B) Venn diagram of intersecting hub genes identified by the 4 algorithms of cytoHubba from the PPI network and the merged networks of hub genes. (C) Machine learning algorithm based on Least Absolute Shrinkage and Selection Operator (LASSO) (left) and Support Vector Machine Recursive Feature Elimination (SVM-RFE) (right) to select the most significant feature genes from intersecting hub gene. LASSO identified 2 genes with non-zero coefficients, whereas SVM-RFE identified and selected the top 5 feature genes. (D) Expression values of intersecting hub genes in the validation cohorts of COVID-19 (COVID-19, n=48; CTL, n=42) and AMI (AMI, n=20; CTL, n=10). Statistically significant differences in both COVID-19 and AMI (P < 0.05) are marked as red. ns: non-significant.
Figure 6
Figure 6
Diagnostic value of TLR4 and ABCA1 genes in COVID-19 with AMI and their single-gene GSEA analysis. (A) ROC analysis of TLR4 and ABCA1 genes in COVID-19 and AMI. (B) ROC analysis of TLR4 combined with ABCA1 in COVID-19 and AMI. (C) Macro- and micro-averaged ROC analysis of TLR4 combined with ABCA1 in COVID-19 with concurrent AMI. (D) Nomogram predicting risk for AMI and COVID-19 by ABCA1 and TLR4. (E) The decision curve analysis (DCA) model derives the net benefit. The complex model (Complex) was constructed by incorporating TLR4 and ABCA1 as joint predictive factors.
Figure 7
Figure 7
Immunocorrelation and immune cell infiltration analysis using single-gene GSEA and ssGSEA methods. (A) Box plot of immune scores for COVID-19 and healthy controls. (B) Box plot of immune scores for AMI and healthy controls. (C) Single-gene GSEA analysis of TLR4 and ABCA1. Signaling pathways involving TLR4 or ABCA1 are shown. (D) Heat map of the correlation between ABCA1 and TLR4 and immune cell infiltration. * P < 0.05, ** P <0.01, *** P < 0.001, **** P < 0.0001.
Figure 8
Figure 8
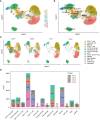
Immunological cell profiling of scRNA-seq data from peripheral blood samples of severe COVID-19 patients. (A) UMAP dimensionality reduction embedding for the integrated dataset of scRNA-seq data from all profiled samples (n = 32,462 cells) colored by inferred cluster identity. (B) UMAP embedding of the integrated dataset colored by orthogonally generated clusters labeled by manual cell type annotation. (C) UMAP grouped by donor of origin (COV1: COVID-19 sample #1; COV2: COVID-19 sample #2; CTL1: healthy control sample #1; CTL2: healthy control sample #2. (D) Bar chart representing the count of various cell types across different samples. pDC, plasmacytoid dendritic cell.
Figure 9
Figure 9
Analysis of immune cell-cell communication and expression patterns of TLR4 and ABCA1. (A) A circular plot of cell-cell communication patterns in scRNA-seq samples from healthy controls. (B) A circular plot of cell-cell communication patterns in scRNA-seq samples from severe COVID-19 patients. (C) An aggregated cell-cell communication network shows the number of interactions or total interaction strength between any two cell groups. (D) The signaling network of CCL (chemokine ligand) pathways and their communication patterns among different cell populations. (E) Violin plots colored by the donor of TLR4 and ABCA1 expression values for each cell type. (F) Identification of ABCA1 and TLR4 gene expression in peripheral blood from clinical patients with COVID-19 complicated with AMI by RT-qPCR, and healthy individuals served as controls. Ten samples each from disease and control were analyzed and each sample was repeatedly measured four times (Disease, n=40; CTL, n=40).
Figure 10
Figure 10
Workflow diagram of the study. Two-sample Mendelian randomization (TSMR) was used to infer causality between COVID-19 exposure and AMI outcome, and transcriptomics of bulk RNA sequencing (RNA-seq) and single-cell RNA-seq (scRNA-seq) and clinical blood samples from COVID-19 patients with AMI were analyzed to investigate the immunological mechanisms of the disease. GWAS, genome-wide association studies; IVs, instrumental variables; IVW, Inverse variance weighted; OR, odds ratio; GEO, Gene Expression Omnibus database; DEGs, differentially expressed genes; WGCNA, weighted gene co-expression network analysis; power, soft threshold; PPI, protein-protein interaction; RT-qPCR, reverse transcription-quantitative polymerase chain reaction; ssGSEA, single-sample gene set enrichment analysis; ROC, receiver operating characteristic; DCA, decision curve analysis.

References

    1. Clarke JM, Majeed A, Beaney T. Measuring the impact of covid-19. British Medical Journal Publishing Group (2021) 373:n1239. doi: 10.1136/bmj.n1239 - DOI - PubMed
    1. Del Prete A, Conway F, Della Rocca DG, Biondi-Zoccai G, De Felice F, Musto C, et al. COVID-19, acute myocardial injury, and infarction. Cardiac Electrophysiol Clinics (2022) 14(1):29–39. doi: 10.1016/j.ccep.2021.10.004 - DOI - PMC - PubMed
    1. Thomas MR, Scully M. Clinical features of thrombosis and bleeding in COVID-19. Blood (2022) 140(3):184–95. doi: 10.1182/blood.2021012247 - DOI - PMC - PubMed
    1. Bavishi C, Bonow RO, Trivedi V, Abbott JD, Messerli FH, Bhatt DL. Special Article - Acute myocardial injury in patients hospitalized with COVID-19 infection: A review. Prog Cardiovasc Dis (2020) 63(5):682–9. doi: 10.1016/j.pcad.2020.05.013 - DOI - PMC - PubMed
    1. Rodriguez-Leor O, Cid Alvarez AB, Pérez de Prado A, Rossello X, Ojeda S, Serrador A, et al. In-hospital outcomes of COVID-19 ST-elevation myocardial infarction patients. EuroIntervention J EuroPCR collaboration Working Group Interventional Cardiol Eur Soc Cardiol (2021) 16(17):1426–33. doi: 10.4244/EIJ-D-20-00935 - DOI - PMC - PubMed

Publication types

Substances