

Body composition in male lifelong trained strength, sprint and endurance athletes and healthy age-matched controls
- PMID: 38022768
- PMCID: PMC10650965
- DOI: 10.3389/fspor.2023.1295906
Body composition in male lifelong trained strength, sprint and endurance athletes and healthy age-matched controls
Abstract
Introduction: Aging involves many physiological processes that lead to decreases in muscle mass and increases in fat mass. While regular exercise can counteract such negative body composition outcomes, masters athletes maintain high levels of exercise throughout their lives. This provides a unique model to assess the impact of inherent aging. The present study compared lean mass and fat mass in young and masters athletes from different sports to age-matched non-athletic individuals.
Methods: Participants included young (20-39 years, n = 109) and older (70-89 years, n = 147) competitive male athletes, and 147 healthy age-matched controls (young = 53, older = 94 males). Athletes were separated into strength (e.g., weightlifters, powerlifters), sprint (e.g., sprint runners, jumpers) and endurance (e.g., long-distance runners, cross-country skiers) athletic disciplines. Body composition was assessed by dual-energy x-ray absorptiometry (DXA). Upper and lower limb lean mass was combined for appendicular lean mass as well as appendicular lean mass index (ALMI; kg/m2). Individuals' scores were assessed against established cut-offs for low muscle mass, obesity, and sarcopenic obesity to determine prevalence in each group.
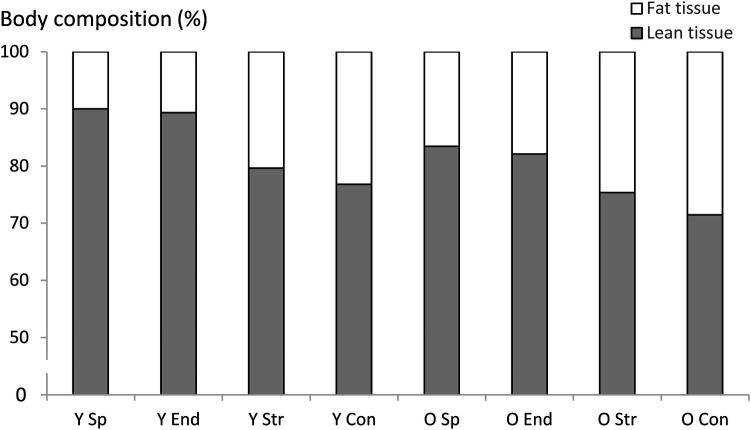
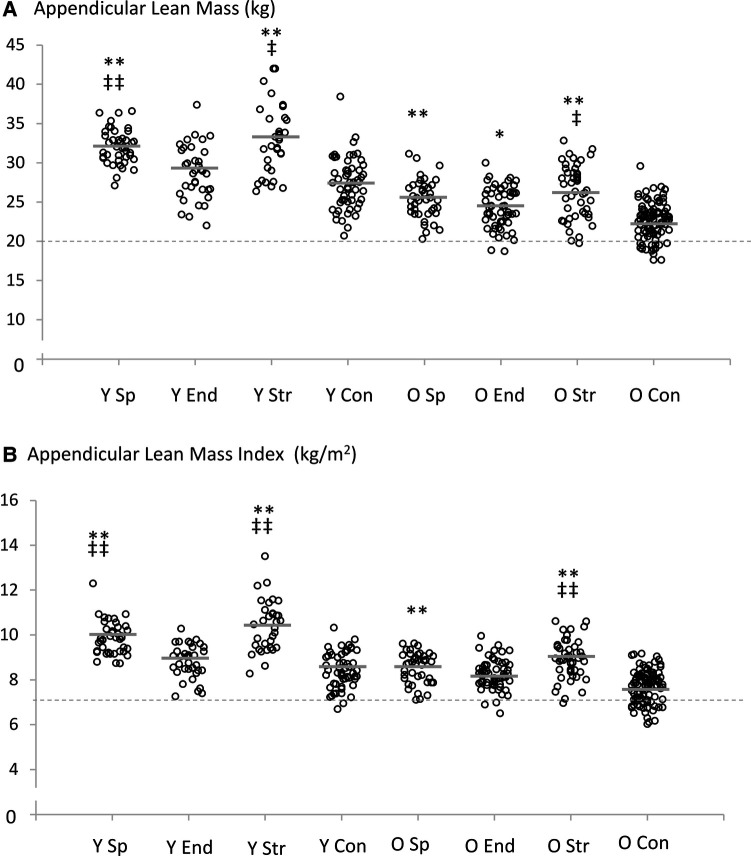
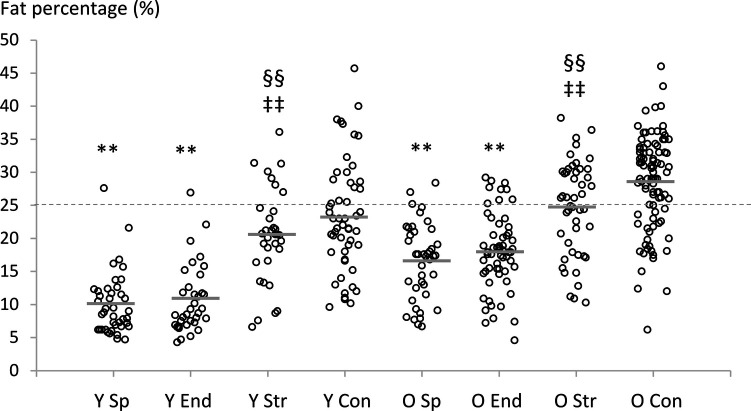
Results: ALMI was greater in young strength (0.81-2.36 kg/m2, ∼15% and 1.24-2.74 kg/m2, ∼19%) and sprint (95% CI = 0.51-1.61 kg/m2, ∼11% and 0.96-1.97 kg/m2, ∼15%) athletes than in endurance and controls, respectively (all P < 0.001). In masters athletes, only strength athletes had greater ALMI than endurance athletes, but both older strength and sprint athletes had greater ALMI than older controls (0.42-1.27 kg/m2, ∼9% and 0.73-1.67 kg/m2, ∼13%, respectively, both P < 0.001). Fat mass was significantly lower in sprint and endurance athletes compared to strength athletes and controls in both age-groups. Sarcopenic obesity was identified in one young (2%) and eighteen (19%) older controls, while only two older endurance athletes (3%) and one older strength athlete (2%) were identified.
Discussion: Lifelong competitive sport participation leads to lower prevalence of sarcopenic obesity than a recreationally active lifestyle. This is achieved in strength athletes by emphasizing muscle mass, while sprint and endurance athletes demonstrate low fat mass levels. However, all older athlete groups showed higher fat mass than the young groups, suggesting that exercise alone may not be sufficient to manage fat mass.
Keywords: ageing; exercise; fat mass; lean mass; muscle; resistance training.
© 2023 Walker, von Bonsdorff, Cheng, Häkkinen, Bondarev, Heinonen and Korhonen.
Conflict of interest statement
The authors declare that the research was conducted in the absence of any commercial or financial relationships that could be construed as a potential conflict of interest.
Figures
Similar articles
-
Hip and spine bone mineral density are greater in master sprinters, but not endurance runners compared with non-athletic controls.Arch Osteoporos. 2018 Jul 3;13(1):72. doi: 10.1007/s11657-018-0486-9. Arch Osteoporos. 2018. PMID: 29971503 Free PMC article.
-
Muscle morphology and performance in master athletes: A systematic review and meta-analyses.Ageing Res Rev. 2018 Aug;45:62-82. doi: 10.1016/j.arr.2018.04.007. Epub 2018 Apr 30. Ageing Res Rev. 2018. PMID: 29715523
-
Comparison of Muscle Function, Bone Mineral Density and Body Composition of Early Starting and Later Starting Older Masters Athletes.Front Physiol. 2019 Aug 27;10:1050. doi: 10.3389/fphys.2019.01050. eCollection 2019. Front Physiol. 2019. PMID: 31507432 Free PMC article.
-
Effects of Combined Strength and Sprint Training on Lean Mass, Strength, Power, and Sprint Performance in Masters Road Cyclists.J Strength Cond Res. 2019 Jan;33(1):66-79. doi: 10.1519/JSC.0000000000001960. J Strength Cond Res. 2019. PMID: 28557858 Clinical Trial.
-
The Effects of Trunk Muscle Training on Physical Fitness and Sport-Specific Performance in Young and Adult Athletes: A Systematic Review and Meta-Analysis.Sports Med. 2022 Jul;52(7):1599-1622. doi: 10.1007/s40279-021-01637-0. Epub 2022 Jan 21. Sports Med. 2022. PMID: 35061213 Free PMC article.
Cited by
-
Assessment of Micro- and Macronutrient Intake in Male Competitive Athletes Using the Epic-Norfolk Food Frequency Questionnaire.Life (Basel). 2025 Mar 13;15(3):458. doi: 10.3390/life15030458. Life (Basel). 2025. PMID: 40141802 Free PMC article.
-
Multidimensional Differences Between Athletes of Endurance, Strength, and Intermittent Sports: Body Composition, Diet, Resting Metabolic Rate, Physical Activity, Sleep Quality, and Subjective Well-Being.Nutrients. 2025 Mar 28;17(7):1172. doi: 10.3390/nu17071172. Nutrients. 2025. PMID: 40218930 Free PMC article.
-
Where Muscle Matters: How Regional Differences, Pain, and Gender Define Gamer Health.Int J Environ Res Public Health. 2025 Apr 26;22(5):687. doi: 10.3390/ijerph22050687. Int J Environ Res Public Health. 2025. PMID: 40427804 Free PMC article.
-
Endurance exercise preserves physical function in adult and older male C57BL/6 mice: high intensity interval training (HIIT) versus voluntary wheel running (VWR).Front Aging. 2024 Mar 7;5:1356954. doi: 10.3389/fragi.2024.1356954. eCollection 2024. Front Aging. 2024. PMID: 38523671 Free PMC article.
References
LinkOut - more resources
Full Text Sources