. 2023 Nov 6;3(1):vbad159.
doi: 10.1093/bioadv/vbad159. eCollection 2023.

Enhanced annotation of CD45RA to distinguish T cell subsets in single-cell RNA-seq via machine learning

Affiliations

Enhanced annotation of CD45RA to distinguish T cell subsets in single-cell RNA-seq via machine learning

Ran Ran et al. Bioinform Adv. .

Abstract

Motivation: T cell heterogeneity presents a challenge for accurate cell identification, understanding their inherent plasticity, and characterizing their critical role in adaptive immunity. Immunologists have traditionally employed techniques such as flow cytometry to identify T cell subtypes based on a well-established set of surface protein markers. With the advent of single-cell RNA sequencing (scRNA-seq), researchers can now investigate the gene expression profiles of these surface proteins at the single-cell level. The insights gleaned from these profiles offer valuable clues and a deeper understanding of cell identity. However, CD45RA, the isoform of CD45 which distinguishes between naive/central memory T cells and effector memory/effector memory cells re-expressing CD45RA T cells, cannot be well profiled by scRNA-seq due to the difficulty in mapping short reads to genes.

Results: In order to facilitate cell-type annotation in T cell scRNA-seq analysis, we employed machine learning and trained a CD45RA+/- classifier on single-cell mRNA count data annotated with known CD45RA antibody levels provided by cellular indexing of transcriptomes and epitopes sequencing data. Among all the algorithms we tested, the trained support vector machine with a radial basis function kernel with optimized hyperparameters achieved a 99.96% accuracy on an unseen dataset. The multilayer perceptron classifier, the second most predictive method overall, also achieved a decent accuracy of 99.74%. Our simple yet robust machine learning approach provides a valid inference on the CD45RA level, assisting the cell identity annotation and further exploring the heterogeneity within human T cells. Based on the overall performance, we chose the support vector machine with a radial basis function kernel as the model implemented in our Python package scCD45RA.

Availability and implementation: The resultant package scCD45RA can be found at https://github.com/BrubakerLab/ScCD45RA and can be installed from the Python Package Index (PyPI) using the command "pip install sccd45ra."


Conflict of interest statement

None declared.

Figures
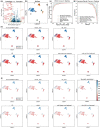
Figure 1.
Figure 1.
Overview of the features, the data, and the prediction made by classifiers. (a) Volcano plot of the DEGs. x-axis: gene expression level log2 fold change (log2FC) in CD45RA cells with respect to CD45RA+ cells. y-axis: −log10q-value (false discovery rate) of gene’s fold change in CD45RA with respect to CD45RA+. The threshold of the magnitude of the DE genes’ log2FC across CD45RA+/ to be considered distinguished enough to be reported was set at 2. (b) Uniform manifold approximation and projection (UMAP) of cell subsets in the CITE-seq data. Numbers represent different Leiden clusters. (c) ROC curve on the testing dataset of all six classifiers. (d) Precision/recall curve on the testing dataset of all six classifiers. AP, average precision. (e), (f) Visualization of classifiers’ predictions in the (e) training data and (f) testing data embedded on the UMAP coordinates. The first subplot in each figure is visualization of the CD45RA true label in the CITE-seq data. The predicted CD45RA level of the testing data by Seurat 4 reference mapping is also showed in (f) (the rightmost subplot).
Figure 2.
Figure 2.
Misclassification and hard-to-classify clusters in the training/testing CITE-seq dataset. (a), (b) Visualization of classifiers’ wrong predictions (misclassification) in the (a) training data, and (b) testing data embedded on the .UMAP coordinates. In (b), the rightmost plot visualized the thresholded Seurat 4 CITE-seq reference mapping as a benchmark. (c) Expression (log-transformed corrected counts) of well-studied T marker genes in clusters 1 and 3 of the CITE-seq data. (d) Visualization of T subsets marker expression in CITE-seq data on UMAP.
Figure 3.
Figure 3.
Misclassification and hard-to-classify clusters in the unseen dataset. (a) Visualization of classifiers’ predictions in the unseen data embedded in the UMAP coordinates. Given the unseen data were reported as all CD45RA−, which should not have any CD45RA+ cells, this plot also visualizes classifiers’ wrong predictions (misclassification) in the unseen data. The first subplot in each plot shows the Leiden clustering as a reference. (b) The predicted CD45RA antibody-derived tag (ADT) by Seurat 4 CITE-seq reference mapping. (c) Expression (log-transformed corrected counts) of well-studied T marker genes in clusters 1 and 3 of the CITE-seq data. (d) Visualization of T subsets marker expression in the unseen data on UMAP.
Figure 4.
Figure 4.
Misclassification and hard-to-classify clusters in the GSE164378 dataset. (a) (i) The Leiden clustering as a reference. (ii) Visualization of classifiers’ predictions in the GSE164378 data embedded in the UMAP coordinates. (iii) UMAP embeddings colored in the CD45RA true label of cells. (iv) UMAP embeddings colored in the predicted CD45RA label of cells. (b) Expression (log-transformed corrected counts) of well-studied T marker genes in clusters 0, 4, and 7 of the GSE164378 data. As can see in (a) (ii), most misclassified dots are in these three clusters.

References

    1. Abadi M, Barham P, Chen J. et al. TensorFlow: A System for Large-Scale Machine Learning. In: Proceedings of the 12th USENIX conference on Operating Systems Design and Implementation (OSDI'16). 2016. https://www.usenix.org/system/files/conference/osdi16/osdi16-gu.pdf.
    1. Alcover A, Alarcón B, Bartolo VD.. Cell biology of T cell receptor expression and regulation. Annu Rev Immunol 2018;36:103–25. 10.1146/ANNUREV.-IMMUNOL-042617-053429 - DOI - PubMed
    1. Ali Y, Al-Hroot K.. Bankruptcy prediction using multilayer perceptron neural networks in Jordan. ESJ 2016;12:425. 10.19044/ESJ.2016.V12N4P425 - DOI
    1. Allison JP. Gamma delta T-cell development. Curr Opin Immunol 1993;5:241–6. 10.1016/0952-7915(93)90011-G - DOI - PubMed
    1. Beverley PC. Human T cell subsets. Immunol Lett 1987;14:263–7. 10.1016/0165-2478(87)90001-0 - DOI - PubMed