. 2023 Aug 21;8(6):e10591.
doi: 10.1002/btm2.10591. eCollection 2023 Nov.

Biodegradable scaffolds for enhancing vaccine delivery

Affiliations

Biodegradable scaffolds for enhancing vaccine delivery

Matthew D Kerr et al. Bioeng Transl Med. .

Abstract

Sustained release of vaccine components is a potential method to boost efficacy compared with traditional bolus injection. Here, we show that a biodegradable hyaluronic acid (HA)-scaffold, termed HA cryogel, mediates sustained antigen and adjuvant release in vivo leading to a durable immune response. Delivery from subcutaneously injected HA cryogels was assessed and a formulation which enhanced the immune response while minimizing the inflammation associated with the foreign body response was identified, termed CpG-OVA-HAC2. Dose escalation studies with CpG-OVA-HAC2 demonstrated that both the antibody and T cell responses were dose-dependent and influenced by the competency of neutrophils to perform oxidative burst. In immunodeficient post-hematopoietic stem cell transplanted mice, immunization with CpG-OVA-HAC2 elicited a strong antibody response, three orders of magnitude higher than dose-matched bolus injection. In a melanoma model, CpG-OVA-HAC2 induced dose-responsive prophylactic protection, slowing the tumor growth rate and enhancing overall survival. Upon rechallenge, none of the mice developed new tumors suggesting the development of robust immunological memory and long-lasting protection against repeat infections. CpG-OVA-HAC2 also enhanced survival in mice with established tumors. The results from this work support the potential for CpG-OVA-HAC2 to enhance vaccine delivery.

Keywords: compounds/materials; drug delivery; immunotherapies; medical devices; tissue engineering.


Figures

FIGURE 1
FIGURE 1
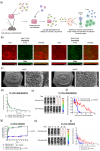
Synthesis and characterization of HA cryogels. (a) Schematic depicting HA cryogel vaccine formulation. (b) Confocal microscopy images, overhead and side views, depicting hydrated Cy5‐conjugated HAC1 (HAC1:Cy5) and HAC2:Cy5 incubated with 10 μm FITC‐labeled microparticles. Scale bar = 100 μm. (c) Scanning electron microscope (SEM) images of HA cryogels, HAC1 and HAC2. Left scale bar = 2 mm, right scale bar = 300 μm. (d) In vitro degradation kinetics of OVA‐encapsulated Cy5‐labeled HAC1 (OVA‐HAC1:Cy5) and HAC2 (OVA‐HAC1:Cy5) in hyaluronidase 2 (HYAL2) solution. (e) Representative in vivo imaging system (IVIS) fluorescence images of OVA‐HAC1:Cy5 and OVA‐HAC2:Cy5 degradation. (f) Measuring OVA‐HAC1:Cy5 and OVA‐HAC2:Cy5 degradation in vivo by quantification of total radiant efficiency normalized to initial day 3 timepoint. (g) Quantification of in vitro OVA release from OVA‐encapsulated HAC1 (OVA‐HAC1) and OVA‐HAC2 in either phosphate buffered saline or HYAL2 solution. (h) Representative IVIS fluorescence images of Cy5‐conjugated OVA (OVA:Cy5) encapsulated HAC1 (OVA:Cy5‐HAC1) and OVA:Cy5‐HAC2. (i) Measuring OVA:Cy5 release from HAC1 and HAC2 by quantification of total radiant efficiency normalized to initial 6‐h timepoint. Data in d, g represents mean ± SD of n = 4 cryogels. Data in f represents mean ± SEM of n = 5 mice. Data in i represents mean ± SEM of n = 4 mice. Data in (d,f,g,i) compared using two‐way ANOVA with Bonferroni multiple comparison test. In g comparison of PBS and HYAL2 release was conducted by pooling measurements for OVA‐HAC1 and OVA‐HAC2. Figure 1a created using Biorender.
FIGURE 2
FIGURE 2
Assessment of innate immune cell response to HAC1 and HAC2. (a) Workflow schematic for assessing innate immune cell infiltration in OVA‐HAC. (b) Representative flow cytometry plots depicting gating strategy to determine cellular identity of CD45+CD11b+Ly6G+ (neutrophil), CD45+CD11b+Ly6GCD115+ (monocyte), CD45+CD11b+Ly6GCD115F4/80+ (macrophage), and CD45+CD11b+Ly6GCD115F4/80CD11c+ dendritic cells (DCs). (c) Quantification of total CD45+CD11b+ (myeloid) cells. (d) Infiltrating immune cells plotted as a percentage of myeloid cells. e‐h Quantification of total numbers of (e) neutrophils, (f) monocytes, (g) macrophages, and (h) DCs. (i) Hematoxylin and eosin (H&E) stained histological sections of explanted OVA‐HAC1 and OVA‐HAC2 7‐days post‐injection. Full view scale bar = 800 μm, magnified scale bar = 100 μm. (j) Quantification of cellular density in the sections from H&E slides. (k) Quantification of fibrotic capsule thickness in the sections from H&E slides. (l) Assessment of anti‐OVA IgG1 antibody titers in serum of mice which received a single injection of OVA‐HAC1 or OVA‐HAC2, administered in a prime and boost setting 11 days apart. Data in (c–h) represents mean ± SD of n = 9 cryogels. Data in j represents mean ± SD of n = 4 cryogels. Data in (k) represents mean ± SD of n = 12 measurements (4 measurements per cryogel). Data in (l) represents mean ± SD of n = 5 mice. Data in (c,e–h,j,k) compared using Student t‐test. Data in (l) compared using two‐way ANOVA with Bonferroni multiple comparison test. Figure 2a created using Biorender.
FIGURE 3
FIGURE 3
HA cryogel degradation is independent of encapsulated adjuvants. (a) Overview schematic depicting for in vivo degradation study. (b–e) Representative IVIS fluorescence images of cryogel degradation and quantification by measuring total radiant efficiency normalized to initial day 3 timepoint of (b) OVA‐HAC2, (c) GMCSF‐OVA‐HAC2, (d) CpG‐OVA‐HAC2, and (e) GM‐CSF and CpG encapsulated OVA‐HAC2 (GMCSF‐CpG‐OVA‐HAC2). Data in (e–h) represents mean ± SEM of n = 5 mice. Data in e‐h compared two‐way ANOVA with Bonferroni multiple comparison test on prime vaccine degradation curves. Figure 3a created using Biorender.
FIGURE 4
FIGURE 4
Encapsulation of adjuvants alters foreign body response. (a) Workflow schematic for assessing innate immune cell infiltration in HAC2, OVA‐HAC2, GM‐CSF and OVA encapsulated HAC2 (GMCSF‐OVA‐HAC2), CpG and OVA encapsulated HAC2 (CpG‐OVA‐HAC2), and GM‐CSF, CpG, and OVA encapsulated HAC2 (GMCSF‐CpG‐OVA‐HAC2). (b) Quantification of total CD45+CD11b+ (myeloid) cells in cryogels removed 10‐days post‐injection. (c) Infiltrating immune cell lineages plotted as a percentage of myeloid cells in cryogels removed 10‐days post‐injection. d‐g Quantification of total numbers of (d) CD45+CD11b+Ly6G+ (neutrophils), (e) CD45+CD11b+Ly6GCD115+ (monocytes), (f) CD45+CD11b+Ly6GCD115F4/80+ (macrophages), and (g) CD45+CD11b+Ly6GCD115F4/80CD11c+ (dendritic) cells (DCs) in cryogels removed 10‐days post‐injection. (h) Hematoxylin and eosin (H&E) stained histological sections of explanted OVA‐HAC2, GMCSF‐OVA‐HAC2, CpG‐OVA‐HAC2, and GMCSF‐CpG‐OVA‐HAC2 10‐days post‐injection. Full view scale bar = 800 μm, magnified scale bar = 100 μm. (i) Quantification of cellular density in the sections from H&E slides. (j) Quantification of fibrotic capsule thickness in the sections from H&E slides. (k) Assessment of anti‐OVA IgG1 antibody titers in serum of mice which received OVA‐HAC2, GMCSF‐OVA‐HAC2, CpG‐OVA‐HAC2, or GMCSF‐CpG‐OVA‐HAC2 administered in a prime and boost setting 11‐days apart. Data in (b–g) represents mean ± SD of n = 5 cryogels. Data in (i) represents mean ± SD of n = 8–10 cryogels. Data in (j) represents mean ± SD of n = 20 measurements (4 measurements per cryogel). Data in (k) represents mean ± SD of n = 5 mice. Data in (b,e–g,i,j) compared using one‐way ANOVA with Dunnett multiple comparison. Data in (d) was compared using Kruskal–Wallis test with Dunnett multiple comparison. Data in (k) was compared using two‐way ANOVA with Bonferroni multiple comparison test. Figure 4a created using Biorender.
FIGURE 5
FIGURE 5
Adaptive immune response to HA cryogel vaccine is dose‐responsive. (a) Representative in vivo imaging system (IVIS) fluorescence images of Cy5‐labeled CpG (CpG:Cy5) and OVA encapsulated within HA cryogels from supplier 2 (CpG:Cy5‐OVA‐HAC2) and measuring degradation by quantification of total radiant efficiency normalized to initial 6‐h timepoint. (b) Assessment of anti‐OVA IgG1 antibody titers in serum of mice which received CpG‐OVA‐HAC2 administered as a single dose prime, two‐dose prime, single dose prime and boost administered 11‐days apart, or two‐dose prime and boost administered 11‐days apart. (c) Representative flow cytometry plots in axillary draining lymph nodes (LNs) to depicting gating strategy to assess CD45+B220CD8+SIINFEKL+ cells (OVA‐specific cytotoxic T cells). (d) Percentage of OVA‐specific cytotoxic T cells of total CD45+B220CD8+ cells (cytotoxic T cells) in axillary draining LNs. (e) Representative IVIS fluorescence images of CpG and OVA encapsulated within Cy5‐conjugated HAC2 (CpG‐OVA‐HAC2:Cy5) in B6 and gp91phox− mice. (f) Assessment of anti‐OVA IgG1 antibody titers in serum of B6 and gp91phox− mice which received two CpG‐OVA‐HAC2:Cy5 as a prime and boost. (g) Overview schematic for assessing anti‐OVA IgG1 antibody titers post autologous hematopoietic stem cell transplant (HSCT) mice (h) Anti‐OVA IgG1 antibody titers in serum of mice following two prime and boost vaccination of either two bolus CpG + OVA vaccination or two CpG‐OVA‐HAC2 post‐HSCT. Data in (a) represents mean ± SEM of n = 5 mice. Data in (b,d,f) represents mean ± SD of n = 5 mice. Data in (h) represents mean ± SD of n = 7 mice. Data in (b,f,h) were compared pairwise using two‐way ANOVA with Bonferroni multiple comparison test. Data in (d) was compared using one‐way ANOVA with Dunnett multiple comparison. Figure 5g created using Biorender.
FIGURE 6
FIGURE 6
CpG‐OVA‐HAC2 provides protection against B16‐OVA melanoma. (a) Overview schematic for assessing prophylactic immunization in mediating protection against B16‐OVA melanoma. (b) Progression‐free survival, (c) tumor volume measured in individual mice, and (d) overall survival. Mice were inoculated with 100K B16‐OVA melanoma cells administered subcutaneously either in unvaccinated mice, or after two‐dose bolus, single dose CpG‐OVA‐HAC2, and two‐dose CpG‐OVA‐HAC2 administered as a prime and boost. (e) Quantification of anti‐OVA IgG1 antibody titers in serum of vaccinated mice 6‐weeks post prime and 3‐weeks post tumor inoculation. (f) Overview schematic for assessing therapeutic immunization in mediating protection against B16‐OVA melanoma. (g) Tumor volume measured in individual mice and (h) overall survival. Data in (b,c,d) represents n = 10 mice. Data in (e) represents mean ± SD of n = 10 mice. Data in (g,h) represents n = 8–10 mice. Data in (b,d,h) were compared pairwise using log‐rank test. Data in (c,g) was compared using Kruskal–Wallis test with Dunnett multiple comparison of area under the curve. Data in (e) was compared using one‐way ANOVA with Dunnett multiple comparison. Figure 6a,f created using Biorender.

References

    1. Roth GA, Gale EC, Alcántara‐Hernández M, et al. Injectable hydrogels for sustained codelivery of subunit vaccines enhance humoral immunity. ACS Cent Sci. 2020;6:1800‐1812. - PMC - PubMed
    1. Shah NJ, Najibi AJ, Shih TY, et al. A biomaterial‐based vaccine eliciting durable tumour‐specific responses against acute myeloid leukaemia. Nat Biomed Eng. 2020;4:40‐51. - PubMed
    1. Cirelli KM, Carnathan DG, Nogal B, et al. Slow delivery immunization enhances HIV neutralizing antibody and germinal center responses via modulation of immunodominance. Cell. 2019;177:1153‐1171. - PMC - PubMed
    1. Dalla Pietà A, Carpanese D, Grigoletto A, et al. Hyaluronan is a natural and effective immunological adjuvant for protein‐based vaccines. Cell Mol Immunol. 2021;18:1197‐1210. - PMC - PubMed
    1. Chen J, Wang B, Caserto JS, et al. Sustained delivery of SARS‐CoV‐2 RBD subunit vaccine using a high affinity injectable hydrogel scaffold. Adv Healthc Mater. 2022;11:2101714. - PMC - PubMed