

Critical transition of soil microbial diversity and composition triggered by plant rhizosphere effects
- PMID: 38023904
- PMCID: PMC10676204
- DOI: 10.3389/fpls.2023.1252821
Critical transition of soil microbial diversity and composition triggered by plant rhizosphere effects
Abstract
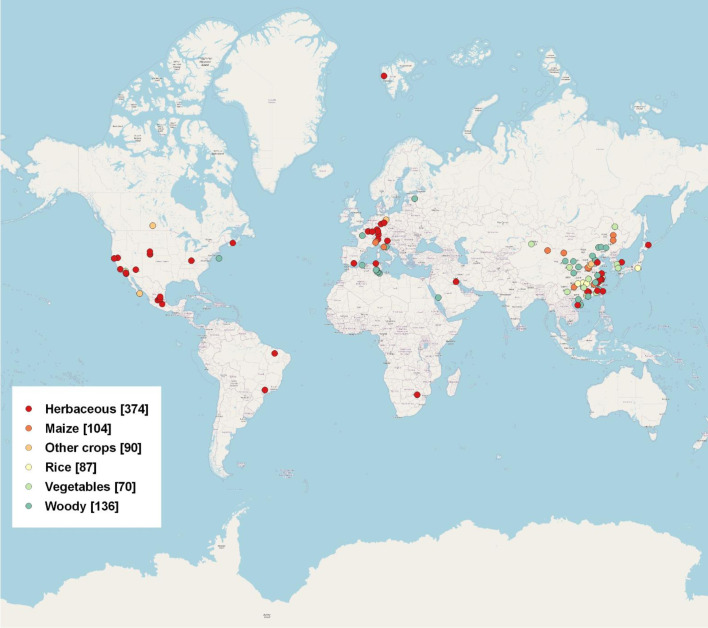
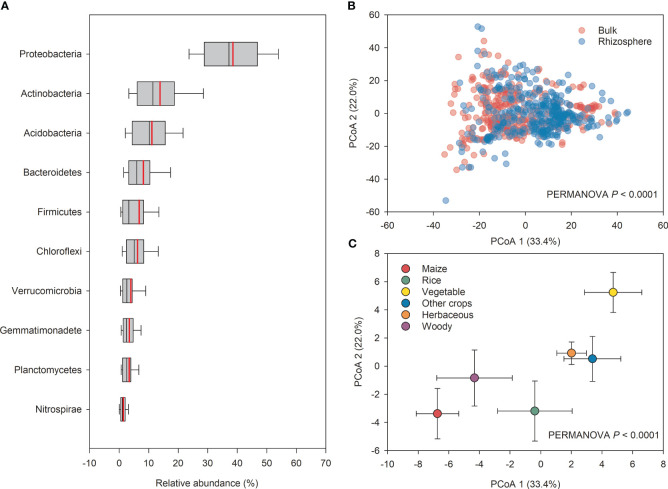
Over the years, microbial community composition in the rhizosphere has been extensively studied as the most fascinating topic in microbial ecology. In general, plants affect soil microbiota through rhizodeposits and changes in abiotic conditions. However, a consensus on the response of microbiota traits to the rhizosphere and bulk soils in various ecosystems worldwide regarding community diversity and structure has not been reached yet. Here, we conducted a meta-analysis of 101 studies to investigate the microbial community changes between the rhizosphere and bulk soils across various plant species (maize, rice, vegetables, other crops, herbaceous, and woody plants). Our results showed that across all plant species, plant rhizosphere effects tended to reduce the rhizosphere soil pH, especially in neutral or slightly alkaline soils. Beta-diversity of bacterial community was significantly separated between into rhizosphere and bulk soils. Moreover, r-strategists and copiotrophs (e.g. Proteobacteria and Bacteroidetes) enriched by 24-27% in the rhizosphere across all plant species, while K-strategists and oligotrophic (e.g. Acidobacteria, Gemmatimonadete, Nitrospirae, and Planctomycetes) decreased by 15-42% in the rhizosphere. Actinobacteria, Firmicutes, and Chloroflexi are also depleted by in the plant rhizosphere compared with the bulk soil by 7-14%. The Actinobacteria exhibited consistently negative effect sizes across all plant species, except for maize and vegetables. In Firmicutes, both herbaceous and woody plants showed negative responses to rhizosphere effects, but those in maize and rice were contrarily enriched in the rhizosphere. With regards to Chloroflexi, apart from herbaceous plants showing a positive effect size, the plant rhizosphere effects were consistently negative across all other plant types. Verrucomicrobia exhibited a significantly positive effect size in maize, whereas herbaceous plants displayed a negative effect size in the rhizosphere. Overall, our meta-analysis exhibited significant changes in microbial community structure and diversity responding to the plant rhizosphere effects depending on plant species, further suggesting the importance of plant rhizosphere to environmental changes influencing plants and subsequently their controls over the rhizosphere microbiota related to nutrient cycling and soil health.
Keywords: K-strategists; meta-analysis; microbiome; r-strategists; rhizosphere.
Copyright © 2023 Fu, Huang, Fu, Qiu, Zhao, Li, Wu, Yang, Liu, Yang and Chen.
Conflict of interest statement
The authors declare that the research was conducted in the absence of any commercial or financial relationships that could be construed as a potential conflict of interest.
Figures


Similar articles
-
[Root Activities of Re-Vegetated Plant Species Regulate Soil Nutrients and Bacterial Diversity in the Riparian Zone of the Three Gorges Reservoir].Huan Jing Ke Xue. 2020 Jun 8;41(6):2898-2907. doi: 10.13227/j.hjkx.201911214. Huan Jing Ke Xue. 2020. PMID: 32608807 Chinese.
-
The Composition and Diversity of the Rhizosphere Bacterial Community of Ammodendron bifolium Growing in the Takeermohuer Desert Are Different from Those in the Nonrhizosphere.Microb Ecol. 2023 Nov 27;87(1):2. doi: 10.1007/s00248-023-02320-9. Microb Ecol. 2023. PMID: 38008827
-
Metagenomic profiling of rhizosphere microbial community structure and diversity associated with maize plant as affected by cropping systems.Int Microbiol. 2021 Aug;24(3):325-335. doi: 10.1007/s10123-021-00169-x. Epub 2021 Mar 5. Int Microbiol. 2021. PMID: 33666787
-
Composition and Distribution Characteristics of Rhizosphere Bacterial Community of Ammodendron bifolium Growing in Takeermohuer Desert Are Different from Those in Non-rhizosphere.Microb Ecol. 2023 Nov;86(4):2461-2476. doi: 10.1007/s00248-023-02252-4. Epub 2023 Jun 10. Microb Ecol. 2023. PMID: 37301781
-
Nutrients in the rhizosphere: A meta-analysis of content, availability, and influencing factors.Sci Total Environ. 2022 Jun 20;826:153908. doi: 10.1016/j.scitotenv.2022.153908. Epub 2022 Feb 18. Sci Total Environ. 2022. PMID: 35183641 Review.
Cited by
-
Genotypic Identification of Trees Using DNA Barcodes and Microbiome Analysis of Rhizosphere Microbial Communities.Genes (Basel). 2024 Jul 1;15(7):865. doi: 10.3390/genes15070865. Genes (Basel). 2024. PMID: 39062644 Free PMC article.
-
Cereals can trap endophytic bacteria with potential beneficial traits when grown ex-situ in harsh soils.FEMS Microbiol Ecol. 2024 Apr 10;100(5):fiae041. doi: 10.1093/femsec/fiae041. FEMS Microbiol Ecol. 2024. PMID: 38544316 Free PMC article.
-
Fungal and Bacterial Community Dynamics in the Rhizosphere and Rhizoplane of Diabelia spathulata in Relation to Soil Properties.Mycobiology. 2025 Aug 7;53(5):605-619. doi: 10.1080/12298093.2025.2535775. eCollection 2025. Mycobiology. 2025. PMID: 40792181 Free PMC article.
-
Microbial Carbon Limitation Mediates Soil Organic Carbon Sequestration in Sugarcane-Watermelon Intercropping System.Microorganisms. 2025 Apr 30;13(5):1049. doi: 10.3390/microorganisms13051049. Microorganisms. 2025. PMID: 40431223 Free PMC article.
-
Soil properties and plant functional traits have different importance in shaping rhizosphere soil bacterial and fungal communities in a meadow steppe.mSystems. 2025 Aug 19;10(8):e0057025. doi: 10.1128/msystems.00570-25. Epub 2025 Jul 8. mSystems. 2025. PMID: 40626779 Free PMC article.
References
-
- Aira M., Gómez-Brandón M., Lazcano C., Bååth E., Domínguez J. (2010). Plant genotype strongly modifies the structure and growth of maize rhizosphere microbial communities. Soil Biol. Biochem. 42 (12), 2276–2281. doi: 10.1016/j.soilbio.2010.08.029 - DOI
-
- Barajas H. R., Martínez-Sánchez S., Romero M. F., Álvarez C. H., Servín-González L., Peimbert M., et al. (2020). Testing the two-step model of plant root microbiome acquisition under multiple plant species and soil sources. Front. Microbiol. 11, 2445. doi: 10.3389/fmicb.2020.542742 - DOI - PMC - PubMed
LinkOut - more resources
Full Text Sources