

Receiver operating characteristic curve analysis in diagnostic accuracy studies: A guide to interpreting the area under the curve value
- PMID: 38024184
- PMCID: PMC10664195
- DOI: 10.4103/tjem.tjem_182_23
Receiver operating characteristic curve analysis in diagnostic accuracy studies: A guide to interpreting the area under the curve value
Abstract
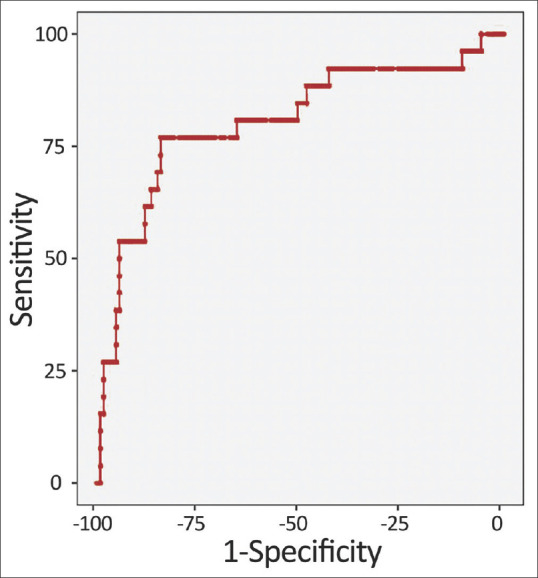
This review article provides a concise guide to interpreting receiver operating characteristic (ROC) curves and area under the curve (AUC) values in diagnostic accuracy studies. ROC analysis is a powerful tool for assessing the diagnostic performance of index tests, which are tests that are used to diagnose a disease or condition. The AUC value is a summary metric of the ROC curve that reflects the test's ability to distinguish between diseased and nondiseased individuals. AUC values range from 0.5 to 1.0, with a value of 0.5 indicating that the test is no better than chance at distinguishing between diseased and nondiseased individuals. A value of 1.0 indicates perfect discrimination. AUC values above 0.80 are generally consideredclinically useful, while values below 0.80 are considered of limited clinical utility. When interpreting AUC values, it is important to consider the 95% confidence interval. The confidence interval reflects the uncertainty around the AUC value. A narrow confidence interval indicates that the AUC value is likely accurate, while a wide confidence interval indicates that the AUC value is less reliable. ROC analysis can also be used to identify the optimal cutoff value for an index test. The optimal cutoff value is the value that maximizes the test's sensitivity and specificity. The Youden index can be used to identify the optimal cutoff value. This review article provides a concise guide to interpreting ROC curves and AUC values in diagnostic accuracy studies. By understanding these metrics, clinicians can make informed decisions about the use of index tests in clinical practice.
Keywords: Area under the curve; diagnostic study; receiver operating characteristic analysis; receiver operating characteristic curve.
Copyright: © 2023 Turkish Journal of Emergency Medicine.
Conflict of interest statement
None Declared.
Figures
References
-
- Knottnerus JA, Buntinx F. 2nd ed. Singapore: Wiley-Blackwell BMJ Books; 2009. The Evidence Base of Clinical Diagnosis: Theory and Methods of Diagnostic Research.
-
- Guyatt G. 3rd ed. New York: McGraw-Hill Education; 2015. Users’Guides to the Medical Literature: A Manual for Evidence-Based Clinical Practice.
-
- Akobeng AK. Understanding diagnostic tests 1: Sensitivity, specificity and predictive values. Acta Paediatr. 2007;96:338–41. - PubMed
-
- Akobeng AK. Understanding diagnostic tests 2: Likelihood ratios, pre- and post-test probabilities and their use in clinical practice. Acta Paediatr. 2007;96:487–91. - PubMed
LinkOut - more resources
Full Text Sources
Other Literature Sources