

Potential risk zones and climatic factors influencing the occurrence and persistence of avian influenza viruses in the environment of live bird markets in Bangladesh
- PMID: 38024265
- PMCID: PMC10665157
- DOI: 10.1016/j.onehlt.2023.100644
Potential risk zones and climatic factors influencing the occurrence and persistence of avian influenza viruses in the environment of live bird markets in Bangladesh
Abstract
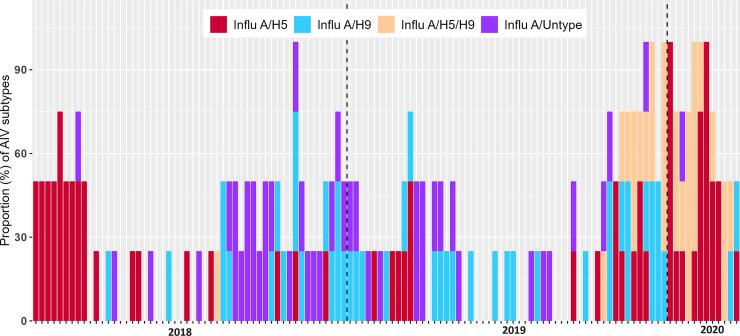
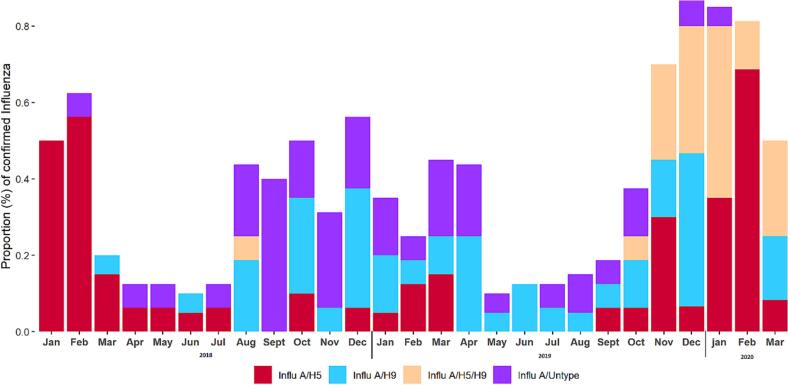
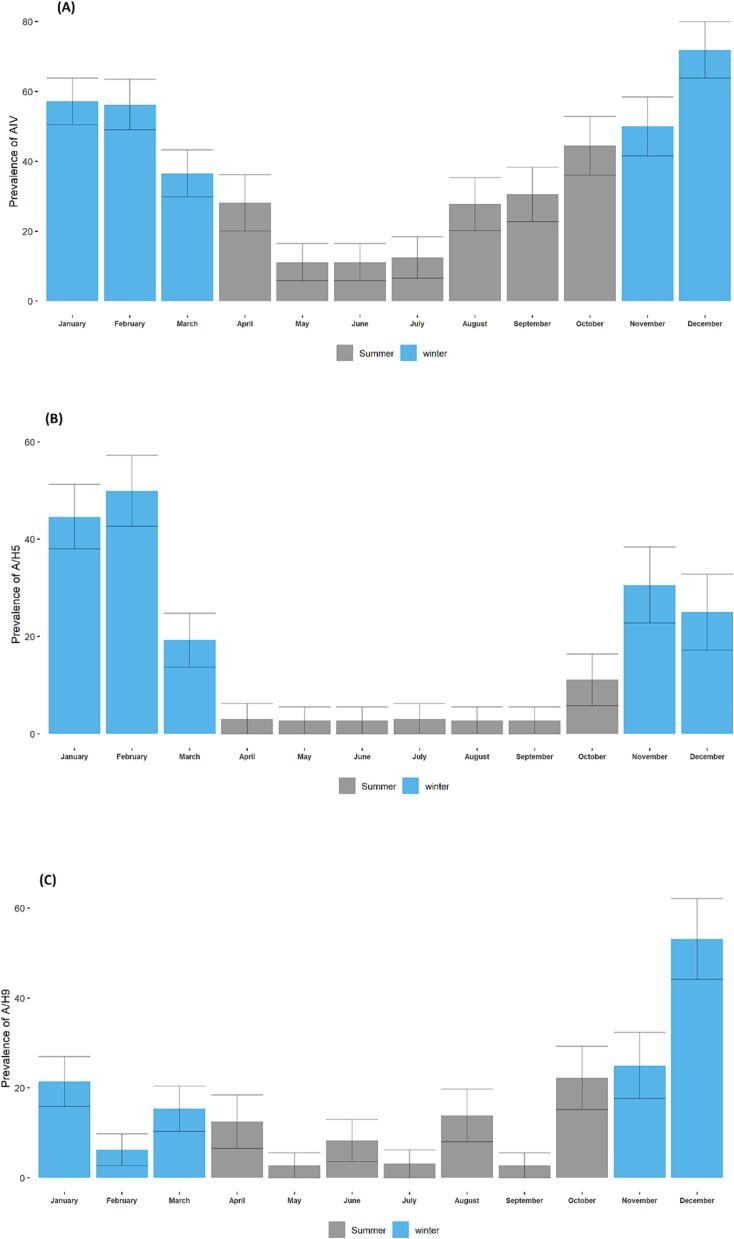
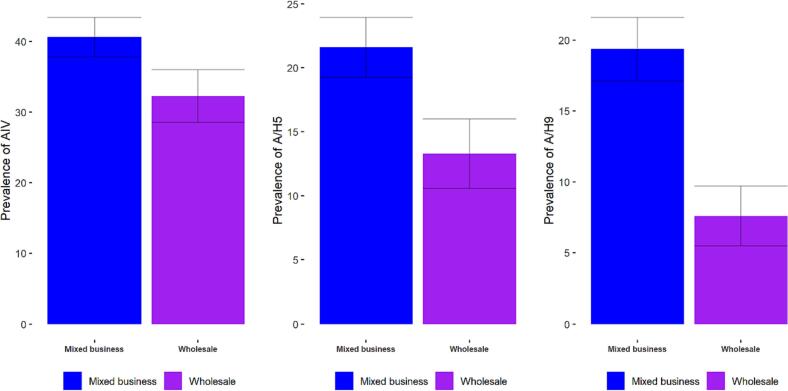
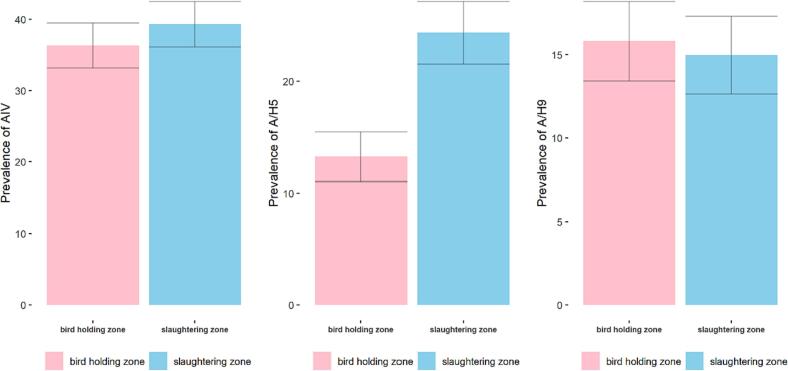
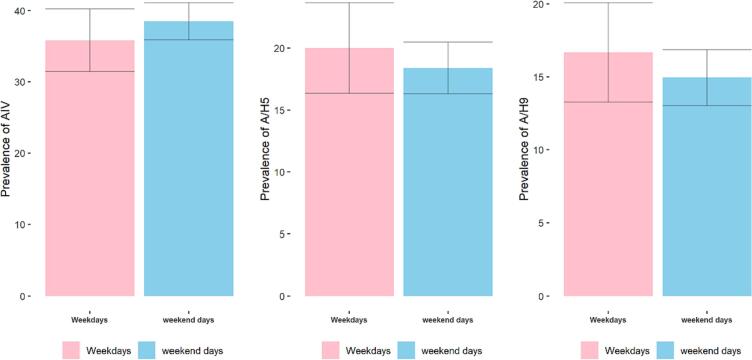
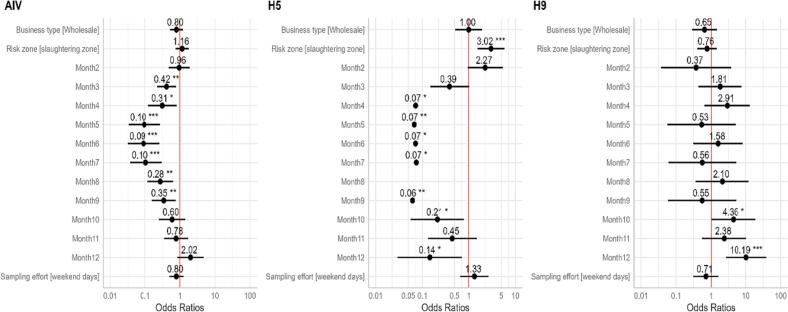
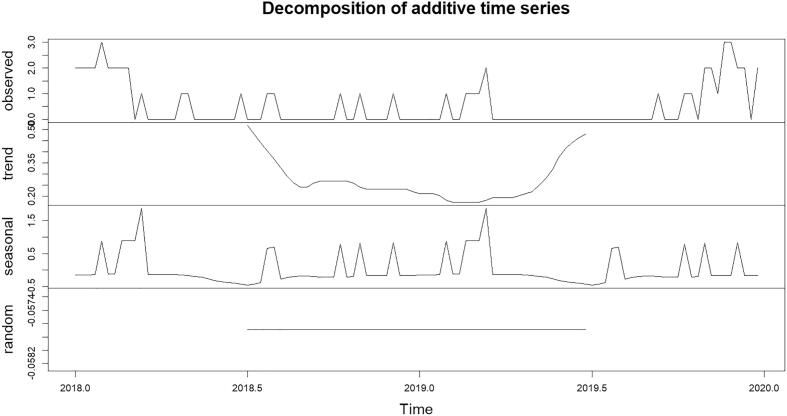
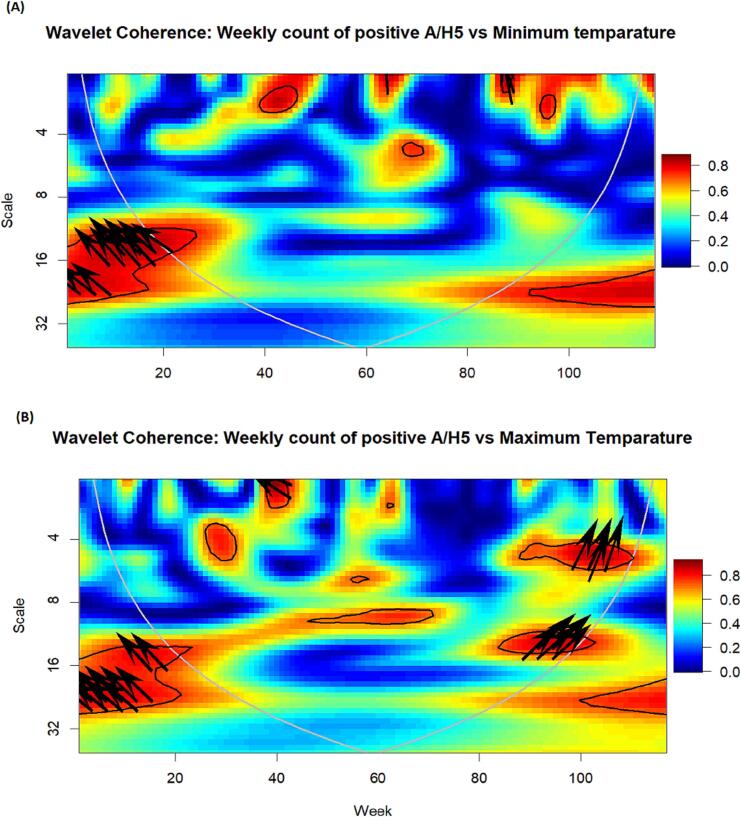
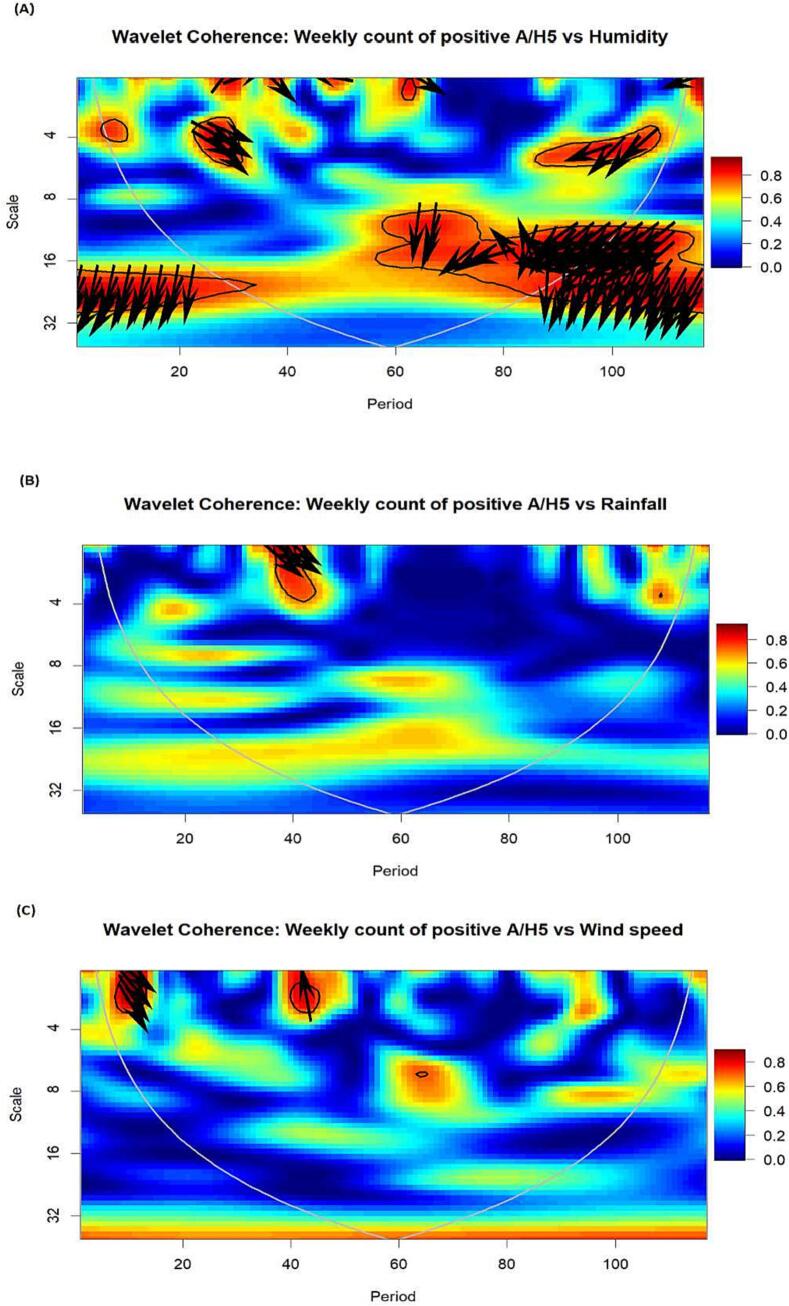
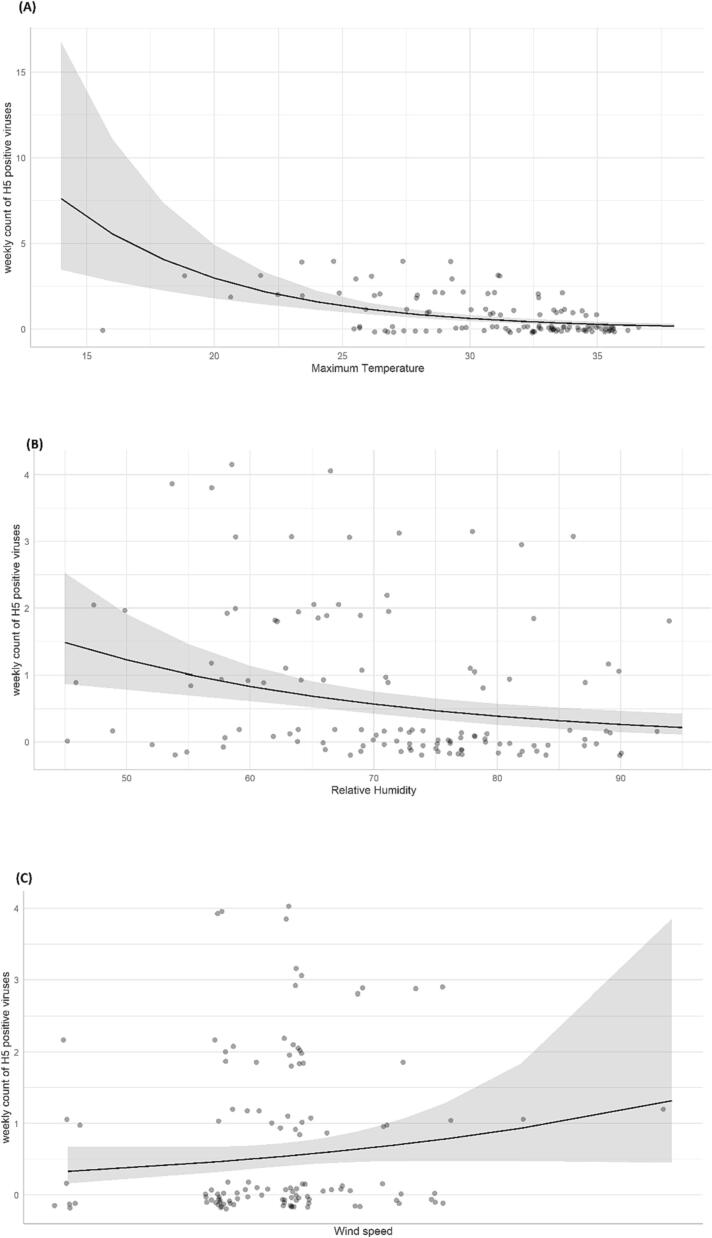
Live bird markets (LBMs) are critical for poultry trade in many developing countries that are regarded as hotspots for the prevalence and contamination of avian influenza viruses (AIV). Therefore, we conducted weekly longitudinal environmental surveillance in LBMs to determine annual cyclic patterns of AIV subtypes, environmental risk zones, and the role of climatic factors on the AIV presence and persistence in the environment of LBM in Bangladesh. From January 2018 to March 2020, we collected weekly fecal and offal swab samples from each LBM and tested using rRT-PCR for the M gene and subtyped for H5, H7, and H9. We used Generalized Estimating Equations (GEE) approaches to account for repeated observations over time to correlate the AIV prevalence and potential risk factors and the negative binomial and Poisson model to investigate the role of climatic factors on environmental contamination of AIV at the LBM. Over the study period, 37.8% of samples tested AIV positive, 18.8% for A/H5, and A/H9 was, for 15.4%. We found the circulation of H5, H9, and co-circulation of H5 and H9 in the environmental surfaces year-round. The Generalized Estimating Equations (GEE) model reveals a distinct seasonal pattern in transmitting AIV and H5. Specifically, certain summer months exhibited a substantial reduction of risk up to 70-90% and 93-94% for AIV and H5 contamination, respectively. The slaughtering zone showed a significantly higher risk of contamination with H5, with a three-fold increase in risk compared to bird-holding zones. From the negative binomial model, we found that climatic factors like temperature and relative humidity were also significantly associated with weekly AIV circulation. An increase in temperature and relative humidity decreases the risk of AIV circulation. Our study underscores the significance of longitudinal environmental surveillance for identifying potential risk zones to detect H5 and H9 virus co-circulation and seasonal transmission, as well as the imperative for immediate interventions to reduce AIV at LBMs in Bangladesh. We recommend adopting a One Health approach to integrated AIV surveillance across animal, human, and environmental interfaces in order to prevent the epidemic and pandemic of AIV.
Keywords: Contaminations; H9; HPAI H5; Meteorological factors; One health; Slaughtering zone; Surveillance; Zoonotic spillover.
© 2023 The Authors.
Conflict of interest statement
The authors declare that the research was conducted in the absence of any commercial or financial relationships that could be construed as a potential conflict of interest.
Figures
Similar articles
-
Annual trading patterns and risk factors of avian influenza A/H5 and A/H9 virus circulation in turkey birds (Meleagris gallopavo) at live bird markets in Dhaka city, Bangladesh.Front Vet Sci. 2023 Jul 4;10:1148615. doi: 10.3389/fvets.2023.1148615. eCollection 2023. Front Vet Sci. 2023. PMID: 37470075 Free PMC article.
-
Prevalence and risk factors for avian influenza virus (H5 and H9) contamination in peri-urban and rural live bird markets in Bangladesh.Front Public Health. 2023 Apr 20;11:1148994. doi: 10.3389/fpubh.2023.1148994. eCollection 2023. Front Public Health. 2023. PMID: 37151580 Free PMC article.
-
Live bird markets in Bangladesh as a potentially important source for Avian Influenza Virus transmission.Prev Vet Med. 2018 Aug 1;156:22-27. doi: 10.1016/j.prevetmed.2018.05.003. Epub 2018 May 2. Prev Vet Med. 2018. PMID: 29891142
-
Incidence of contamination of live bird markets in Bangladesh with influenza A virus and subtypes H5, H7 and H9.Transbound Emerg Dis. 2018 Jun;65(3):687-695. doi: 10.1111/tbed.12788. Epub 2017 Dec 10. Transbound Emerg Dis. 2018. PMID: 29226568
-
Patterns and risk factors of avian influenza A(H5) and A(H9) virus infection in pigeons and quail at live bird markets in Bangladesh, 2017-2021.Front Vet Sci. 2022 Oct 26;9:1016970. doi: 10.3389/fvets.2022.1016970. eCollection 2022. Front Vet Sci. 2022. PMID: 36387379 Free PMC article.
Cited by
-
Active surveillance of avian influenza in the southwestern Poyang Lake area, China: Analyzing changes in wholesale and frozen fresh retail markets post-policy implementation.Poult Sci. 2025 Jan;104(1):104486. doi: 10.1016/j.psj.2024.104486. Epub 2024 Nov 1. Poult Sci. 2025. PMID: 39577173 Free PMC article.
-
Detection and prevalence of avian influenza epidemic in the southwest of Poyang Lake and analysis of the influence of meteorological factors.One Health. 2025 Apr 21;20:101047. doi: 10.1016/j.onehlt.2025.101047. eCollection 2025 Jun. One Health. 2025. PMID: 40331080 Free PMC article.
-
Transmission Pathways of Zoonotic Influenza Viruses and Influencing Factors: A Systematic Review of Recent Findings.Viruses. 2025 Jun 17;17(6):857. doi: 10.3390/v17060857. Viruses. 2025. PMID: 40573448 Free PMC article. Review.
-
Association of biosecurity and hygiene practices with avian influenza A/H5 and A/H9 virus infections in turkey farms.Front Vet Sci. 2024 Mar 14;11:1319618. doi: 10.3389/fvets.2024.1319618. eCollection 2024. Front Vet Sci. 2024. PMID: 38550782 Free PMC article.
-
Integrating Citizen Science and Remote Sensing Data to Identify Key Environmental Factors Influencing H5N1 Avian Influenza Virus Potential Spillover Risk in the Philippines.Geohealth. 2025 Aug 7;9(8):e2025GH001405. doi: 10.1029/2025GH001405. eCollection 2025 Aug. Geohealth. 2025. PMID: 40777847 Free PMC article.
References
LinkOut - more resources
Full Text Sources
