

Fecal microbiota transplantation plus tislelizumab and fruquintinib in refractory microsatellite stable metastatic colorectal cancer: an open-label, single-arm, phase II trial (RENMIN-215)
- PMID: 38024475
- PMCID: PMC10679864
- DOI: 10.1016/j.eclinm.2023.102315
Fecal microbiota transplantation plus tislelizumab and fruquintinib in refractory microsatellite stable metastatic colorectal cancer: an open-label, single-arm, phase II trial (RENMIN-215)
Abstract
Background: Immunotherapy has revolutionized the treatment of cancer. However, microsatellite stable (MSS) metastatic colorectal cancer (mCRC) shows a low response to PD-1 inhibitors. Antiangiogenic therapy can enhance anti-PD-1 efficacy, but it still cannot meet clinical needs. Increasing evidence supported a close relationship between gut microbiome and anti-PD-1 efficacy. This study aimed to explore the efficacy and safety of the combination of fecal microbiota transplantation (FMT) and tislelizumab and fruquintinib in refractory MSS mCRC.
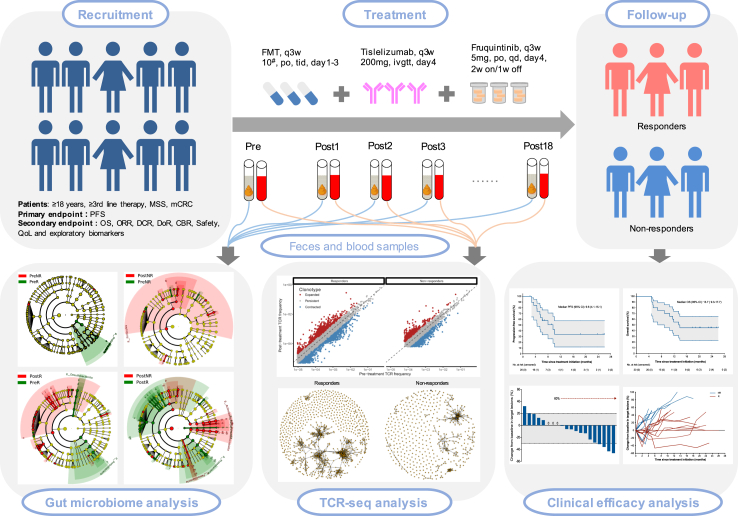
Methods: In the phase II trial, MSS mCRC patients were administered FMT plus tislelizumab and fruquintinib as a third-line or above treatment. The primary endpoint was progression-free survival (PFS). Secondary endpoints were overall survival (OS), objective response rate (ORR), disease control rate (DCR), duration of response (DoR), clinical benefit rate (CBR), safety and quality of life. Feces and peripheral blood were collected for exploratory biomarker analysis. This study is registered with Chictr.org.cn, identifier ChiCTR2100046768.
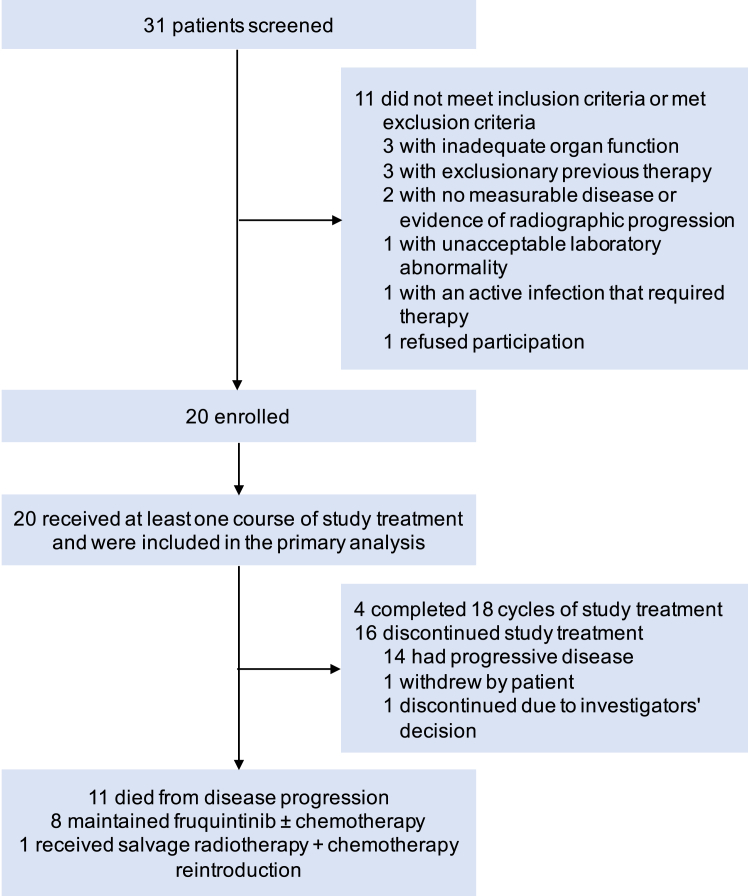
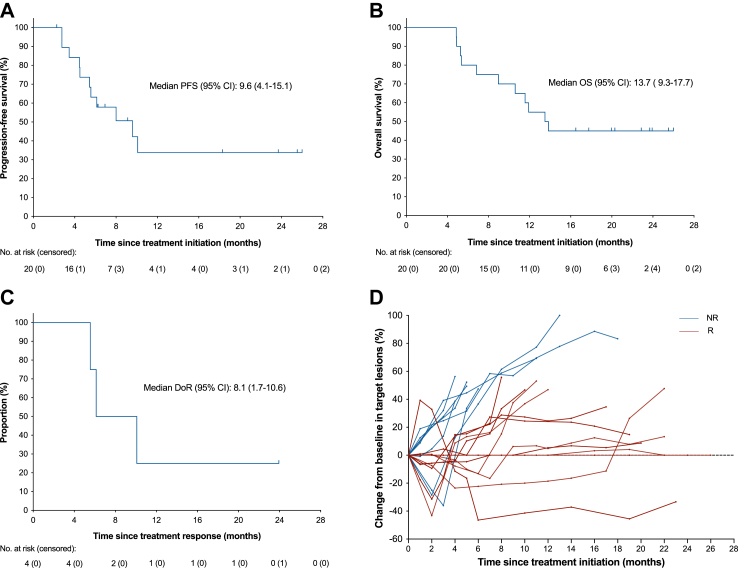
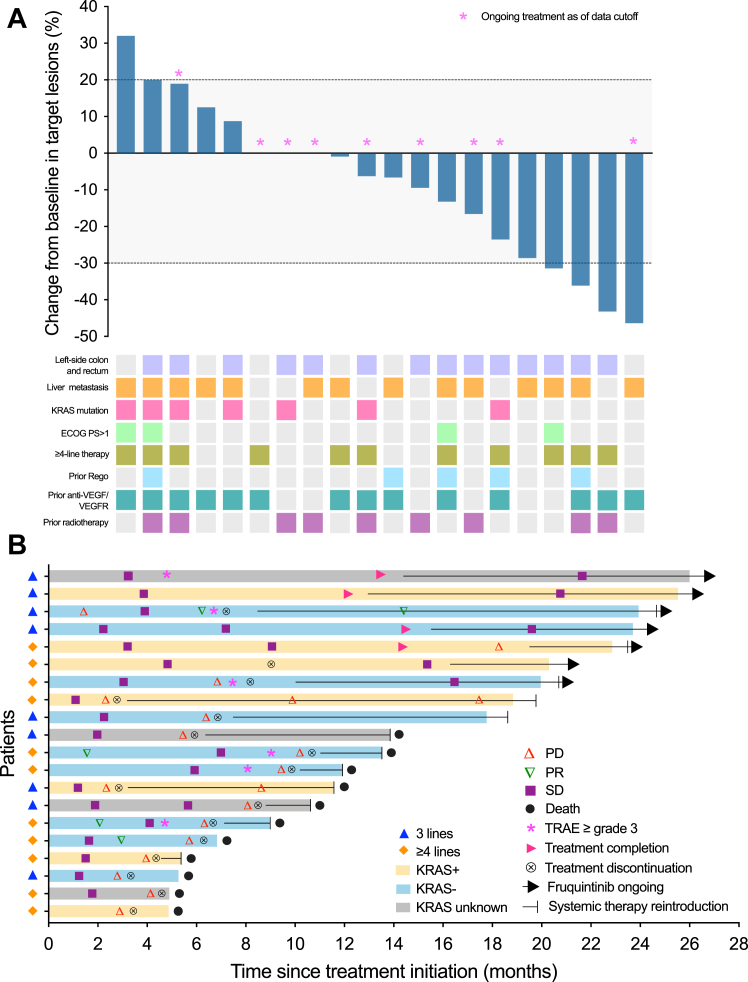
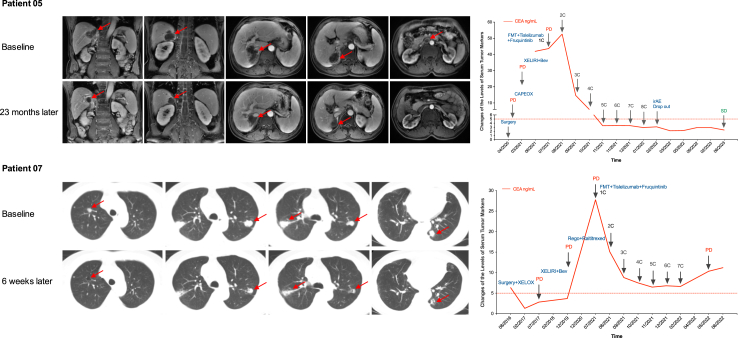
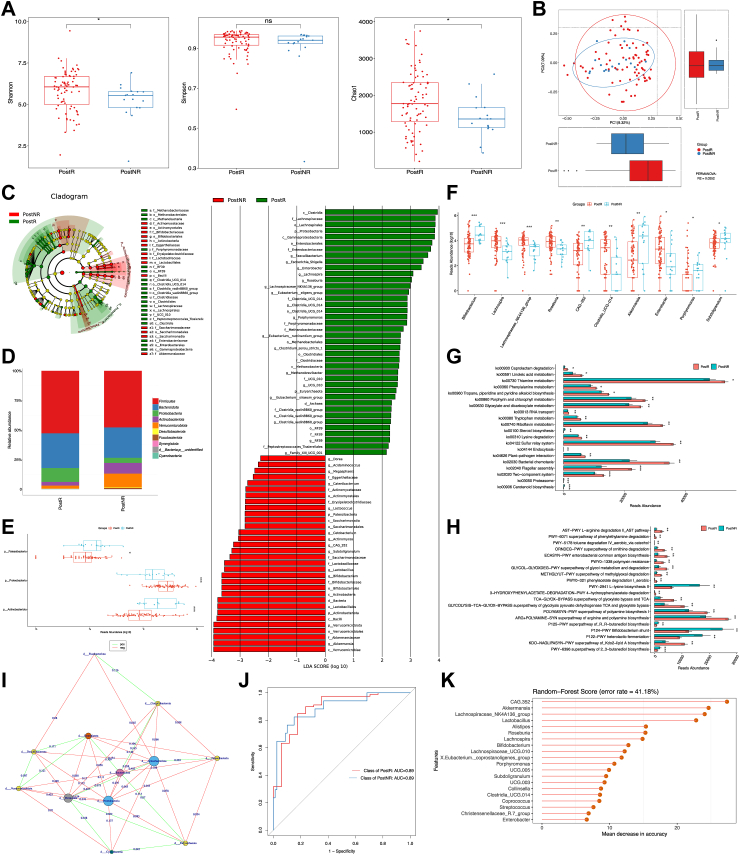
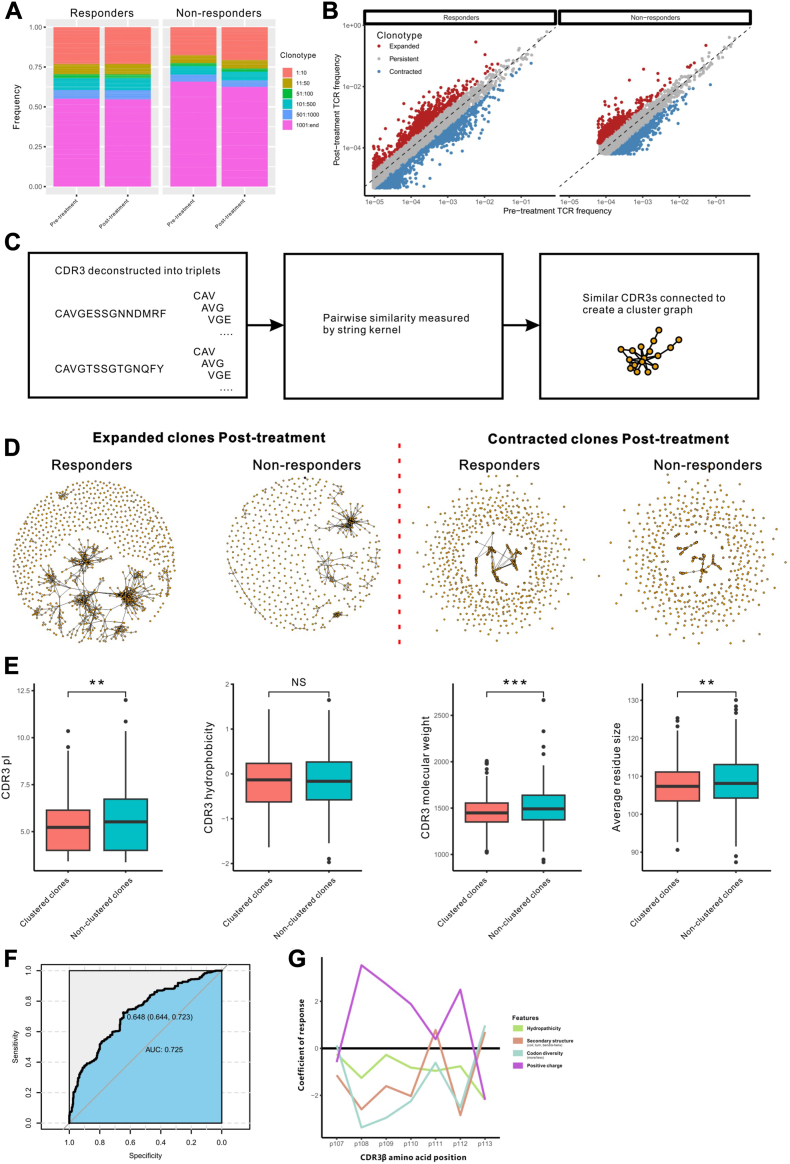
Findings: From May 10, 2021 to January 17, 2022, 20 patients were enrolled. Median follow-up was 13.7 months. Median PFS was 9.6 months (95% CI 4.1-15.1). Median OS was 13.7 months (95% CI 9.3-17.7). Median DoR was 8.1 months (95% CI 1.7-10.6). ORR was 20% (95% CI 5.7-43.7). DCR was 95% (95% CI 75.1-99.9). CBR was 60% (95% CI 36.1-80.9). Nineteen patients (95%) experienced at least one treatment-related adverse event (TRAE). Six patients (30%) had grade 3-4 TRAEs, with the most common being albuminuria (10%), urine occult blood (10%), fecal occult blood (10%), hypertension (5%), hyperglycemia (5%), liver dysfunction (5%), hand-foot skin reaction (5%), and hypothyroidism (5%). No treatment-related deaths occurred. Responders had a high-abundance of Proteobacteria and Lachnospiraceae family and a low-abundance of Actinobacteriota and Bifidobacterium. The treatment did not change the structure of peripheral blood TCR repertoire. However, the expanded TCRs exhibited the characteristics of antigen-driven responses in responders.
Interpretation: FMT plus tislelizumab and fruquintinib as third-line or above treatment showed improved survival and manageable safety in refractory MSS mCRC, suggesting a valuable new treatment option for this patient population.
Funding: This study was supported by the National Natural Science Foundation of China (82102954 to Wensi Zhao) and the Special Project of Central Government for Local Science and Technology Development of Hubei Province (ZYYD2020000169 to Yongshun Chen).
Keywords: Fecal microbiota transplantation; Fruquintinib; Metastatic colorectal cancer; Microsatellite stable; Tislelizumab.
© 2023 The Author(s).
Conflict of interest statement
The authors declare no conflicts of interest.
Figures
References
-
- Sung H., Ferlay J., Siegel R.L., et al. Global cancer statistics 2020: GLOBOCAN estimates of incidence and mortality worldwide for 36 cancers in 185 countries. CA Cancer J Clin. 2021;71(3):209–249. - PubMed
-
- Benson A.B., Venook A.P., Al-Hawary M.M., et al. Colon cancer, version 2.2021, NCCN clinical practice guidelines in oncology. J Natl Compr Canc Netw. 2021;19(3):329–359. - PubMed
-
- Benson A.B., Venook A.P., Al-Hawary M.M., et al. Rectal cancer, version 2.2022, NCCN clinical practice guidelines in oncology. J Natl Compr Canc Netw. 2022;20(10):1139–1167. - PubMed
-
- Biller L.H., Schrag D. Diagnosis and treatment of metastatic colorectal cancer: a review. JAMA. 2021;325(7):669–685. - PubMed
-
- Grothey A., Van Cutsem E., Sobrero A., et al. Regorafenib monotherapy for previously treated metastatic colorectal cancer (CORRECT): an international, multicentre, randomised, placebo-controlled, phase 3 trial. Lancet (London, England) 2013;381(9863):303–312. - PubMed
LinkOut - more resources
Full Text Sources
Miscellaneous
