. 2023 Aug 19;8(11):2345-2355.
doi: 10.1016/j.ekir.2023.08.006. eCollection 2023 Nov.

Assessing GFR With Proenkephalin

Affiliations

Assessing GFR With Proenkephalin

Remi Beunders et al. Kidney Int Rep. .

Abstract

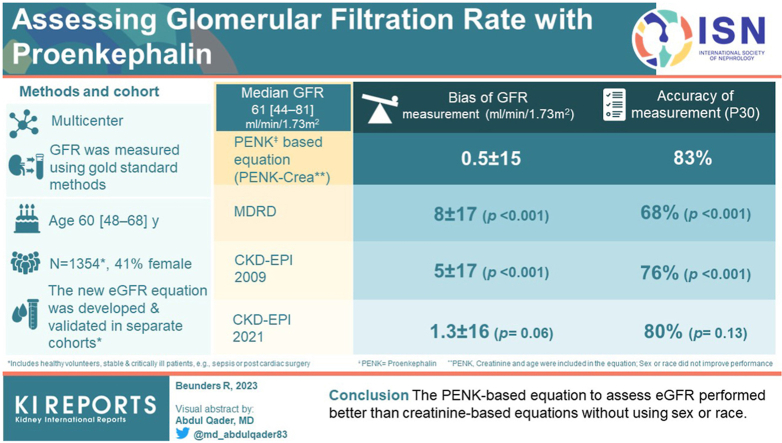
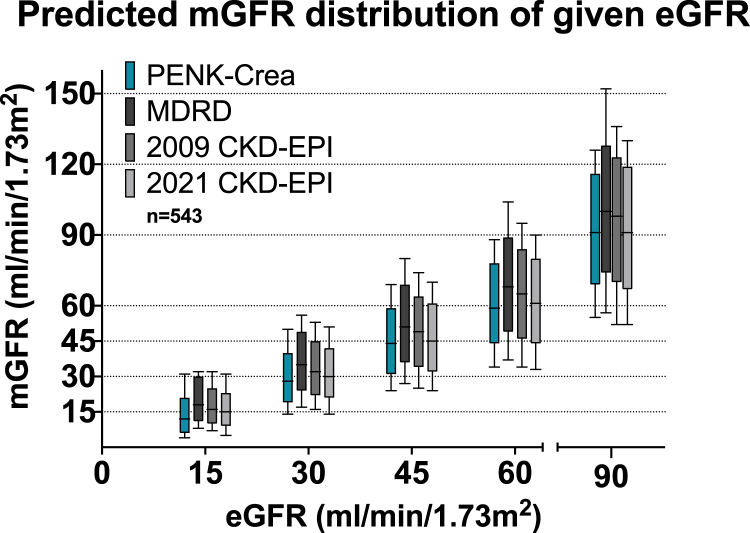
Introduction: In clinical practice, kidney (dys)function is monitored through creatinine-based estimations of glomerular filtration rate (eGFR: Modification of Diet in Renal Disease [MDRD], Chronic Kidney Disease Epidemiology Collaboration [CKD-EPI]). Creatinine is recognized as a late and insensitive biomarker of glomerular filtration rate (GFR). The novel biomarker proenkephalin (PENK) may overcome these limitations, but no PENK-based equation for eGFR is currently available. Therefore, we developed and validated a PENK-based equation to assess GFR.

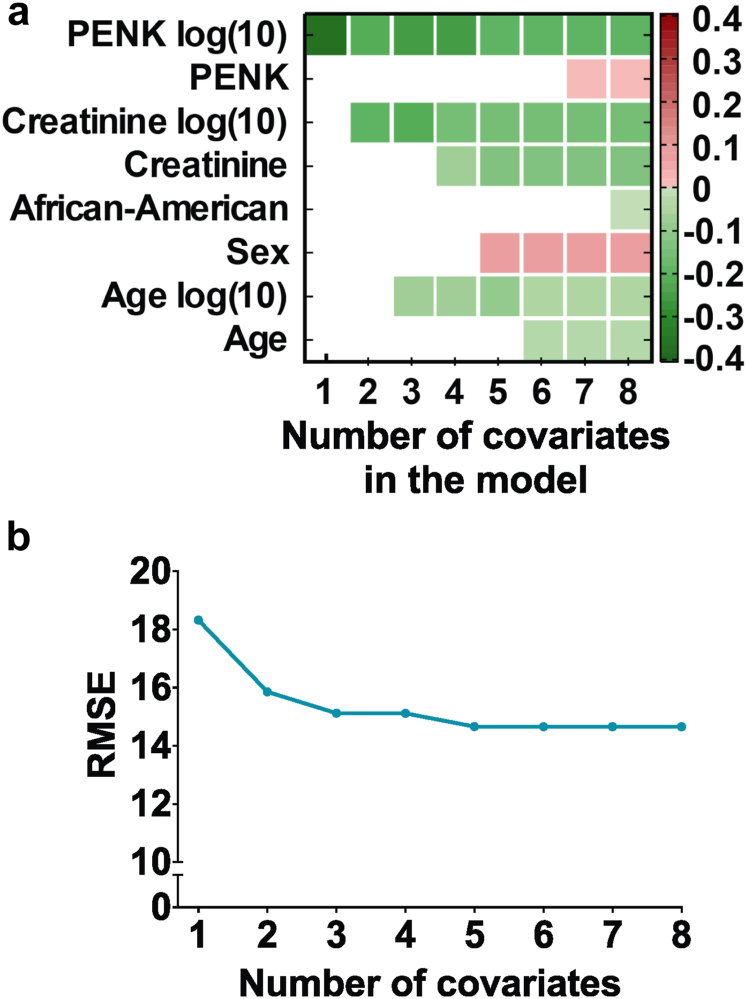
Methods: In this international multicenter study in 1354 stable and critically ill patients, GFR was measured (mGFR) through iohexol or iothalamate clearance. A generalized linear model with sigmoidal nonlinear transfer function was used for equation development in the block-randomized development set. Covariates were selected in a data-driven fashion. The novel equation was assessed for bias, precision (mean ± SD), and accuracy (eGFR percentage within ±30% of mGFR, P30) in the validation set and compared with MDRD and CKD-EPI.

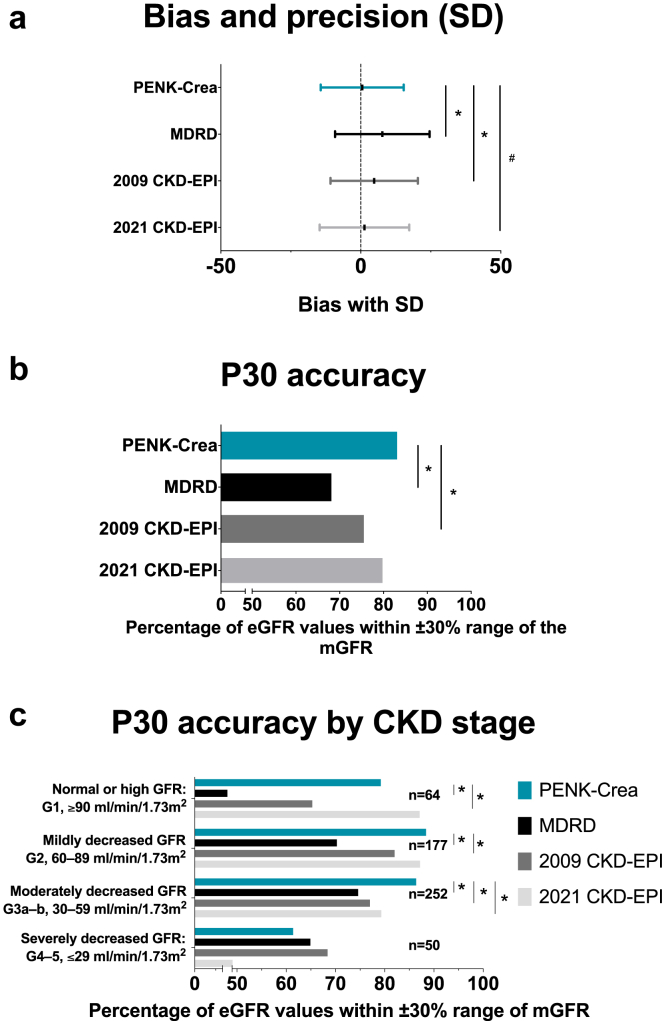
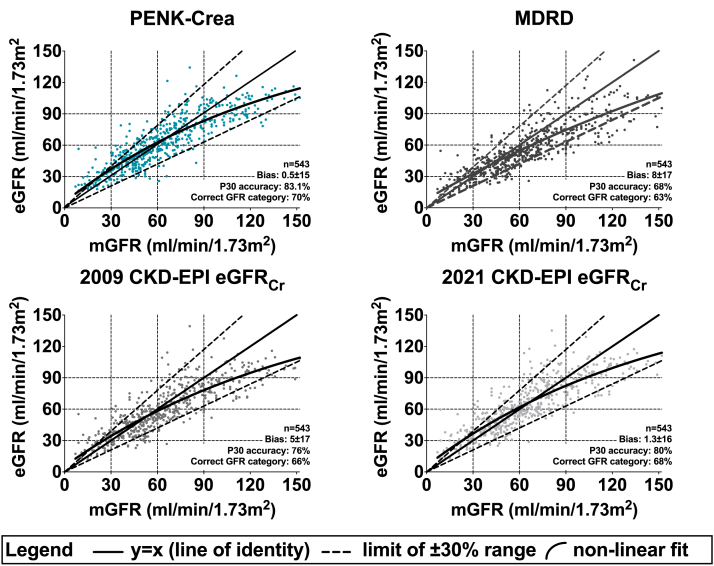
Results: Median mGFR was 61 [44-81] ml/min per 1.73 m2. In order of importance, PENK, creatinine, and age were included, and sex or race did not improve performance. The PENK-based equation mean ± SD bias of the mGFR was 0.5 ± 15 ml/min per 1.73 m2, significantly less compared with MDRD (8 ± 17, P < 0.001) and 2009 CKD-EPI (5 ± 17, P < 0.001), not reaching statistical significance compared with 2021 CKD-EPI (1.3 ± 16, P = 0.06). The P30 accuracy of the PENK-based equation was 83%, significantly higher compared with MDRD (68%, P < 0.001) and 2009 CKD-EPI (76%, P < 0.001), similar to 2021 CKD-EPI (80%, P = 0.13).

Conclusion: Overall, the PENK-based equation to assess eGFR performed better than most creatinine-based equations without using sex or race.

Keywords: acute kidney injury; creatinine; estimated glomerular filtration rate; gold standard; kidney function; proenkephalin.


Figures

None
Graphical abstract
Figure 1
Figure 1
Equation development. (a) Figure with on the y-axis eight different covariates, with their color representing the β-coefficient as depicted in the legend. On the x-axis is the number of the covariate in the model. A higher coefficient represents a higher positive correlation of the covariate with the GFR. In a stepwise iterative removal method, covariates were first all included in the model and then removed in the sequence of importance, starting with the lowest contribution to the model's performance (African-American). The most important covariates were log(10) proenkephalin, log(10) creatinine, and age log(10). (b) RMSE (Root Mean Square Error) of the model with on the x-axis the number of covariates on the model. The covariates were added in a stepwise-enter method, in the sequence of importance, starting with log(10) proenkephalin. A lower RMSE value illustrates a more accurate predicting model. After adding covariate log (10) proenkephalin, log(10) creatinine, and log(10) age, the RMSE does not significantly improve any further. PENK, proenkephalin.
Figure 2
Figure 2
An overview of the performance of the PENK-Crea and the MDRD and CKD-EPI equations. (a) Mean bias in ml/min/1.73 m2 with SD from the measured GFR (mGFR) of all equations. The estimations of the GFR calculated with PENK-Crea had a significantly lower mean±SD bias compared to the mGFR than the MDRD: P < 0.001 and 2009 CKD-EPI: P < 0.001, and a borderline significant difference with the 2021 CKD-EPI (P = 0.06). (b) P30 accuracy (proportion of estimated GFR (eGFR) that is within ±30% of the mGFR) of the 3 equations. When using the PENK-Crea, the GFR estimations were significantly more accurate compared to the MDRD (P < 0.001) and 2009 CKD-EPI (P < 0.001), not to the 2021 CKD-EPI (P = 0.13). (c) The P30 accuracy (proportion of eGFR that is within ±30% of the measured GFR) of the PENK-Crea equation compared to eGFR based on MDRD and CKD-EPI equations. The patients are categorized on their mGFR using the KDIGO CKD classification, which was combined to prevent small groups. PENK-Crea had a higher accuracy in the category “G1, ≥90 ml/min/1.73 m2” compared to MDRD (P < 0.001), 2009 CKD-EPI (P = 0.02), and similar to the 2021 CKD-EPI (P = 0.10). PENK-Crea had a higher accuracy in the category “G2, 60–89 ml/min/1.73 m2” compared to MDRD (P < 0.001), 2009 CKD-EPI (P = 0.04), and similar to 2021 CKD-EPI (P = 0.86). PENK-Crea had the highest accuracy in the category “G3a–b, 30–59 ml/min/1.73 m2” (MDRD: P < 0.001, 2009 CKD-EPI: P = 0.002 and 2021 CKD-EPI: P = 0.03). In categories “G4–5, ≤29 ml/min/1.73 m2,” there was no statistical difference (MDRD: P = 0.77, 2009 CKD-EPI: P = 0.39, and 2021 CKD-EPI: P = 0.09). GFR, glomerular filtration rate.
Figure 3
Figure 3
Scatter plots of the estimated GFR of all equations versus the measured GFR. Scatter plot of the association between the glomerular filtration rate measured by iohexol or iothalamate clearance (mGFR) and the eGFR calculated using the PENK-Crea equation, the conventional MDRD and 2009 CKD-EPI equations and the new 2021 CKD-EPI equation (eGFR) in the validation cohort. Bias is defined as the mean difference with standard deviation (in ml/min/1.73 m2), P30 accuracy as the percentage of estimated GFRs that is within a ±30% range of the mGFR, and correct GFR category as the percentage of patients that are correctly classified in GFR categories (all in ml/min/1.73 m2): “G4–5, ≤29 ml/min/1.73 m2,” “G3a–b, 30–59 ml/min/1.73 m2,” G2, “60–89 ml/min/1.73 m2,” and “G1, ≥90 ml/min/1.73 m2.” The nonlinear fit is calculated using a 2-phase association. GFR, glomerular filtration rate.
Figure 4
Figure 4
Distribution of the predicted mGFR at given eGFR cut-off points. To enable clinical decision making, this figure depicts the range of predicted mGFR of a patient with a given eGFR using the CKD staging cut-off points. The mGFR was predicted using a model created using quintile regression of each of the 4 equations PENK-Crea, MDRD, 2009 CKD-EPI and 2021 CKD-EPI. The Box Plots represent quantiles (minimum, first quartile, median, third quartile, and maximum) of each equation. The performance of an equation is better when the median of the predicted mGFR is closest to the given eGFR cut-off points, and when the distribution of the predicted mGFR is more narrow at that eGFR cut-off point. As an example, with an eGFR of 60 ml/min/1.73 m2 calculated with the PENK-Crea equation, 95% of the mGFR’s will be in the range of 34–88. While an eGFR of 60 calculated with the MDRD equation, 95% of the mGFR’s will be between the range of 37–104. mGFR or eGFR: measured or estimated glomerular filtration rate. CKD-EPI, Chronic Kidney Disease Epidemiology Collaboration; MDRD, Modification of Diet in Renal Disease.

References

    1. Levey A.S., Coresh J., Greene T., et al. Expressing the modification of diet in renal disease study equation for estimating glomerular filtration rate with standardized serum creatinine values. Clin Chem. 2007;53:766–772. doi: 10.1373/clinchem.2006.077180. - DOI - PubMed
    1. Stevens L.A., Levey A.S. Measured GFR as a confirmatory test for estimated GFR. J Am Soc Nephrol. 2009;20:2305–2313. doi: 10.1681/ASN.2009020171. - DOI - PubMed
    1. Inker L.A., Eneanya N.D., Coresh J., et al. New creatinine- and cystatin C-based equations to estimate GFR without race. N Engl J Med. 2021;385:1737–1749. doi: 10.1056/NEJMoa2102953. - DOI - PMC - PubMed
    1. Stevens L.A., Levey A.S. Measurement of kidney function. Med Clin North Am. 2005;89:457–473. doi: 10.1016/j.mcna.2004.11.009. - DOI - PubMed
    1. Delanaye P., Cavalier E., Pottel H. Serum creatinine: not so simple. Nephron. 2017;136:302–308. doi: 10.1159/000469669. - DOI - PubMed