. 2023 Oct 28;26(11):108331.
doi: 10.1016/j.isci.2023.108331. eCollection 2023 Nov 17.

Derived myeloid lineage induced pluripotent stem as a platform to study human C-C chemokine receptor type 5Δ32 homozygotes

Affiliations

Derived myeloid lineage induced pluripotent stem as a platform to study human C-C chemokine receptor type 5Δ32 homozygotes

Guibin Chen et al. iScience. .

Abstract

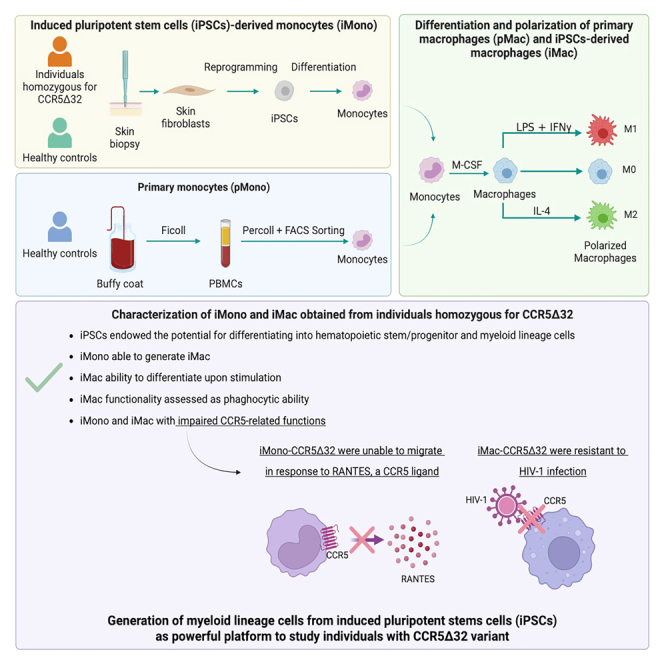
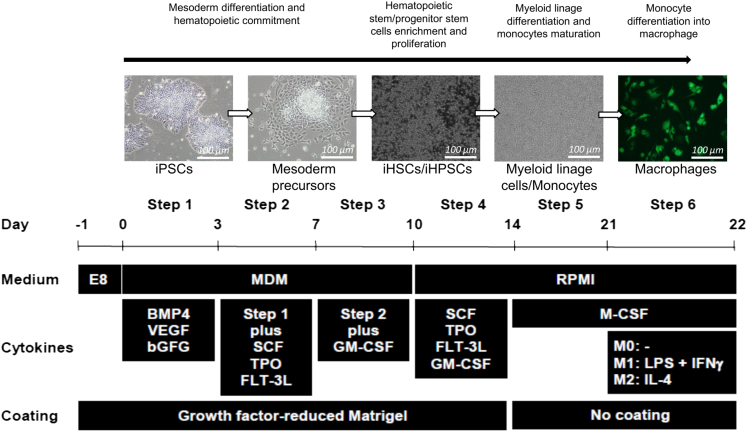
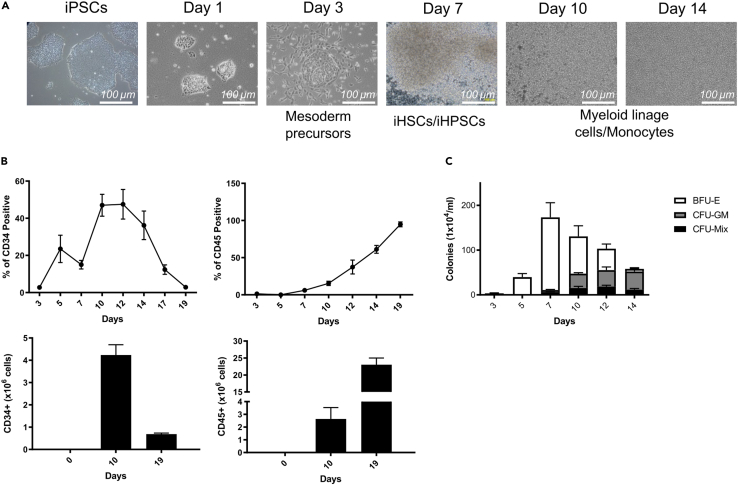
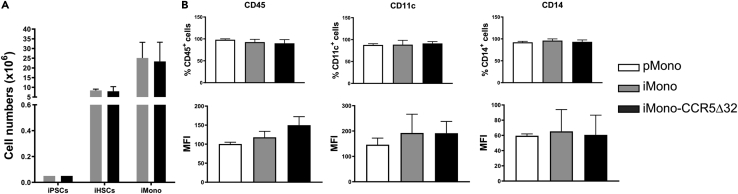
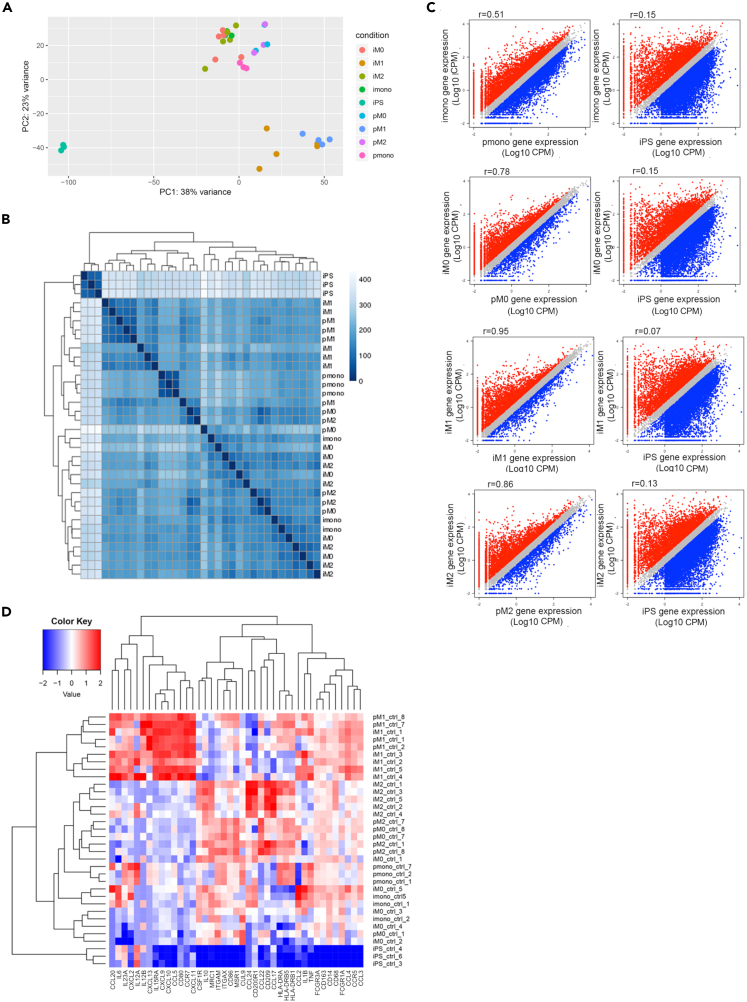
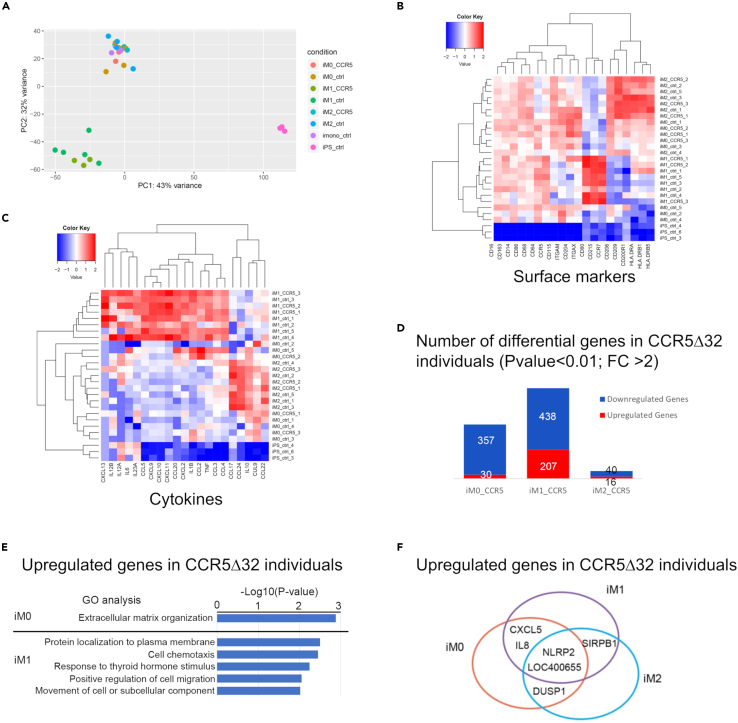
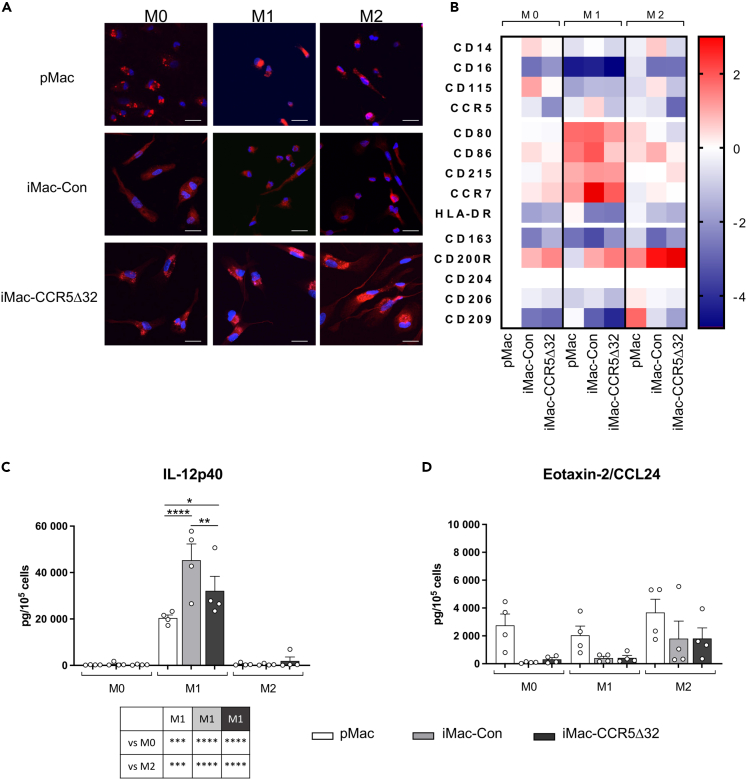
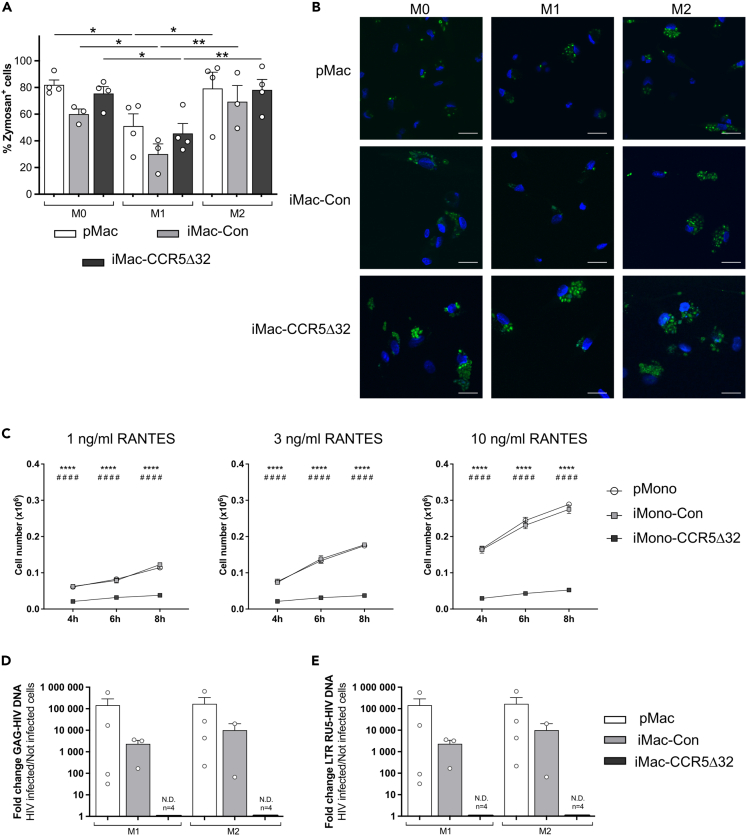
The C-C chemokine receptor type 5 (CCR5) expressed on immune cells supports inflammatory responses by directing cells to the inflammation site. CCR5 is also a major coreceptor for macrophage tropic human immunodeficiency viruses (R5-HIV-1) and its variants can confer protection from HIV infection, making it an ideal candidate to target for therapy. We developed a stepwise protocol that differentiates induced pluripotent stem cells (iPSCs) from individuals homozygous for the CCR5Δ32 variant and healthy volunteers into myeloid lineage induced monocytes (iMono) and macrophages (iMac). By characterizing iMono and iMac against their primary counterparts, we demonstrated that CCR5Δ32 homozygous cells are endowed with similar pluripotent potential for self-renewal and differentiation as iPSC lines generated from non-variant individuals while also showing resistance to HIV infection. In conclusion, these cells are a platform to investigate CCR5 pathophysiology in HIV-positive and negative individuals and to help develop novel therapies.

Keywords: Immunology; Molecular biology; Stem cells research.


Conflict of interest statement

LGB is a member of the Illumina Medical Ethics Committee and receives research funding from Merck, Inc. All the other authors declare no competing interests. The section of “In vitro differentiation of iPSCs in hematopoietic linage cells” described in manuscript is registered under a patent “Human iPSC-derived vascular-related and hematopoietic cells for therapies and toxicology/drug screenings” (patent number #10385313 and 11072778). GC and MB receive royalty income.

Figures

None
Graphical abstract
Figure 1
Figure 1
Generation in fully defined condition of hematopoietic lineage cells in suspension from normal iPSCs Schematic representation of iPSC differentiation toward hematopoietic cells and then further maturation of myeloid lineage cells/monocytes and their following differentiation in macrophages (scale bar: 100 μm).
Figure 2
Figure 2
Characterization of hematopoietic lineage cells derived from iPSCs (A) Representative photographs showing the morphological changes observed during the differentiation of iPSCs toward iHSPCs and myeloid lineage cells. One photo for each time point is shown (scale bar: 100 μm). (B) Frequency of CD34+ and CD45+ cells (upper row) and cumulative CD34+ and CD45+ cell yield (lower row) was assessed at different time points during iPSCs differentiation toward hematopoietic lineage cells. (C) Proliferation ability and differentiation potential of iHSPCs were assessed in vitro by Colony-forming units (CFUs) assay. The number of Burst-forming unit-erythroid (BFU-E), granulocyte-macrophage progenitor cells (CFU-GM), and multipotential granulocyte, erythroid, macrophage and megakaryocyte progenitor cells (CFU-GEMM, or CFU-Mix) was evaluated at different time points during iPSC differentiation. Data are expressed as number of colonies (x104)/mL. Data are presented as mean ± SD (n = 6). Statistical significance was calculated using ANOVA. See also Figures S1 and S2.
Figure 3
Figure 3
Validation of iPSC-derived monocytes (iMono) (A) Total number of iHSPCs and iMono generated during the differentiation of iPSCs of healthy controls (light gray bar, n = 6) and CCR5Δ32 individuals (dark gray bar, n = 6). Data are expressed as number of cells (x106). (B) Surface expression of CD45, CD11c and CD14 in primary monocytes (pMono, white bar, n = 6) and iMono generated during the differentiation of iPSCs of controls (iMono-Con, light gray bar, n = 6) and CCR5Δ32 individuals (iMono-CCR5Δ32, dark gray bar, n = 6). Data are expressed as frequency of positive cells (upper row) and Mean Fluorescence Intensity (MFI) (lower row). Data are presented as mean ± SD. Statistical significance was calculated using ANOVA.
Figure 4
Figure 4
Similarity of transcriptome between primary and iPSC-derived monocytes and macrophages Analyses were performed based on RNA-seq data for both primary (p) and iMono and iMacrophages (M0, M1, and M2 according to sample polarization) samples. (A) PCA analyses based on transcriptome for all healthy control RNA-seq samples. (B) Hierarchical clustering based on transcriptome among all healthy control samples. (C) Scatterplot of gene expression levels between primary monocytes and macrophages and iPSC-derived monocytes and macrophages. Comparison between iPSC-derived monocytes and macrophages and iPSCs were also shown as a control. Genes that are highly expressed in iPSC-derived samples are shown in red and genes that are highly expressed in primary monocytes and macrophages or iPSCs are shown in blue. (D) Heatmap of genes associated with macrophages functions. Columns represent genes, and rows represent samples. See also Table S1.
Figure 5
Figure 5
Comparison of iPSC-derived macrophages between individuals homozygous for the CCR5Δ32 variant and healthy controls Analysis was performed based on RNA-seq data for iPSC-derived monocytes (iMono) and macrophages (iMac; M0, M1, and M2 according to sample polarization) generated from individuals homozygous for the CCR5Δ32 variant (CCR5Δ32) and healthy control samples (ctrl). (A) PCA analysis based on transcriptome for all iPSC-derived macrophages RNA-seq samples. (B) Heatmap of macrophages surface makers. (C) Heatmap of macrophages cytokines. Columns represent genes, and rows represent samples. (D) Number of differential genes are shown between homozygous CCR5Δ32 individuals and controls at three induced macrophage subtypes. (E) GO analysis performed on genes up-regulated in homozygous CCR5Δ32 individuals compared to controls in iM0 and iM1 subtypes. (F) Shared up-regulated genes in homozygous CCR5Δ32 individuals among three induced macrophage subtypes are shown. See also Table S1.
Figure 6
Figure 6
Immunophenotype of primary and iPSC-derived macrophages (A) Representative photographs of immunofluorescence CD68 staining observed in primary macrophages (pMac, first row, n = 3), iPSC-derived macrophages obtained from healthy controls (iMac-Con, second row, n = 3) and iMac obtained from individuals homozygous for CCR5Δ32 variant (iMac-CCR5Δ32, third row, n = 4) polarized in M0, M1, and M2 macrophages (First, second and third column, respectively). Cells were stained for CD68 (red) and with DAPI for nuclear staining (blue) (scale bar: 20 μm). (B) Immunophenotype of pMac (n = 4), iMac-Con (n = 3) and iMac-CCR5Δ32 (n = 4) polarized in M0, M1, and M2 macrophages was evaluated by flow cytometry. Data are expressed as MFI. Data shown as Log2(Fold change) with all samples normalized on M0 pMac. (C and D) Primary and iPSC-derived macrophage secretome profile. Expression levels of IL12p40 as M1 polarization marker (C) and Eotaxin-2/CCL24 as M2 polarization marker (D) were analyzed in primary (white bar; n = 4) and iPSC-derived M0, M1, and M2 macrophages obtained from both controls (light gray bar; n = 4) and CCR5Δ32 individuals (dark gray bar; n = 4). Data are expressed as pg/105 cells and are presented as mean ± SEM. Statistical significance was calculated using ANOVA. ∗p < 0.05; ∗∗p < 0.01; ∗∗∗p < 0.001; ∗∗∗∗p < 0.0001. See also Figure S3.
Figure 7
Figure 7
Functionality of primary and iPSC-derived macrophages Phagocytic ability of M0, M1 and M2 primary macrophages (pMac, white bar, n = 4) and iPSC-derived macrophages (iMac) obtained from both controls (iMac-Con, light gray bar; n = 3) and individuals homozygous for CCR5Δ32 variant (iMac-CCR5Δ32, dark gray bar; n = 4) was evaluated by using pHrodo Green Zymosan A Bioparticles and was assessed by flow cytometry and confocal microscopy. (A) Macrophage phagocytic ability assessed by flow cytometry was shown as frequency of Zymosan+ cells. (B) Representative photographs showing phagocytized zymosan particles (in green) in primary macrophages (pMac, first row, n = 3) and iMac obtained from healthy controls (iMac-Con, second row, n = 3) and iMac obtained from homozygous CCR5Δ32 individuals (iMac-CCR5Δ32, third row, n = 4) polarized in M0, M1, and M2 macrophages (First, second and third column, respectively). Nuclei were stained with DAPI (blue). Scale bar: 20 μm. (C) The chemotactic ability of primary monocytes (pMono, white circle; n = 3) and iPSC-derived monocytes (iMono) obtained from healthy controls (iMono-Con, light gray square; n = 3) and from homozygous CCR5Δ32 individuals (iMono-CCR5Δ32, dark gray square; n = 3) to migrate in response to increasing the concentration of RANTES was assessed in vitro by a cell migration assay. The number of migrated cells was evaluated at different time points. ∗ iMono-Con vs. iMono-CCR5Δ32; # pMono-Con vs. iMono-CCR5Δ32. (D and E) Macrophage infectability with HIV was assessed in M1 and M2 polarized primary and iPSC-derived macrophages obtained from healthy controls (iMac-Con) and from homozygous CCR5Δ32 individuals (iMac-CCR5Δ32) by evaluating through qPCR the presence of (D) specific HIV-1 DNA Gag and (E) specific HIV-1 DNA LTR RU5. Amplification of genomic GAPDH as a reference gene was used to control the amount of DNA in each sample. Data shown as mean ± SEM. Statistical significance was calculated using ANOVA. ∗p < 0.05; ∗∗p < 0.01; ∗∗∗∗p < 0.0001.

References

    1. Samson M., Labbe O., Mollereau C., Vassart G., Parmentier M. Molecular Cloning and Functional Expression of a New Human CC-Chemokine Receptor Gene. Biochemistry. 1996;35:3362–3367. doi: 10.1021/bi952950g. - DOI - PubMed
    1. Barmania F., Pepper M.S. C-C chemokine receptor type five (CCR5): An emerging target for the control of HIV infection. Appl. Transl. Genom. 2013;2:3–16. doi: 10.1016/j.atg.2013.05.004. - DOI - PMC - PubMed
    1. Jin T., Xu X., Hereld D. Chemotaxis, chemokine receptors and human disease. Cytokine. 2008;44:1–8. doi: 10.1016/j.cyto.2008.06.017. - DOI - PMC - PubMed
    1. Connor R.I., Sheridan K.E., Ceradini D., Choe S., Landau N.R. Change in Coreceptor Use Correlates with Disease Progression in HIV-1–Infected Individuals. J. Exp. Med. 1997;185:621–628. doi: 10.1084/jem.185.4.621. - DOI - PMC - PubMed
    1. Dean M., Carrington M., Winkler C., Huttley G.A., Smith M.W., Allikmets R., Goedert J.J., Buchbinder S.P., Vittinghoff E., Gomperts E., et al. Genetic Restriction of HIV-1 Infection and Progression to AIDS by a Deletion Allele of the CKR5 Structural Gene. Science. 1996;273:1856–1862. doi: 10.1126/science.273.5283.1856. - DOI - PubMed