. 2023 Oct 31:17:1154196.
doi: 10.3389/fncel.2023.1154196. eCollection 2023.

Activity-dependent oligodendrocyte calcium dynamics and their changes in Alzheimer's disease

Affiliations

Activity-dependent oligodendrocyte calcium dynamics and their changes in Alzheimer's disease

Kenji Yoshida et al. Front Cell Neurosci. .

Abstract

Oligodendrocytes (OCs) form myelin around axons, which is dependent on neuronal activity. This activity-dependent myelination plays a crucial role in training and learning. Previous studies have suggested that neuronal activity regulates proliferation and differentiation of oligodendrocyte precursor cells (OPCs) and myelination. In addition, deficient activity-dependent myelination results in impaired motor learning. However, the functional response of OC responsible for neuronal activity and their pathological changes is not fully elucidated. In this research, we aimed to understand the activity-dependent OC responses and their different properties by observing OCs using in vivo two-photon microscopy. We clarified that the Ca2+ activity in OCs is neuronal activity dependent and differentially regulated by neurotransmitters such as glutamate or adenosine triphosphate (ATP). Furthermore, in 5-month-old mice models of Alzheimer's disease, a period before the appearance of behavioral abnormalities, the elevated Ca2+ responses in OCs are ATP dependent, suggesting that OCs receive ATP from damaged tissue. We anticipate that our research will help in determining the correct therapeutic strategy for neurodegenerative diseases beyond the synapse.

Keywords: ATP; Alzheimer’s disease; glutamate; oligodendrocyte; two photon microscopy.


Conflict of interest statement

The authors declare that the research was conducted in the absence of any commercial or financial relationships that could be construed as a potential conflict of interest.

Figures

Figure 1
Figure 1
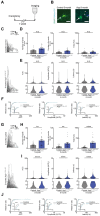
Neuronal activity-dependent Ca2+ activities in oligodendrocytes (OCs). (A,B) Representative images (A) and quantification (B) of GCaMP expression in the motor cortex of PLP-GCaMP mice and co-localization with markers for OC + oligodendrocyte precursor cell (OPC) (Olig2), OC (CC1), OPC (PDGFRα, NG2), neuron (NeuN), astrocyte (S100β) (Olig2 [83.41 ± 3.899%], CC1 [72.65 ± 3.464%], PDGFRα+ [9.979 ± 0.9322%], NG2 [6.736 ± 0.2401%], NeuN [1.481 ± 0.7246%], and S100β [8.156 ± 0.5504%]). Scale bar, 30 μm. (C,D) Representative images of MBP immunostaining in the motor cortex of PLP-GCaMP6 mice. Scale bars: in (C), 100 μm; in (D), 30 μm. (E) Quantitative analysis of the co-localization areas of MBP and GCaMP’ + ve processes based on immunostaining data. The proportion of MBP’ + ve processes in the processes of GCaMP’ + ve cells was about 15%. (F) Experimental protocol of Ca2+ imaging in OCs. The first craniotomy was performed one week before Pre-imaging (Pre) using two-photon microscopy. After Pre-imaging, a second craniotomy was performed and TTX was applied for 30 min, followed by a second imaging (TTX) of the same cells. (G,H) Representative image of GCaMP’ + ve cells of the motor cortex in PLP-GCaMP6 mice before and after TTX application. Red spots indicate the Ca2+ activated areas (spot). Scale bar = 30 μm. Representative Ca2+ traces from spots of typical GCaMP’ + ve cells are shown. (I) Changes in Ca2+ spots, Ca2+ events and total area under the curve (AUC) of GCaMP’ + ve cells between before and after TTX application. The number of Ca2+ spots and Ca2+ events and total AUC were significantly decreased after TTX application. Pre: n = 6 mice, 13 imaging fields (cells); TTX: n = 6 mice, 13 imaging fields (cells). *p < 0.05, **p < 0.01, Mann–Whitney U test. Data are presented as mean ± standard error of mean. For detailed data, check the source data file. (J) Changes in AUC, Amplitude, and Latency of GCaMP’ + ve cells between before and after TTX application. AUC was not significantly changed, Amplitude was significantly decreased, and Latency was significantly increased after TTX application. Pre: n = 6 mice, 426 events; TTX: n = 6 mice, 189 events. N.S., not significant, *p < 0.05, ***p < 0.001, Mann–Whitney U test. Violin plots show median (black line) and distribution of the data. For detailed data, check the source data file. (K) Proportions of AUC and Latency were not significantly changed between before and after TTX application. The proportion of lower Amplitude was significantly increased after TTX application. N.S., not significant, **p < 0.01, Kolmogorov–Smirnov test. For detailed data, check the source data file.
Figure 2
Figure 2
Ca2+ activities in oligodendrocytes (OCs) are regulated by glutamate. (A) Experimental protocol of the chemogenetic activation of the thalamocortical circuit and two-photon Ca2+ imaging with the application of neurotransmitter receptor antagonists, 6-cyano-7-nitroquinoxaline-2,3-dione disodium (CNQX), Suramin hexasodium salt (Suramin), and pyridoxalphosphate-6-azophenyl-2′,4′-disulfonic acid tetrasodium salt (PPADS). An adeno associated virus (AAV) vector coding Gq-DREAAD (hM3D) was injected into the motor thalamus and craniotomy (first) was performed. Then, 3–5 weeks after surgical operation (AAV injection and craniotomy [first]), two-photon Ca2+ imaging of OC was performed. A synthetic ligand clozapine N-oxide (CNO) was administered for hM3D activation (5 mg/kg, i.p.) after Pre-imaging (Pre). One hour after CNO application, two-photon Ca2+ imaging was performed again (CNO). After second imaging (CNO), neurotransmitter receptor antagonists were applied on the brain surface by craniotomy (second), and then, third imaging was performed (CNO + inhibitor). Two-photon Ca2+ imaging of OCs was obtained from the same cells in all imaging sessions. (B) Representative images showing the hM3D-mCherry expression in the motor thalamus and thalamocortical axons of motor cortices 5 weeks after the AAV injection. (C) Representative Ca2+ traces from spots of typical GCaMP’ + ve cells at Pre-imaging, and after CNO and CNO + CNQX application. (D) Ca2+ spots, Ca2+ events and total area under the curve (AUC) were significantly increased after CNO application. CNQX application significantly decreased these parameters. Pre: n = 23 mice, 48 imaging fields (cells); CNO: 23 mice, 48 imaging fields (cells); CNO + CNQX: n = 7 mice, 18 imaging fields (cells), N.S., not significant, **p < 0.01, ***p < 0.001, ****p < 0.0001, Kruskal–Wallis test followed by Dunn’s test. Data are presented as mean ± standard error of mean. For detailed data, check the source data file. (E) No statistically significant differences were detected in Latency between pre-imaging and after CNO application. AUC and Amplitude was significantly increased after CNO application. CNQX, application significantly decreased Amplitude. AUC was not significantly different between CNO and CNO + CNQX applications. Amplitude and Latency was significantly increased between CNO and CNO + CNQX applications. Pre: n = 23 mice, 736 events; CNO: n = 23 mice, 2047 events; CNO + CNQX: n = 7 mice, 286 events. N.S., not significant, ***p < 0.001, ****p < 0.0001, Kruskal–Wallis test followed by Dunn’s test. Violin plots show median (black line) and distribution of the data. For detailed data, check the source data file. (F) Proportions of larger AUC and higher Amplitude were significantly higher after CNO application than before. The proportion of lower Amplitude was significantly higher after CNO + CNQX application than after CNO application. The proportion of longer Latency was increased after CNO + CNQX application than after CNO application. Pre: n = 23 mice, 736 events; CNO: n = 23 mice, 2047 events; CNO + CNQX: n = 7 mice, 286 events. ***p < 0.001, ****p < 0.0001, Kolmogorov–Smirnov test. For detailed data, check the source data file.
Figure 3
Figure 3
Ca2+ activities in oligodendrocytes (OCs) are regulated by ATP. (A,E) Representative Ca2+ traces from spots of typical GCaMP’ + ve cells at Pre-imaging, and after CNO, CNO + Suramin, and CNO + PPADS applications. (B,F) Ca2+ spots, Ca2+ events and total area under the curve (AUC) were significantly increased after CNO application. Suramin, and PPADS applications significantly decreased these parameters. Pre: n = 23 mice, 48 imaging fields (cells); CNO: 23 mice, 48 imaging fields (cells); CNO + Suramin: 9 mice, 15 imaging fields (cells): CNO + PPADS: n = 7 mice, 15 imaging fields (cells), N.S., not significant, **p < 0.01, ***p < 0.001, ****p < 0.0001, Kruskal–Wallis test followed by Dunn’s test. Data are presented as mean ± standard error of mean. For detailed data, check the source data file. (C,G) No statistically significant differences were detected in Latency between pre-imaging and after CNO application. AUC and Amplitude was significantly increased after CNO application. Suramin, and PPADS applications significantly decreased Amplitude. Suramin and PPADS significantly decreased AUC, Amplitude and Latency. Pre: n = 23 mice, 736 events; CNO: n = 23 mice, 2047 events; CNO + Suramin: n = 9 mice, 289 events; CNO + PPADS: n = 7 mice, 289 events. N.S., not significant, *p < 0.05, **p < 0.01, ***p < 0.001, ****p < 0.0001, Kruskal–Wallis test followed by Dunn’s test. Violin plots show median (black line) and distribution of the data. For detailed data, check the source data file. (D,H) Proportions of larger AUC and higher Amplitude were significantly higher after CNO application than before. The proportion of lower Amplitude was significantly higher after CNO + Suramin, and CNO + PPADS applications than after CNO application. The number of shorter Latency Ca2+ activities was increased after CNO + Suramin and Suramin + PPADS applications than after CNO application. Pre: n = 23 mice, 736 events; CNO: n = 23 mice, 2047 events; CNO + Suramin: n = 9 mice, 289 events; CNO + PPADS: n = 7 mice, 289 events. *p < 0.05, **p < 0.01, ****p < 0.0001, Kolmogorov–Smirnov test. For detailed data, check the source data file.
Figure 4
Figure 4
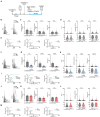
Ca2+ activity of oligodendrocytes (OCs) is altered in 5-month-old AppNL-G-F/NL-G-F mice. (A) Experimental protocol of two-photon Ca2+ imaging of OCs in AppNL-G-F/NL-G-F mice. For this purpose, transgenic mice (PLP-GCaMP6) were crossed with AppNL-G-F/NL-G-F mice and craniotomy was performed one week before imaging. (B) Representative image of GCaMP’ + ve cells in the motor cortex of 5-month-old age-matched control and AppNL-G-F/NL-G-F mice. Arrow indicates a GFP+ cell. Arrowhead indicates amyloid β deposition visualized by intraperitoneal administration of Methoxy-X04. Scale bar, 30 μm. (C) Representative Ca2+ traces from typical GCaMP’ + ve cell processes from 4-month-old age-matched control and AppNL-G-F/NL-G-F mice. (D) No statistically significant differences were detected in Ca2+ spots, Ca2+ events and total area under the curve (AUC) between Control and AppNL-G-F/NL-G-F mice at 4 months of age. Control: n = 6 mice, 12 imaging fields (cells); AppNL-G-F/NL-G-F: n = 6 mice, 15 imaging fields (cells). N.S., not significant by Mann–Whitney U-test. Data are presented as mean ± standard error of mean. For detailed data, check the source data file. (E) No statistically significant differences were detected in the AUC, Amplitude, and Latency between Control and AppNL-G-F/NL-G-F mice at 4 months of age. Control; n = 6 mice, 233 events; AppNL-G-F/NL-G-F; n = 6 mice, 418 events. N.S., not significant, Mann–Whitney U-test. Violin plots show median (black line) and distribution of the data. For detailed data, check the source data file. (F) Proportions of larger AUC, Amplitude, and Latency were not significantly different between Control and AppNL-G-F/NL-G-F mice at 4 months of age. Control; n = 6 mice, 233 events; AppNL-G-F/NL-G-F; n = 6 mice, 418 events. N.S., not significant, Kolmogorov–Smirnov test. For detailed data, check the source data file. (G) Representative Ca2+ traces from typical GCaMP’ + ve cell processes from 5-month-old age-matched control and AppNL-G-F/NL-G-F mice. (H) Ca2+ spots, Ca2+ events and total AUC were significantly higher in AppNL-G-F/NL-G-F mice than in Control mice at 5 months of age. Control: n = 8 mice, 22 imaging fields (cells); AppNL-G-F/NL-G-F: n = 8 mice, 18 imaging fields (cells). **p < 0.01, ****p < 0.0001, Mann–Whitney U-test. Error bar shows mean ± standard error of mean. For detailed data, check the source data file. (I) AUC, Amplitude, and Latency were significantly higher in AppNL-G-F/NL-G-F mice than in Control mice at 5 months of age. Control: n = 8 mice, 364 events; AppNL-G-F/NL-G-F: n = 8 mice, 877 events. ****p < 0.0001, Mann–Whitney U-test. Violin plots show median (black line) and distribution of the data. For detailed data, check the source data file. (J) Proportions of larger AUC and higher Amplitude and Latency were significantly higher in AppNL-G-F/NL-G-F mice than in Control mice at 5 months of age. Control: n = 8 mice, 364 events; AppNL-G-F/NL-G-F: n = 8 mice, 877 events. **p < 0.01, ****p < 0.0001, Kolmogorov–Smirnov test. For detailed data, check the source data file.
Figure 5
Figure 5
Pharmacological manipulation of oligodendrocyte (OC) Ca2+ activities in AppNL-G-F/NL-G-F mice at 5 months. (A) Experimental protocol of two-photon Ca2+ imaging of OCs in AppNL-G-F/NL-G-F mice at 5 months of age. One week after craniotomy (first), two-photon Ca2+ imaging was performed (Pre). After Pre- imaging, TTX or neurotransmitter receptor antagonists (CNQX or Suramin and PPPADS) were applied on the brain surface by craniotomy (second), and then, second imaging was performed (Inhibitor). Two-photon Ca2+ imaging of OCs was obtained from the same cells in all imaging sessions. (B) Representative Ca2+ traces from typical GCaMP’ + ve cell processes after TTX application. (C) No statistically significant differences were detected in Ca2+ spots, Ca2+ events and total area under the curve (AUC) between before and after TTX application. Pre: n = 9 mice, 19 imaging fields (cells); TTX: n = 9 mice, 19 imaging fields (cells). N.S., not significant, Mann–Whitney U-test. Data are presented as the mean ± standard error of mean. For detailed data, check the source data file. (D) No statistically significant differences were detected in AUC, Amplitude, and Latency between before and after TTX application. Pre: n = 9 mice, 611 events; TTX: n = 9 mice, 517 events. N.S., not significant, Mann–Whitney U-test. Violin plots show median (black line) and distribution of the data. For detailed data, check the source data file. (E) Proportions of AUC, Amplitude, and Latency were not significantly different between before and after TTX application. Pre: n = 9 mice, 611 events; TTX: n = 9 mice, 517 events. N.S., not significant, Kolmogorov–Smirnov test. (F) Representative Ca2+ traces from typical GCaMP’ + ve cell processes after Suramin + PPADS application. (G) Ca2+ spots, Ca2+ events and total AUC were significantly decreased after Suramin + PPADS application. Pre: n = 10 mice, 17 imaging fields (cells); Suramin + PPADS: n = 10 mice, 17 imaging fields (cells). **p < 0.01, ****p < 0.0001, Mann–Whitney U-test. Data are presented as the mean ± standard error of mean. For detailed data, check the source data file. (H) AUC, Amplitude, and Latency were significantly decreased after Suramin + PPADS application. Pre: n = 10 mice, 777 events; Suramin + PPADS: n = 10 mice, 208 events. ****p < 0.0001, Mann–Whitney U-test. Violin plots show median (black line) and distribution of the data. For detailed data, check the source data file. (I) Proportions of smaller AUC, lower Amplitude, and shorter Latency were significantly increased after Suramin + PPADS application. Pre: n = 10 mice, 777 events; Suramin + PPADS: n = 10 mice, 208 events. ***p < 0.001, ****p < 0.0001, Kolmogorov–Smirnov test. For detailed data, check the source data file. (J) Representative Ca2+ traces from typical GCaMP’ + ve cell processes after CNQX application. (K) No statistically significant differences were detected in Ca2+ spots, Ca2+ events, and total area under the curve (AUC) between before and after CNQX application. Pre: n = 10 mice, 18 imaging fields (cells); CNQX: n = 10 mice, 18 imaging fields (cells). N.S., not significant, Mann–Whitney U-test. Data are presented as the mean ± standard error of mean. For detailed data, check the source data file. (L) No statistically significant differences were detected in AUC, Amplitude, and Latency between before and after CNQX application. Pre: n = 10 mice, 822 events; CNQX: n = 10 mice, 780 events. N.S., not significant, Mann–Whitney U-test. Violin plots show median (black line) and distribution of the data. For detailed data, check the source data file. (M) Proportions of AUC, Amplitude, and Latency were not significantly different between before and after CNQX application. Pre: n = 10 mice, 822 events; CNQX: n = 10 mice, 780 events. N.S., not significant, Kolmogorov–Smirnov test. For detailed data, check the source data file.

References

    1. Agresti C., Meomartini M. E., Amadio S., Ambrosini E., Serafini B., Franchini L., et al. . (2005). Metabotropic P2 receptor activation regulates oligodendrocyte progenitor migration and development. Glia 50, 132–144. doi: 10.1002/glia.20160, PMID: - DOI - PubMed
    1. Amlien I. K., Fjell A. M. (2014). Diffusion tensor imaging of white matter degeneration in Alzheimer's disease and mild cognitive impairment. Neuroscience 276, 206–215. doi: 10.1016/j.neuroscience.2014.02.017 - DOI - PubMed
    1. Barres B. A., Raff M. C. (1993). Proliferation of oligodendrocyte precursor cells depends on electrical activity in axons. Nature 361, 258–260. doi: 10.1038/361258a0 - DOI - PubMed
    1. Barron T., Kim J. H. (2019). Neuronal input triggers ca (2+) influx through AMPA receptors and voltage-gated ca (2+) channels in oligodendrocytes. Glia 67, 1922–1932. doi: 10.1002/glia.23670, PMID: - DOI - PMC - PubMed
    1. Battefeld A., Popovic M. A., de Vries S. I., Kole M. H. P. (2019). High-frequency microdomain ca (2+) transients and waves during early myelin internode remodeling. Cell Rep. 26, 182–191.e5. doi: 10.1016/j.celrep.2018.12.039, PMID: - DOI - PMC - PubMed

LinkOut - more resources