. 2023 Nov 13:17:1253543.
doi: 10.3389/fncel.2023.1253543. eCollection 2023.

Neuronal models of TDP-43 proteinopathy display reduced axonal translation, increased oxidative stress, and defective exocytosis

Affiliations

Neuronal models of TDP-43 proteinopathy display reduced axonal translation, increased oxidative stress, and defective exocytosis

Alessandra Pisciottani et al. Front Cell Neurosci. .

Abstract

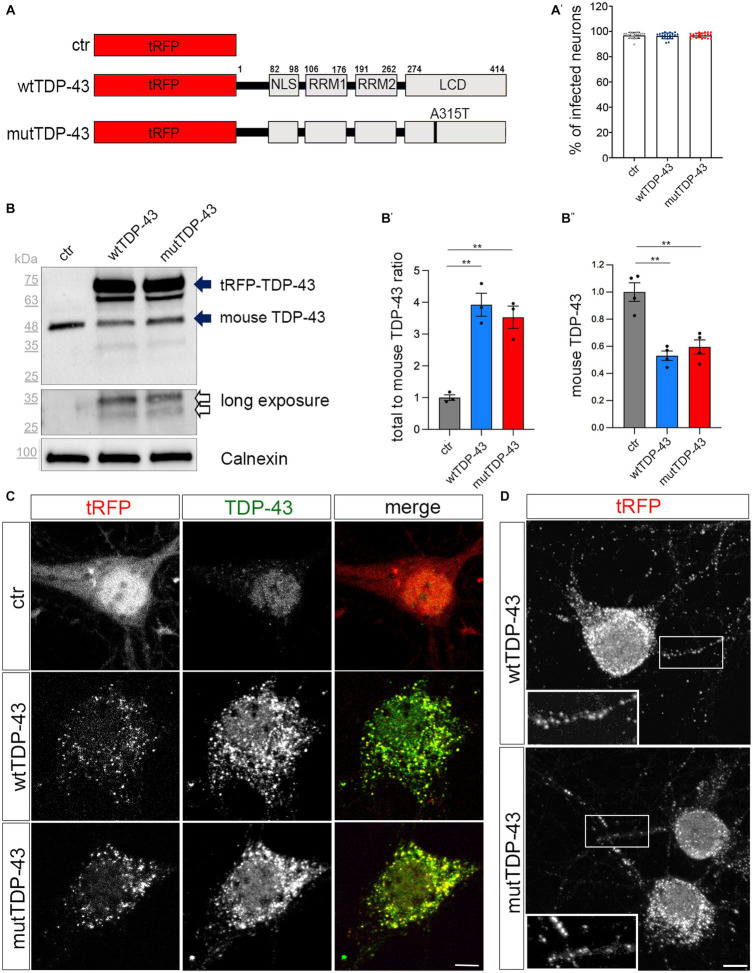
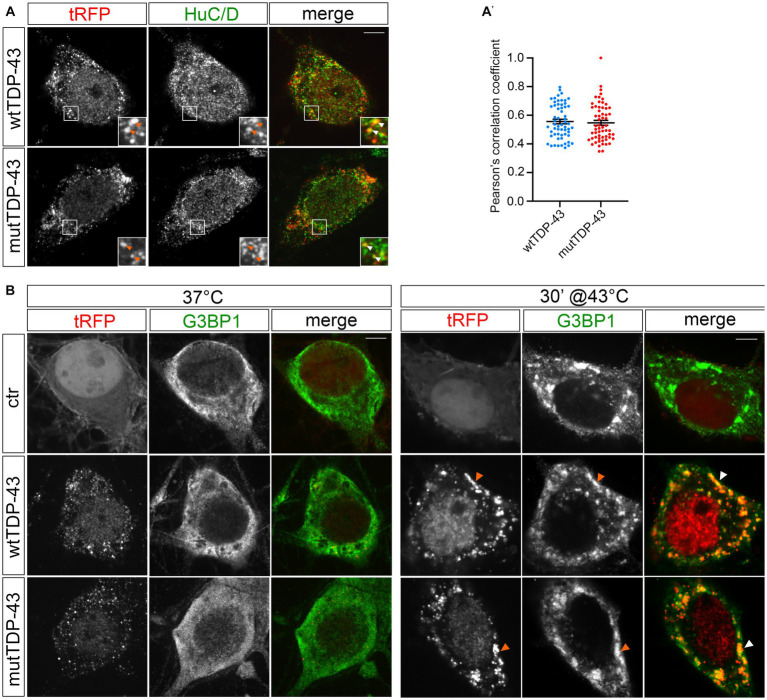
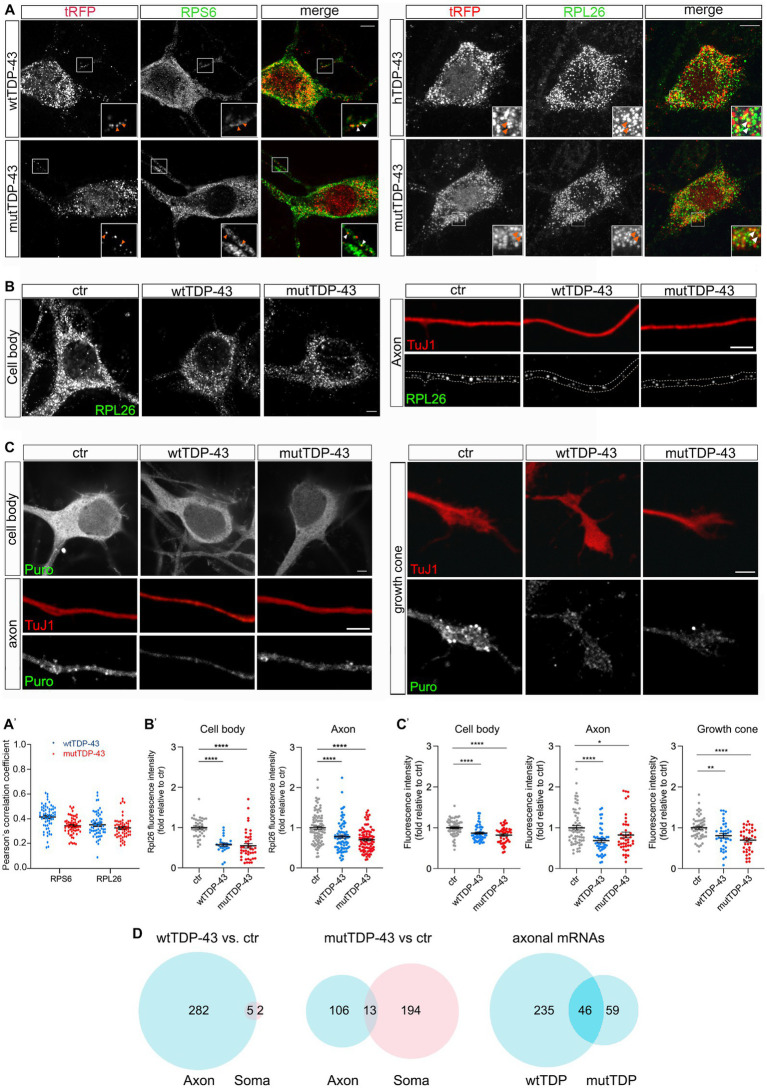
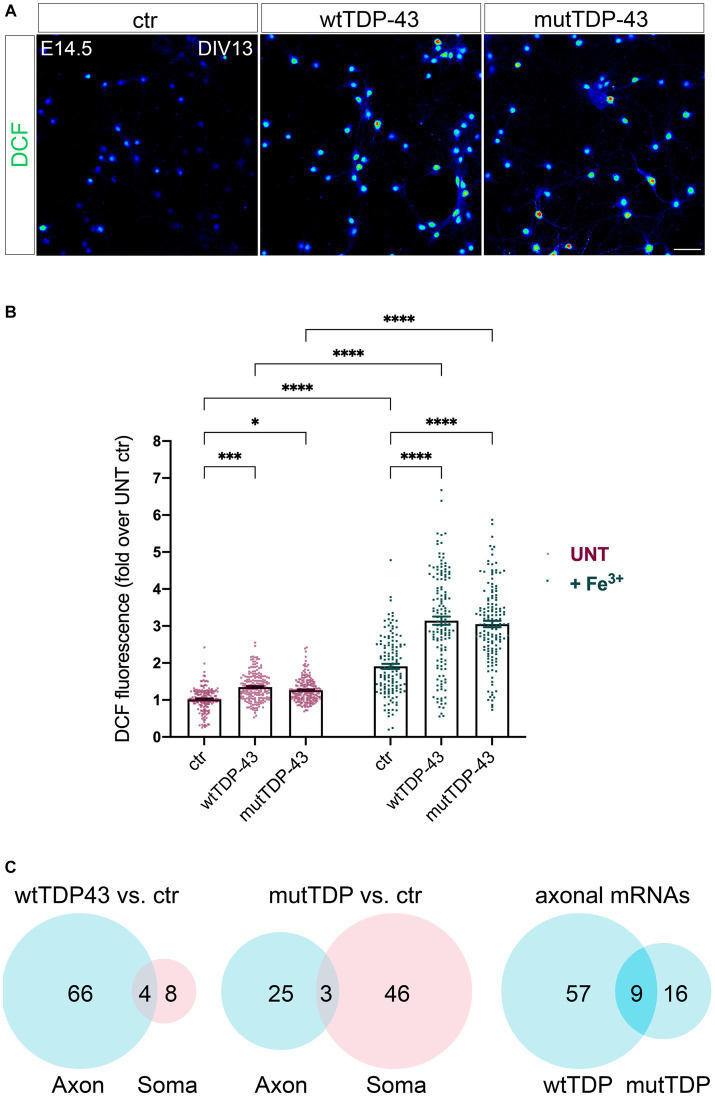
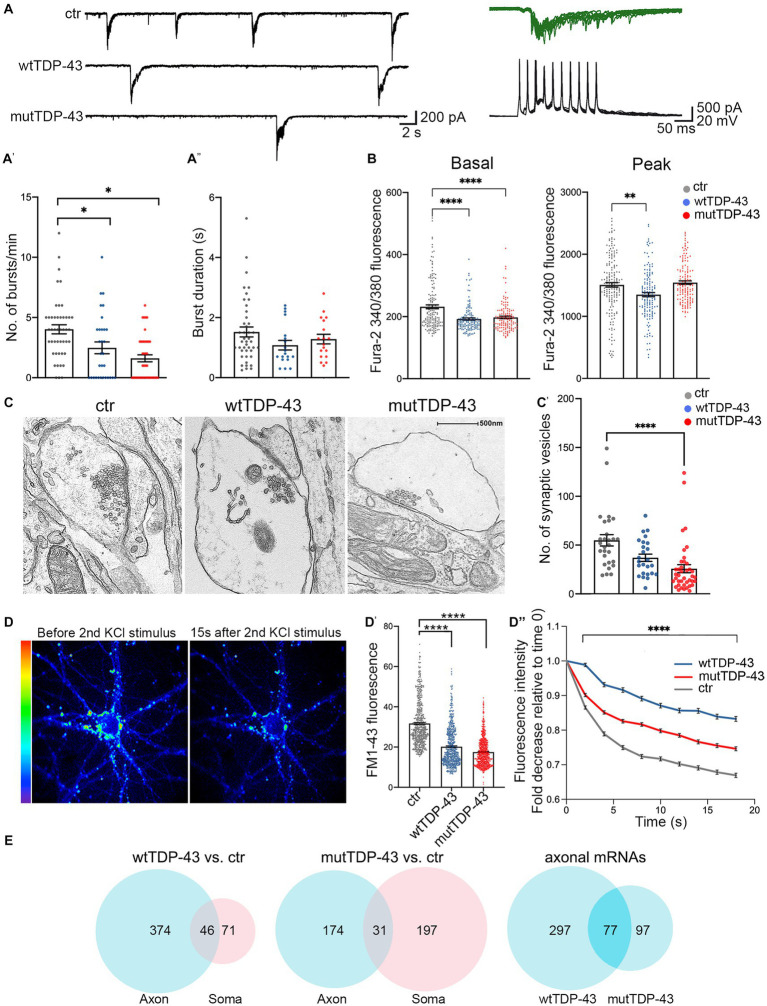
Amyotrophic lateral sclerosis (ALS) is a progressive, lethal neurodegenerative disease mostly affecting people around 50-60 years of age. TDP-43, an RNA-binding protein involved in pre-mRNA splicing and controlling mRNA stability and translation, forms neuronal cytoplasmic inclusions in an overwhelming majority of ALS patients, a phenomenon referred to as TDP-43 proteinopathy. These cytoplasmic aggregates disrupt mRNA transport and localization. The axon, like dendrites, is a site of mRNA translation, permitting the local synthesis of selected proteins. This is especially relevant in upper and lower motor neurons, whose axon spans long distances, likely accentuating their susceptibility to ALS-related noxae. In this work we have generated and characterized two cellular models, consisting of virtually pure populations of primary mouse cortical neurons expressing a human TDP-43 fusion protein, wt or carrying an ALS mutation. Both forms facilitate cytoplasmic aggregate formation, unlike the corresponding native proteins, giving rise to bona fide primary culture models of TDP-43 proteinopathy. Neurons expressing TDP-43 fusion proteins exhibit a global impairment in axonal protein synthesis, an increase in oxidative stress, and defects in presynaptic function and electrical activity. These changes correlate with deregulation of axonal levels of polysome-engaged mRNAs playing relevant roles in the same processes. Our data support the emerging notion that deregulation of mRNA metabolism and of axonal mRNA transport may trigger the dying-back neuropathy that initiates motor neuron degeneration in ALS.

Keywords: TDP-43 proteinopathy; amyotrophic lateral sclerosis; axonal translation; calcium; cortical neurons; oxidative stress; polysome profiling; synaptic function.


Conflict of interest statement

The authors declare that the research was conducted in the absence of any commercial or financial relationships that could be construed as a potential conflict of interest.

Figures

Figure 1
Figure 1
Cytoplasmic aggregate formation in neurons expressing tRFP-TDP-43. (A) Schematic representation of ctr, wtTDP-43 and mutTDP-43 constructs. TDP-43 functional domains are also shown. This schematic shows the presence of the fluorescent tag (tRFP) at the N-terminal position of TDP-43. NLS, Nuclear Localization Sequence; RRM1, RRM2, RNA Recognition Motif-1 and -2; LCD, low-complexity glycine-rich domain. The A315T aa substitution is located in the LCD domain. (A′) Percentage of transduced neurons analyzed by the ArrayScan microscope on 3 independent experiments (n = 12,877 for ctr, 9,381 wtTDP-43 and 11,634 mutTDP-43); each dot corresponds to the average percentage of a single microscope field. (B) Western blot of protein lysates derived from ctr, wtTDP-43 and mutTDP-43 neurons immunostained with an Ab detecting both human and murine TDP-43. An anti-calnexin Ab was used as a loading control. The ~75 kDa band (upper solid arrow), corresponds to the product of tRFP N-terminally fused with human TDP-43 (wt or A315T); the ~48 kDa band corresponds to endogenous murine TDP-43 (lower solid arrow). Another band (~63 kDa) is present in TDP-43-overexpressing neurons, likely representing a C-terminal cleavage product of the fusion protein. Upon a longer exposure, two additional bands appear (empty arrows). (B′) The graph shows the ratio of total TDP-43 levels (human + endogenous mouse protein) to endogenous TDP-43 levels in ctr cells. Panel (B″) shows the normalized level of endogenous TDP-43 in TDP-43-overexpressing neurons relative to ctr ones. Values are expressed as mean ± SEM; B′: n = 3; B″: n = 4; Kruskal-Wallis test (non-parametric), **p < 0.01. (C) Ctr, wtTDP-43 and mutTDP-43 neurons at 14 DIV, immunostained with an Ab detecting both human and murine TDP-43 (green). In ctr neurons, tRFP is concentrated mostly in the nucleus, while exogenous tRFP-TDP-43 (wt or A315T) is highly enriched in the cytoplasm of wtTDP-43 and mutTDP-43 neurons, forming aggregates. Size bar: 5 μm. (D) wtTDP-43 and mutTDP-43 aggregates, revealed by tRFP fluorescence, are found not only in cell bodies but also in neurites (see magnification in insets). Size bar: 5 μm.
Figure 2
Figure 2
tRFP-TDP-43 is recruited by RNA granules. (A) Immunofluorescent staining of wtTDP-43 and mutTDP-43 neurons with an anti-HuC/D antibody. HuC/D (green) partially colocalizes with fluorescent tRFP-TDP-43 aggregates (wt or A315T; red) as shown by arrowheads in insets. (A′) Dots in histogram indicate the percentage of HuC/D-tRFP colocalization in each individual cell examined; mean positive Pearson’s correlation coefficient: r = 0.56 ± 0.016 (wtTDP-43); 0.55 ± 0.017 (mutTDP-43; Mean ± SEM, n = 3). (B) Immunofluorescence of ctr, wtTDP-43 and mutTDP-43 neurons with anti-G3BP1 under physiological conditions (left) and after heat shock (right).
Figure 3
Figure 3
Axonal protein synthesis is reduced in wtTDP-43 and mutTDP-43 neurons. (A) A fraction of small and large subunit ribosomal proteins (RPS6 and RPL26, respectively) colocalize with aggregates of RFP-tagged human TDP-43, both wild type and mutant (see arrowheads in insets). (A′) Dots in histograms indicate the percentage of colocalization in each individual cell examined; mean positive Pearson’s correlation coefficient: for RPS6, r = 0.41 ± 0.013 (wtTDP-43); 0.34 ± 0.009 (mutTDP-43); for RPL26, r = 0.35 ± 0.013 (wtTDP-43); 0.33 ± 0.012 (mutTDP-43); (Mean ± SEM, n = 3). (B) RPL26 protein abundance is reduced in the cell body (left) and axon (right) of cells expressing human TDP-43, wt or mutant. Differences and their statistical significance are plotted in B′, where each dot corresponds to an individual cell or axon examined. Mean ± SEM, n = 3, Mann–Whitney test (non-parametric), ****value of p < 0.0001. (C) Global protein synthesis, expressed as the intensity of puromycin-positive signal, is decreased in the cell body, axon and growth cone of cells expressing human TDP-43, wt or mutant (see results for explanation). Differences and their statistical significance are plotted in C′, where each dot corresponds to an individual cell/axon/growth cone (Mean ± SEM, n = 3, Mann–Whitney test (non-parametric), *value of p<0.05, **value of p<0.01, ****value of p<0.0001). (D) Here and in subsequent figures, the Venn diagrams on the left and in the center show the number of DEGs in the axon (light blue) and soma (pink) of wtTDP-43 and mutTDP-43 neurons, respectively; the intersection between blue diagrams on the right indicates axonal DEGs shared by the two populations, and listed in Table 2. Venn diagrams shown here describe the numbers of polysome-engaged mRNAs, involved in various aspects of mRNA translation, whose abundance is decreased in wtTDP-43 and mutTDP-43 axons vs. ctr ones. Note the high number of axonal DEGs belonging to gene ontologies related to mRNA translation.
Figure 4
Figure 4
Impairment of the response to oxidative stress in neurons wtTDP-43 and mutTDP-43 neurons. (A) Representative images of ctr, wtTDP-43 and mutTDP-43 neurons loaded with DCF (green) shown as rainbow look-up table (LUT) values. (B) Graph showing DCF fluorescence intensity of ctr, wtTDP-43 and mutTDP-43 relative to untreated (UNT) ctr neurons, in the absence (red) or presence (green) of Fe3+ treatment. Data are expressed as mean ± SEM, from 4 or 5 biological replicates; each dot corresponds to an individual microscope field (n = 48 fields for each experimental condition with an average of 60–70 neurons/field); Two-way ANOVA test *p < 0.05; ***p < 0.005; ****p < 0.0001. (C) Venn diagrams reporting the numbers of downregulated polysomal DEGs involved in the response to oxidative stress. Note the high number of mRNAs, belonging to gene ontologies related to oxidative stress, which show differential abundance in the axon.
Figure 5
Figure 5
Impairment of spontaneous burst firing, calcium responses and synaptic vesicle exocytosis in neurons expressing human TDP-43. (A) Top left: examples of spontaneous compound postsynaptic current (PSC) bursts recorded in ctr, wtTDP-43, and mutTDP-43 cultures. Top right: individual PSC bursts recorded in voltage clamp mode at a vh of −70 mV correlate with spontaneous action potential bursts recorded in current clamp in a different cell. (A′) Summary plots of average burst frequencies. (A″) Average duration of individual bursts. wtTDP-43 and mutTDP-43 show decreased burst frequency relative to ctr, while no difference in individual burst duration was observed (Mean ± SEM, of 46 ctr neurons, 31 wtTDP-43 neurons and 41 mutTDP-43 neurons, from 12, 11, and 10 experiments, respectively), Mann Whitney U-Test (non-parametric), ns = p > 0.05, *p < 0.05. (B) Graphs showing fura-2340/380 nm ratio of fluorescence intensity in ctr, wtTDP-43 and mutTDP-43 neurons under basal conditions (graph on the left) and at the peak of response after glutamate stimulation [graph on the right; Mean ± SEM of 176 ctr neurons, 158 wtTDP-43 neurons, and 151 mutTDP-43 neurons, from 5 biological replicates, Kruskal-Wallis test (non-parametric), **p < 0.001, ****p < 0.0001]. (C) Transmission electron microscopy analysis reveals synaptic boutons and the corresponding postsynaptic side. Note a significant reduction of vesicle numbers in mutTDP-43 neurons (C′) Synaptic vesicle counts were performed on electron microscopy images from 4 different biological replicates using ImageJ software. In particular we counted 28 images for tRFP (n = 1,536 synaptic vesicles), 26 for wtTDP-43 (n = 1,099 synaptic vesicles); 40 for mutTDP-43 (n = 1,032 synaptic vesicles); Mean ± SEM, Kruskal-Wallis test (non-parametric), ****p < 0.0001. (D) Representative images showing FM1-43 fluorescence intensity as rainbow LUTs at two time points of the FM1-43 assay. The left image shows a neuron after treatment with 10 μM FM1-43 and 30 mM KCl simultaneously to promote internalization of the dye in synaptic vesicles; the right image shows FM1-43 fluorescence intensity 15 s after the second stimulus with 30 mM KCl, which triggers exocytosis of fluorescence-loaded vesicles. (D′) The graph shows fluorescence levels of synaptic contacts upon completion of endocytosis (e.g., left panel in D), revealing a significant decrease of FM1-43 signal in both wtTDP-43 and mutTDP-43 cells; Mean ± SEM, Kruskal-Wallis test (non-parametric, ****p < 0.0001). This result parallels the number of vesicles loaded with FM1-43. (D″) Graph showing the decay of FM1-43 fluorescence relative to time 0, upon addition of the 2nd KCl stimulus, in wtTDP-43 (blue), mutTDP-43 (red) and ctr cells (gray). The downward slope of the curve parallels the rate of exocytosis [Mean ± SEM, from 5 biological replicates, Mann–Whitney test (non-parametric), ****value of p < 0.0001, number of analyzed ROI: ctrl = 456, wtTDP = 384, mutTDP = 532]. (E) Venn diagrams reporting the numbers of downregulated polysomal DEGs involved in synaptic function. Note the high number of differentially abundant mRNAs, belonging to gene ontologies related to synapses, which show differential abundance in the axon.

References

    1. Alami N. H., Smith R. B., Carrasco M. A., Williams L. A., Winborn C. S., Han S. S., et al. . (2014). Axonal transport of TDP-43 mRNA granules is impaired by ALS-causing mutations. Neuron 81, 536–543. doi: 10.1016/j.neuron.2013.12.018 - DOI - PMC - PubMed
    1. Altman T., Ionescu A., Ibraheem A., Priesmann D., Gradus-Pery T., Farberov L., et al. . (2021). Axonal TDP-43 condensates drive neuromuscular junction disruption through inhibition of local synthesis of nuclear encoded mitochondrial proteins. Nat. Commun. 12:6914. doi: 10.1038/s41467-021-27221-8 - DOI - PMC - PubMed
    1. Aly A., Laszlo Z. I., Rajkumar S., Demir T., Hindley N., Lamont D. J., et al. . (2023). Integrative proteomics highlight presynaptic alterations and c-Jun misactivation as convergent pathomechanisms in ALS. Acta Neuropathol. 146, 451–475. doi: 10.1007/s00401-023-02611-y - DOI - PMC - PubMed
    1. Amaral E., Guatimosim S., Guatimosim C. (2011). Using the fluorescent styryl dye FM1-43 to visualize synaptic vesicles exocytosis and endocytosis in motor nerve terminals. Methods Mol. Biol. 689, 137–148. doi: 10.1007/978-1-60761-950-5_8 - DOI - PubMed
    1. Amendola M., Venneri M. A., Biffi A., Vigna E., Naldini L. (2005). Coordinate dual-gene transgenesis by lentiviral vectors carrying synthetic bidirectional promoters. Nat. Biotechnol. 23, 108–116. doi: 10.1038/nbt1049 - DOI - PubMed