. 2023 Oct 30;9(11):e21655.
doi: 10.1016/j.heliyon.2023.e21655. eCollection 2023 Nov.

Genome-wide identification of glutamate receptor-like gene family in soybean

Affiliations

Genome-wide identification of glutamate receptor-like gene family in soybean

Xinran Li et al. Heliyon. .

Abstract

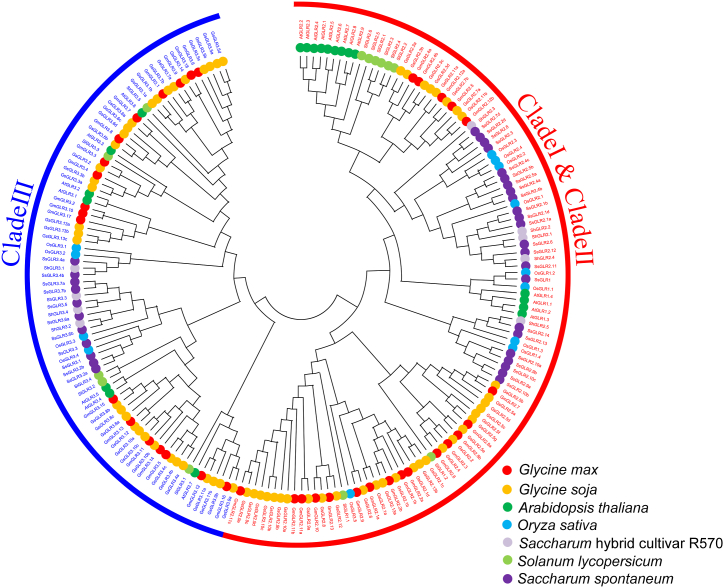
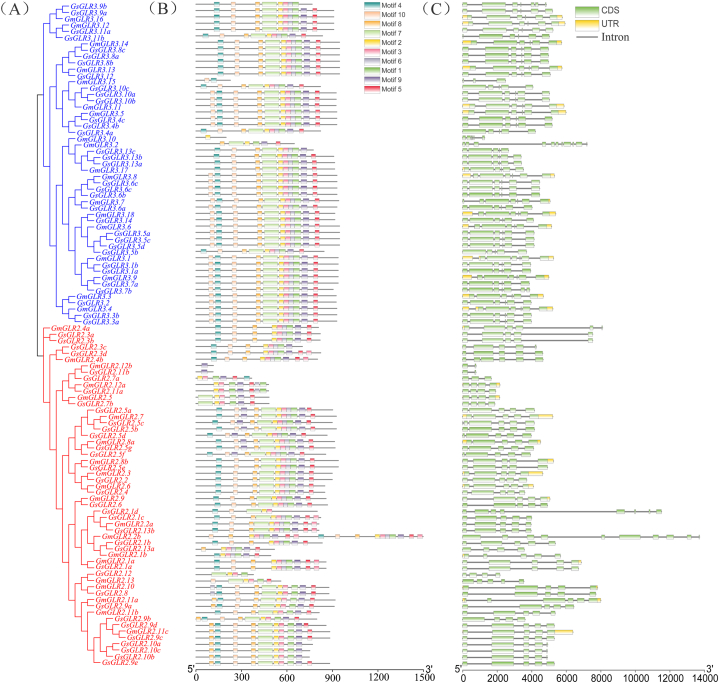
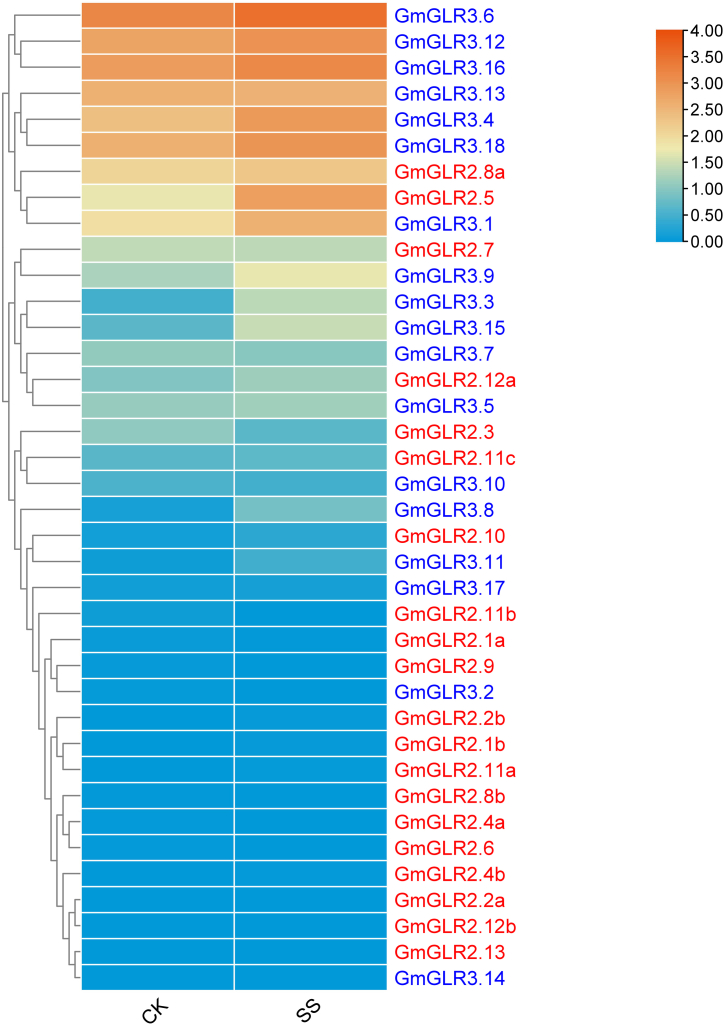
Glutamate receptor-like genes (GLRs) are essential in the growth and development of plants and many physiological and biochemical processes; however, related information in soybean is lacking. In this study, 105 GLRs, including 67 Glycine soja and 38 Glycine max GLRs, were identified and divided into two clades (Clades II and III) according to their phylogenetic relationships. GLR members in the same branch had a relatively conservative motif composition and genetic structure. Furthermore, the soybean GLR family mainly experienced purification selection during evolution. Cis-acting element analysis, gene ontology, and Kyoto Encyclopedia of Genes and Genomic annotations indicated the complexity of the gene regulation and functional diversity of the soybean GLR. Moreover, transcriptome data analysis showed that these GLRs had different expression profiles in different tissues, and Clade III members had higher and more common expression patterns. Additionally, the expression profiles under jasmonic acid treatment and salt stress indicate that the GLR participated in the jasmonic acid signaling pathway and plays a role in salt treatment. This study provides information for a comprehensive understanding of the soybean GLR family and a reference for further functional research and genetic improvement.

Keywords: Expression analysis; Feature analysis; Glutamate receptor-like gene; Soybean.


Conflict of interest statement

The authors declare that they have no known competing financial interests or personal relationships that could have appeared to influence the work reported in this paper.

Figures

Fig. 1
Fig. 1
Phylogenetic tree of GLRs from Arabidopsis, rice, and soybean. All protein sequences were aligned using MAFFT, and the ML tree was constructed using IQtree with 1000 bootstrap replicates. Different colors indicate different subgroups or species.
Fig. 2
Fig. 2
Schematic diagram of the phylogenetic tree (A), conserved motif (B), and gene structure (C) of GsGLRs and GmGLRs. Genes from the same subtribe were indicated by the same color.
Fig. 3
Fig. 3
Chromosomal distribution of GLRs in Glycine max. Chromosome size is indicated by its relative length. Chromosome numbers are shown at the top of each chromosome.
Fig. 4
Fig. 4
Genome-wide synteny analysis of GLRs in Glycine soja and Glycine max. Genes from the same subtribe were indicated by the same color. (A) GsGLRs. (B) GmGLRs. (C) GsGLRs and GmGLRs.
Fig. 5
Fig. 5
The distribution of cis-acting elements in promoters of soybean GLR family members.
Fig. 6
Fig. 6
GO and KEGG enrichment analyses of soybean GLRs. (A) The highly enriched GO terms in GsGLRs. (B) The highly enriched GO terms in GmGLRs. (C) The highly enriched KEGG pathways in GsGLRs. (D) The highly enriched KEGG pathways in GmGLRs. Pink represented extra functions in GsGLRs but not in GmGLRs, and green represented extra functions in GmGLRs but not in GsGLRs.
Fig. 7
Fig. 7
GmGLR expression pattern in different tissues of Glycine max. Among these six tissues, the flower was in stage 2, and the other five were in stage 6.
Fig. 8
Fig. 8
Average expression of Clades II and III genes in different tissues of Glycine max. (A) for Clade II members and (B) for Clade III members.
Fig. 9
Fig. 9
GmGLR expression pattern in the face of phytohormone induction. CK: control group; JA: jasmonic acid; IAA: indole-3-acetic acid.
Fig. 10
Fig. 10
GmGLR expression pattern under salt stress. CK: control group; SS: salt stress.
figs1
figs1

References

    1. Forde B.G., Lea P.J. Glutamate in plants: metabolism, regulation, and signalling. J. Exp. Bot. 2007;58:2339–2358. doi: 10.1093/jxb/erm121. - DOI - PubMed
    1. Sheng M., Nakagawa T. Neurobiology: glutamate receptors on the move. Nature. 2002;417:601–602. doi: 10.1038/417601a. - DOI - PubMed
    1. Watkins J.C., Jane D.E. The glutamate story. Br. J. Pharmacol. 2006;147(Suppl 1) doi: 10.1038/sj.bjp.0706444. S100–S108. - DOI - PMC - PubMed
    1. Tapken D., Hollmann M. Arabidopsis thaliana glutamate receptor ion channel function demonstrated by ion pore transplantation. J. Mol. Biol. 2008;383:36–48. doi: 10.1016/j.jmb.2008.06.076. - DOI - PubMed
    1. Chiu J., DeSalle R., Lam H.M., Meisel L., Coruzzi G. Molecular evolution of glutamate receptors: a primitive signaling mechanism that existed before plants and animals diverged. Mol. Biol. Evol. 1999;16:826–838. doi: 10.1093/oxfordjournals.molbev.a026167. - DOI - PubMed

LinkOut - more resources