

Defining levels of care in cardiogenic shock
- PMID: 38028504
- PMCID: PMC10644172
- DOI: 10.3389/fcvm.2023.1206570
Defining levels of care in cardiogenic shock
Abstract
Background: Expert opinion and professional society statements have called for multi-tier care systems for the management of cardiogenic shock (CS). However, little is known about how to pragmatically define centers with different levels of care (LOC) for CS.
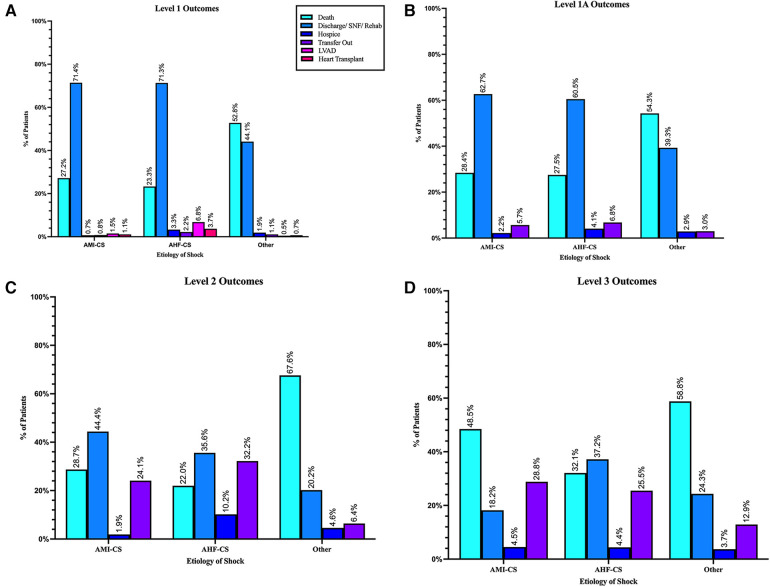
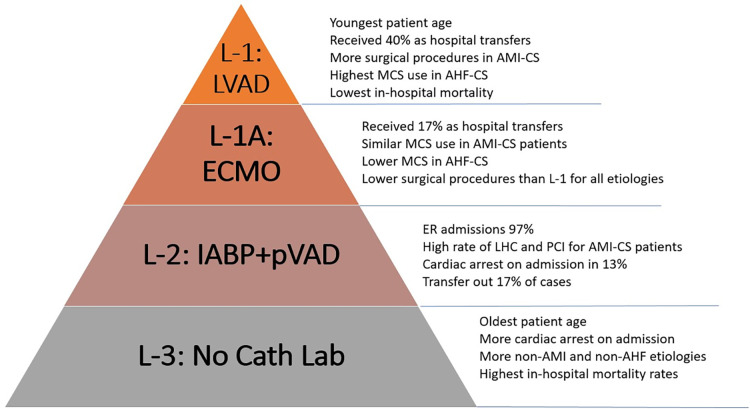
Methods: Eleven of 23 hospitals within our healthcare system sharing a common electronic health record were classified as different LOC according to their highest mechanical circulatory support (MCS) capabilities: Level 1 (L-1)-durable left ventricular assist device, Level 1A (L-1A)-extracorporeal membrane oxygenation, Level 2 (L-2)-intra-aortic balloon pump and percutaneous ventricular assist device; and Level 3 (L-3)-no MCS. All adult patients treated for CS (International Classification of Diseases, ICD-10 code R57.0) between 2016 and 2022 were included. Etiologies of CS were identified using associated diagnostic codes. Management strategies and outcomes across LOC were compared.
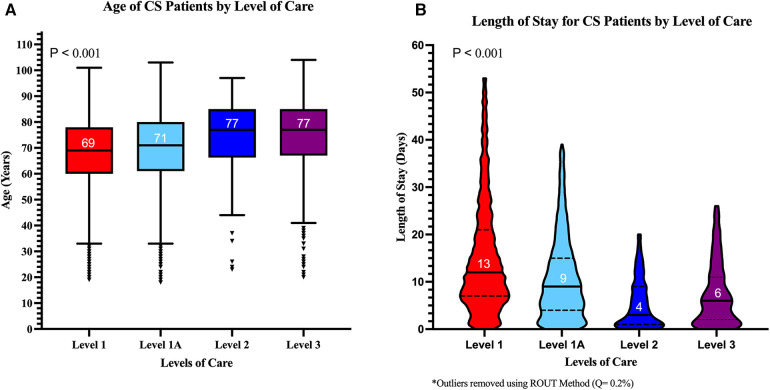
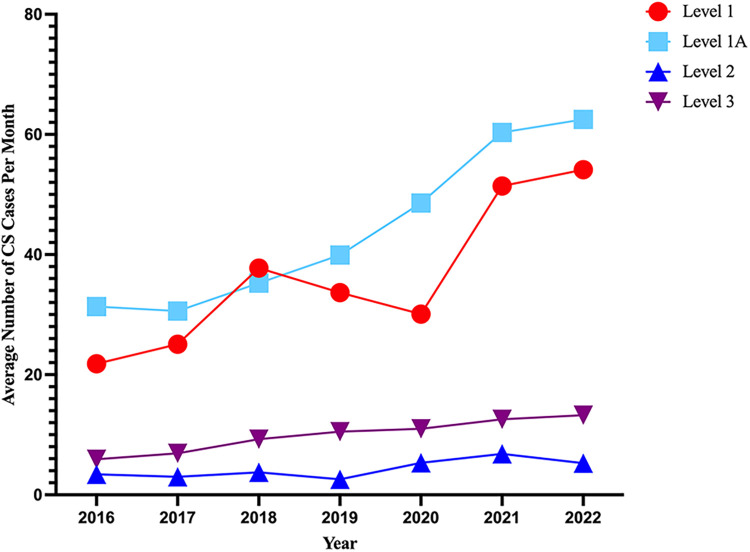
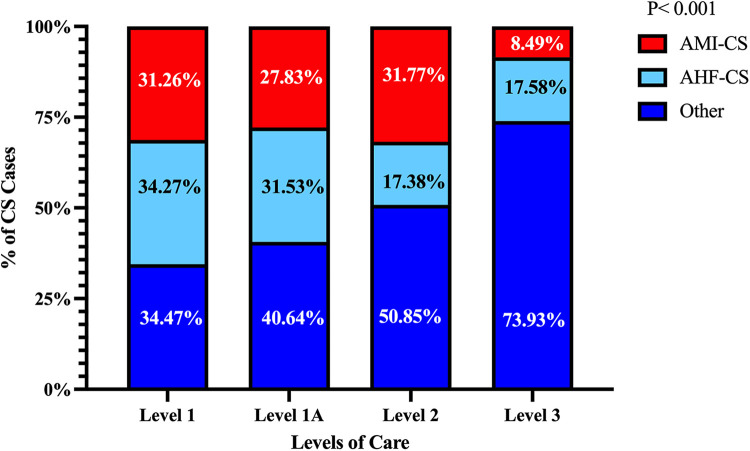
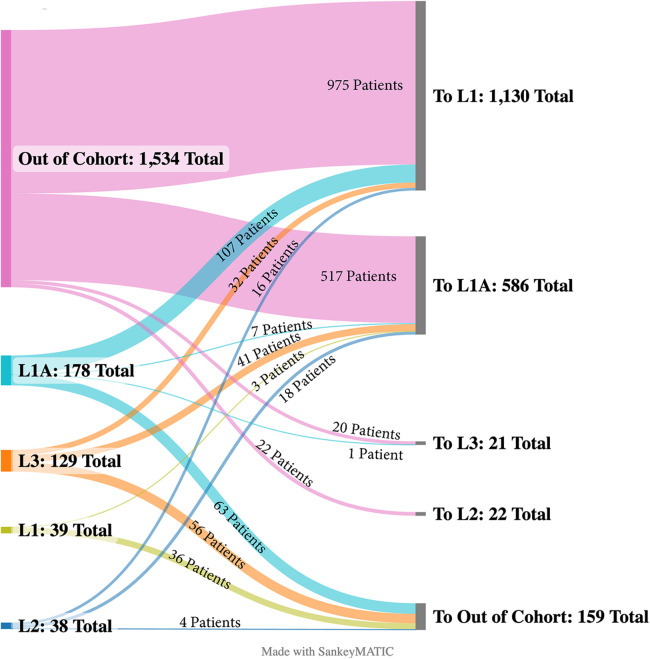
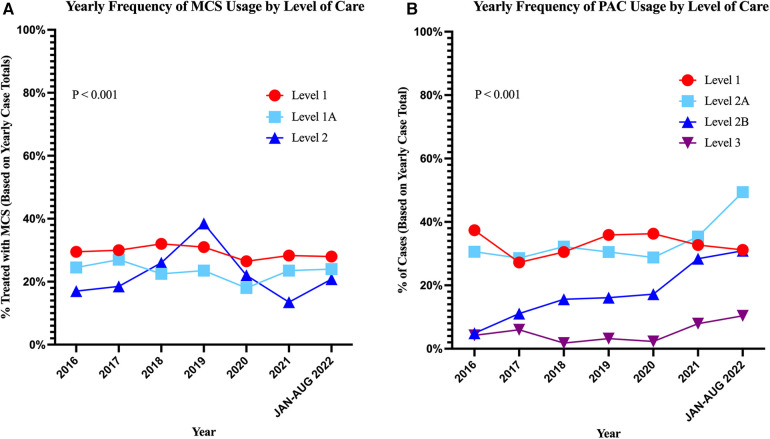
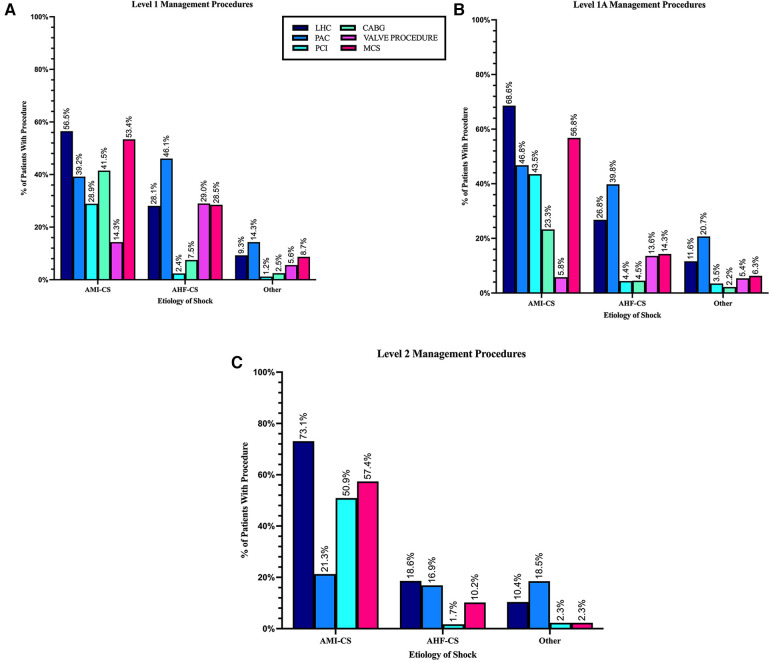
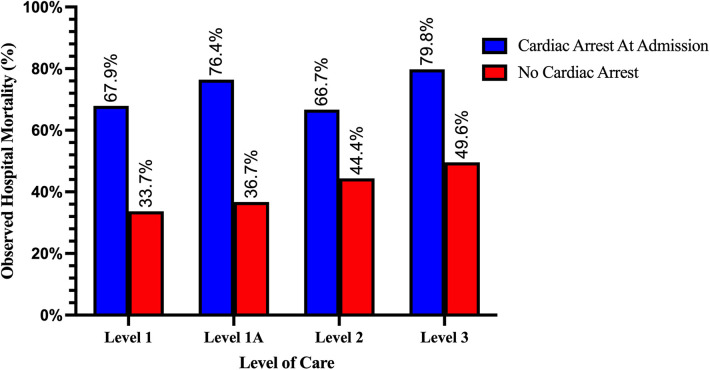
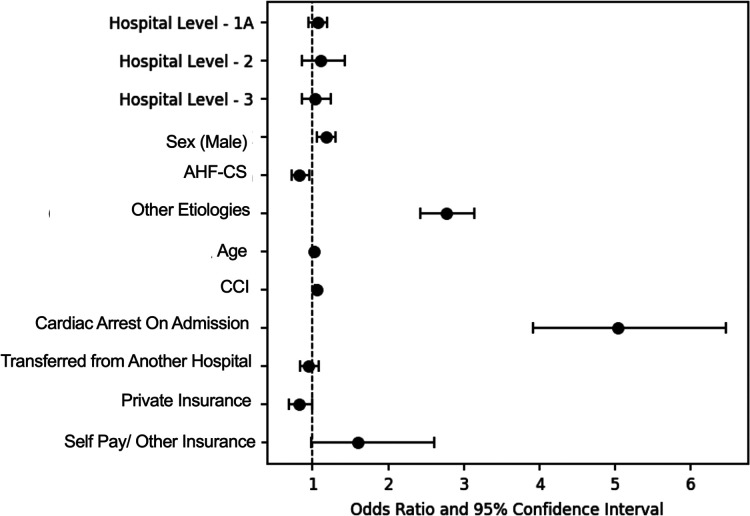
Results: Higher LOC centers had higher volumes: L-1 (n = 1): 2,831 patients, L-1A (n = 4): 3,452, L-2 (n = 1): 340, and L-3 (n = 5): 780. Emergency room admissions were more common in lower LOC (96% at L-3 vs. 46% L-1; p < 0.001), while hospital transfers were predominant at higher LOC (40% at L-1 vs. 2.7% at L-3; p < 0.001). Men comprised 61% of the cohort. Patients were younger in the higher LOC [69 (60-78) years at L-1 vs. 77 (67-85) years at L-3; p < 0.001]. Patients with acute myocardial infarction (AMI)-CS and acute heart failure (AHF)-CS were concentrated in higher LOC centers while other etiologies of CS were more common in L-2 and L-3 (p < 0.001). Cardiac arrest on admission was more prevalent in lower LOC centers (L-1: 2.8% vs. L-3: 12.1%; p < 0.001). Patients with AMI-CS received more percutaneous coronary intervention in lower LOC (51% L-2 vs. 29% L-1; p < 0.01) but more coronary arterial bypass graft surgery at higher LOC (L-1: 42% vs. L-1A: 23%; p < 0.001). MCS use was consistent across levels for AMI-CS but was more frequent in higher LOC for AHF-CS patients (L-1: 28% vs. L-2: 10%; p < 0.001). Despite increasing in-hospital mortality with decreasing LOC, no significant difference was seen after multivariable adjustment.
Conclusion: This is the first report describing a pragmatic classification of LOC for CS which, based on MCS capabilities, can discriminate between centers with distinct demographics, practice patterns, and outcomes. This classification may serve as the basis for future research and the creation of CS systems of care.
Keywords: acute heart failure; acute myocardial infarction; cardiogenic shock; cardiogenic shock centers; levels of care; mechanical circulatory support.
© 2023 Alvarez Villela, Fu, Roslin, Smoller, Asemota, Miklin, Kodra, Vullaganti, Roswell, Rangasamy, Saikus, Kon, Pierce, Husk, Stevens and Maybaum.
Conflict of interest statement
The authors declare that the research was conducted in the absence of any commercial or financial relationships that could be construed as a potential conflict of interest.
Figures
References
-
- Berg DD, Bohula EA, Van Diepen S, Katz JN, Alviar CL, Baird-Zars VM, et al. Epidemiology of shock in contemporary cardiac intensive care units: data from the critical care cardiology trials network registry. Circ Cardiovasc Qual Outcomes. (2019) 12:e005618. 10.1161/CIRCOUTCOMES.119.005618 - DOI - PMC - PubMed
LinkOut - more resources
Full Text Sources