

Comparative genomic analysis of pleurotus species reveals insights into the evolution and coniferous utilization of Pleurotus placentodes
- PMID: 38028535
- PMCID: PMC10658006
- DOI: 10.3389/fmolb.2023.1292556
Comparative genomic analysis of pleurotus species reveals insights into the evolution and coniferous utilization of Pleurotus placentodes
Abstract
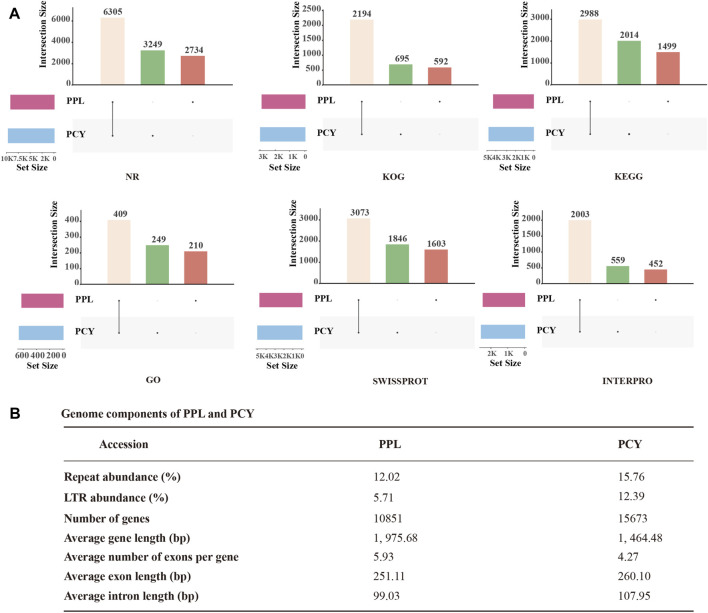
Pleurotus placentodes (PPL) and Pleurotus cystidiosus (PCY) are economically valuable species. PPL grows on conifers, while PCY grows on broad-leaved trees. To reveal the genetic mechanism behind PPL's adaptability to conifers, we performed de novo genome sequencing and comparative analysis of PPL and PCY. We determined the size of the genomes for PPL and PCY to be 36.12 and 42.74 Mb, respectively, and found that they contain 10,851 and 15,673 protein-coding genes, accounting for 59.34% and 53.70% of their respective genome sizes. Evolution analysis showed PPL was closely related to P. ostreatus with the divergence time of 62.7 MYA, while PCY was distantly related to other Pleurotus species with the divergence time of 111.7 MYA. Comparative analysis of carbohydrate-active enzymes (CAZYmes) in PPL and PCY showed that the increase number of CAZYmes related to pectin and cellulose degradation (e.g., AA9, PL1) in PPL may be important for the degradation and colonization of conifers. In addition, geraniol degradation and peroxisome pathways identified by comparative genomes should be another factors for PPL's tolerance to conifer substrate. Our research provides valuable genomes for Pleurotus species and sheds light on the genetic mechanism of PPL's conifer adaptability, which could aid in breeding new Pleurotus varieties for coniferous utilization.
Keywords: Pleurotus placentodes; adaption; coniferous utilization; evolution; genome sequencing.
Copyright © 2023 Sun, Yin, Sossah, Han and Li.
Conflict of interest statement
The authors declare that the research was conducted in the absence of any commercial or financial relationships that could be construed as a potential conflict of interest.
Figures


Similar articles
-
Pleurotus eryngii Genomes Reveal Evolution and Adaptation to the Gobi Desert Environment.Front Microbiol. 2019 Sep 3;10:2024. doi: 10.3389/fmicb.2019.02024. eCollection 2019. Front Microbiol. 2019. PMID: 31551962 Free PMC article.
-
Comparative transcriptomics of Pleurotus eryngii reveals blue-light regulation of carbohydrate-active enzymes (CAZymes) expression at primordium differentiated into fruiting body stage.Genomics. 2018 May;110(3):201-209. doi: 10.1016/j.ygeno.2017.09.012. Epub 2017 Sep 29. Genomics. 2018. PMID: 28970048
-
Integrative analysis of genome and transcriptome reveal the genetic basis of high temperature tolerance in pleurotus giganteus (Berk. Karun & Hyde).BMC Genomics. 2023 Sep 18;24(1):552. doi: 10.1186/s12864-023-09669-8. BMC Genomics. 2023. PMID: 37723428 Free PMC article.
-
Whole-genome sequence of a high-temperature edible mushroom Pleurotus giganteus (zhudugu).Front Microbiol. 2022 Aug 16;13:941889. doi: 10.3389/fmicb.2022.941889. eCollection 2022. Front Microbiol. 2022. PMID: 36051764 Free PMC article.
-
The ligninolytic peroxidases in the genus Pleurotus: divergence in activities, expression, and potential applications.Appl Microbiol Biotechnol. 2015 Feb;99(3):1025-38. doi: 10.1007/s00253-014-6256-8. Epub 2014 Dec 12. Appl Microbiol Biotechnol. 2015. PMID: 25503316 Review.
References
-
- Araújo N. L., Avelino K. V., Halabura M. I. W., Marim R. A., Kassem A. S. S., Linde G. A., et al. (2021). Use of green light to improve the production of lignocellulose-decay enzymes by Pleurotus spp. in liquid cultivation. Enzyme Microb. Technol. 149, 109860. 10.1016/j.enzmictec.2021.109860 - DOI - PubMed
-
- Atanasova L., Dubey M., Grujić M., Gudmundsson M., Lorenz C., Sandgren M., et al. (2018). Evolution and functional characterization of pectate lyase PEL12, a member of a highly expanded Clonostachys rosea polysaccharide lyase 1 family. BMC Microbiol. 18, 178. 10.1186/s12866-018-1310-9 - DOI - PMC - PubMed
-
- Berkeley M. J. (1852). Decades of fungi, XXXVII, XXXVIII. Sikkim and Khassya fungi. Hooker’s J. Bot. Kew Gard. Misc. 4, 97–107.
LinkOut - more resources
Full Text Sources
Miscellaneous