. 2023 Oct 30:14:1282824.
doi: 10.3389/fgene.2023.1282824. eCollection 2023.

Clinically impactful metabolic subtypes of pancreatic ductal adenocarcinoma (PDAC)

Affiliations

Clinically impactful metabolic subtypes of pancreatic ductal adenocarcinoma (PDAC)

Jannat Pervin et al. Front Genet. .

Abstract

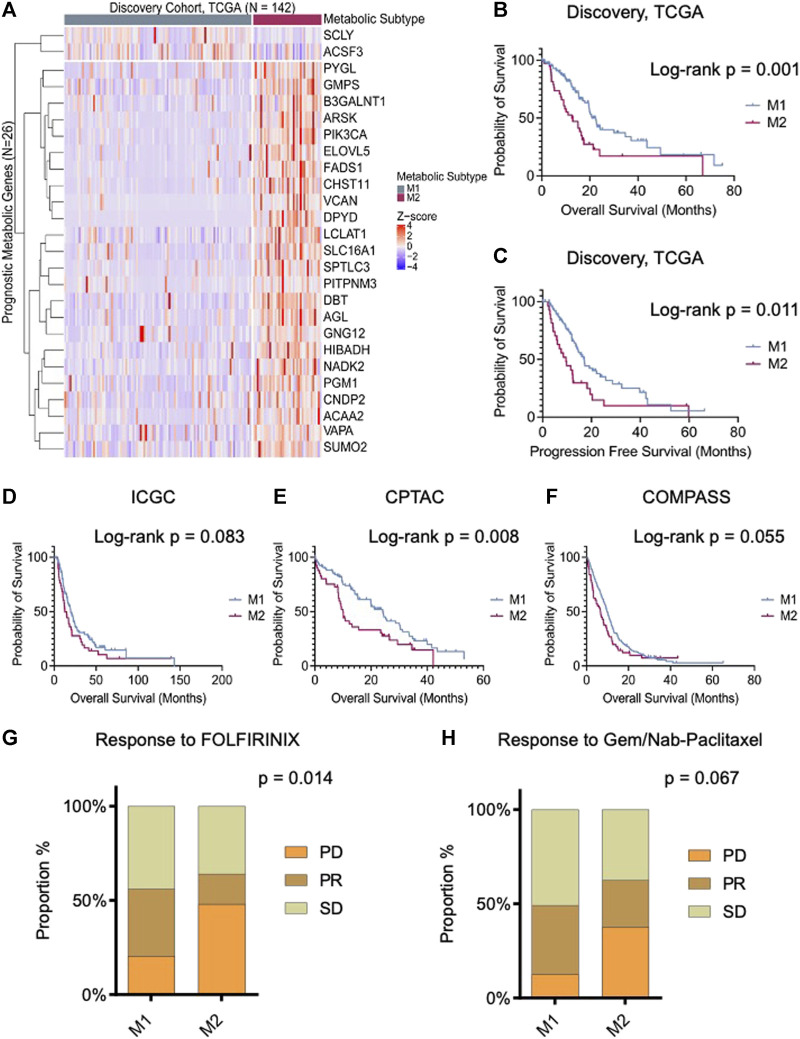
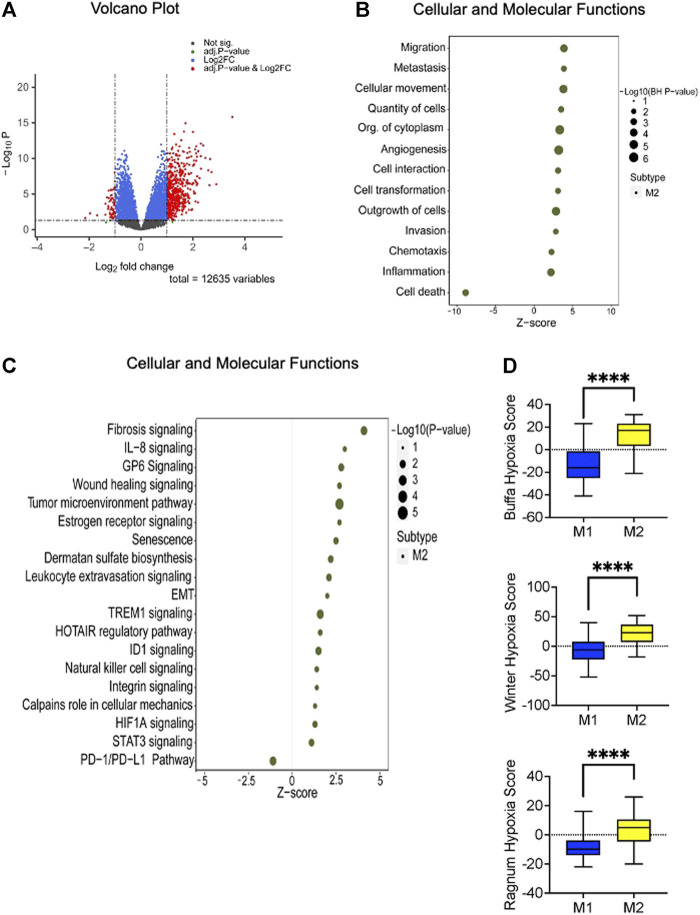
Background: Pancreatic ductal adenocarcinoma (PDAC) is a lethal disease characterized by a diverse tumor microenvironment. The heterogeneous cellular composition of PDAC makes it challenging to study molecular features of tumor cells using extracts from bulk tumor. The metabolic features in tumor cells from clinical samples are poorly understood, and their impact on clinical outcomes are unknown. Our objective was to identify the metabolic features in the tumor compartment that are most clinically impactful. Methods: A computational deconvolution approach using the DeMixT algorithm was applied to bulk RNASeq data from The Cancer Genome Atlas to determine the proportion of each gene's expression that was attributable to the tumor compartment. A machine learning algorithm designed to identify features most closely associated with survival outcomes was used to identify the most clinically impactful metabolic genes. Results: Two metabolic subtypes (M1 and M2) were identified, based on the pattern of expression of the 26 most important metabolic genes. The M2 phenotype had a significantly worse survival, which was replicated in three external PDAC cohorts. This PDAC subtype was characterized by net glycogen catabolism, accelerated glycolysis, and increased proliferation and cellular migration. Single cell data demonstrated substantial intercellular heterogeneity in the metabolic features that typified this aggressive phenotype. Conclusion: By focusing on features within the tumor compartment, two novel and clinically impactful metabolic subtypes of PDAC were identified. Our study emphasizes the challenges of defining tumor phenotypes in the face of the significant intratumoral heterogeneity that typifies PDAC. Further studies are required to understand the microenvironmental factors that drive the appearance of the metabolic features characteristic of the aggressive M2 PDAC phenotype.

Keywords: deconvolution; metabolism; pancreatic cancer; pancreatic ductal adenocarcinoma; prognosis.


Conflict of interest statement

HighLifeR is owned by Qualisure Diagnostics Inc., and OB is director and shareholder of Qualisure Diagnostics Inc. The remaining authors declare that the research was conducted in the absence of any commercial or financial relationships that could be construed as a potential conflict of interest.

Figures

FIGURE 1
FIGURE 1
Prognostic tumor metabolic subtypes in pancreatic ductal adenocarcinoma (PDAC). (A) Unsupervised clustering (k = 2) illustrating distinct metabolic subgroups in the TCGA PDAC cohort (N = 142). The heatmap depicts expression levels of prognostic metabolic genes within the identified subtypes, highlighting both “lower-risk” (M1) and “high-risk” (M2) groups. (B,C) Kaplan-Meier plot displaying the overall and progression-free survival of the metabolic subtypes in the discovery cohort, demonstrating significant differences in survival outcomes. (D−F) Overall survival analysis of resectable PDAC patients: International Cancer Genome Consortium (ICGC, n = 172), Clinical Proteomic Tumor Analysis Consortium (CPTAC, n = 140), and unresectable patients from the COMPASS cohort (n = 272) stratified according to predicted metabolic subtypes. (G,H) Bar chart presents the responses to the first line treatment in COMPASS cohort. M1 subtype exhibits stable and partial responses to both FOLFIRINOX and Gemcitabine/Nab-paclitaxel. On the contrary, M2 group shows poor response to gemcitabine and combined therapy. Log-rank and Chi-square p-values are shown in the figure.
FIGURE 2
FIGURE 2
Association of identified metabolic subtypes with PDAC molecular subtypes and immune subtypes. (A) Stacked bar charts depicting the distribution of patients in the M1 and M2 PDAC tumor metabolic subtypes, alongside their intersection with previously reported PDAC molecular subtypes (Collison et al., 2011; Moffit et al., 2015; Bailey et al., 2016). (B) Proportions of immune subtypes as described by Thorsson et al. (2018) are presented within the identified tumor metabolic subtypes. Chi-square p-values are provided to assess the significance of associations.
FIGURE 3
FIGURE 3
Altered canonical pathways and functions linked to the high-risk (M2) subtype. (A) Volcano plot demonstrating the differentially expressed genes (n = 551) between the identified metabolic subtypes. Statistical significance is represented by BH adjusted p-value of 0.05 and a Log2 fold change threshold of ±1. (B) Ingenuity Pathway Analysis (IPA) of the differentially expressed genes reveals that the high-risk subtype is positively enriched in cellular proliferation, migration, and invasion. The enrichment analysis yields adjusted p-value less than or equal to 0.05. (C) Disrupted canonical pathways associated with M2 metabolic subtype encompass crucial signaling pathways. Fisher’s exact test results indicate a significance level of less than or equal to 0.05. The x-axis represents the activated z-score with sizes indicating the level of significance (right side of the plot). (D) The box plot illustrates the hypoxia scores associated with the identified metabolic subtypes. Based on previous studies (Winter et al., 2007; Buffa et al., 2010; Ragnum at el., 2014) patients with the M2 phenotype exhibits higher scores than M1 phenotype. The statistical significance of these comparisons was assessed using the Mann-Whitney U test, with a p-value threshold set at 0.05 or less.

References

    1. Avila Cobos F., Alquicira-Hernandez J., Powell J. E., Mestdagh P., De Preter K. (2020). Benchmarking of cell type deconvolution pipelines for transcriptomics data. Nat. Commun. 11 (1), 5650. 10.1038/s41467-020-19015-1 - DOI - PMC - PubMed
    1. Alpertunga I., Sadiq R., Pandya D., Lo T., Dulgher M., Evans S., et al. (2021). Glycemic control as an early prognostic marker in advanced pancreatic cancer. Front. Oncol. 11, 571855. 10.3389/fonc.2021.571855 - DOI - PMC - PubMed
    1. Anandanadesan R., Gong Q., Chipitsyna G., Witkiewicz A., Yeo C. J., Arafat H. A. (2007). Angiotensin II induces vascular endothelial growth factor in pancreatic cancer cells through an angiotensin II type 1 receptor and ERK1/2 signaling. J. Gastrointest. Surg. 12 (1), 57–66. 10.1007/s11605-007-0403-9 - DOI - PubMed
    1. Aung K. L., Fischer S. E., Denroche R. E., Jang G. H., Dodd A., Creighton S., et al. (2018). Genomics-driven precision medicine for advanced pancreatic cancer: early results from the compass trial. Clin. Cancer Res. 24 (6), 1344–1354. 10.1158/1078-0432.ccr-17-2994 - DOI - PMC - PubMed
    1. Bailey P., Chang D. K., Nones K., Johns A. L., Patch A. M., Gingras M. C., et al. (2016). Genomic analyses identify molecular subtypes of pancreatic cancer. Nature 531 (7592), 47–52. 10.1038/nature16965 - DOI - PubMed

LinkOut - more resources