

Pediatric intensive care unit treatment alters the diversity and composition of the gut microbiota and antimicrobial resistance gene expression in critically ill children
- PMID: 38029168
- PMCID: PMC10679412
- DOI: 10.3389/fmicb.2023.1237993
Pediatric intensive care unit treatment alters the diversity and composition of the gut microbiota and antimicrobial resistance gene expression in critically ill children
Abstract
Introduction: Common critical illnesses are a growing economic burden on healthcare worldwide. However, therapies targeting the gut microbiota for critical illnesses have not been developed on a large scale. This study aimed to investigate the changes in the characteristics of the gut microbiota in critically ill children after short-term pediatric intensive care unit (PICU) treatments.
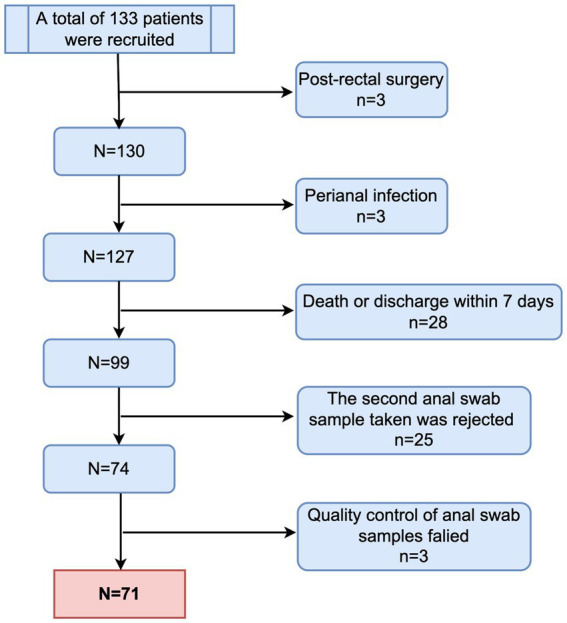
Methods: Anal swab samples were prospectively collected from March 2021 to March 2022 from children admitted to the PICU of Xinhua Hospital who received broad-spectrum antibiotics on days 1 (the D1 group) and 7 (the D7 group) of the PICU treatment. The structural and functional characteristics of the gut microbiota of critically ill children were explored using metagenomic next-generation sequencing (mNGS) technology, and a comparative analysis of samples from D1 and D7 was conducted.
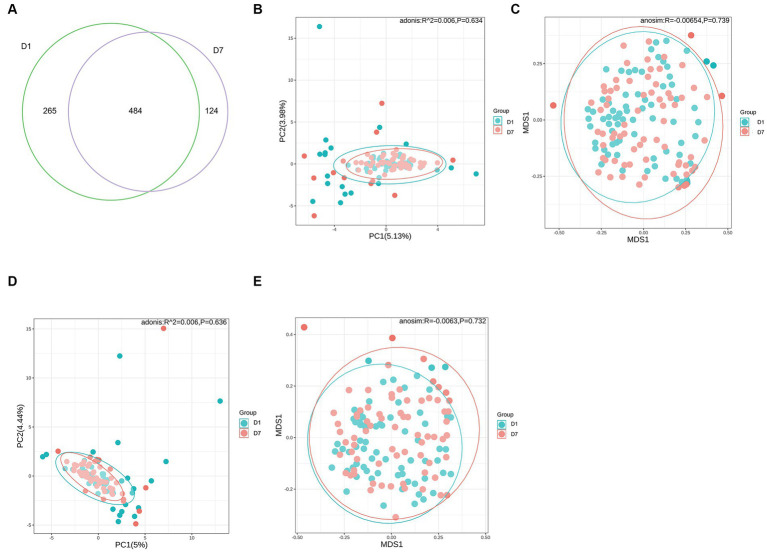
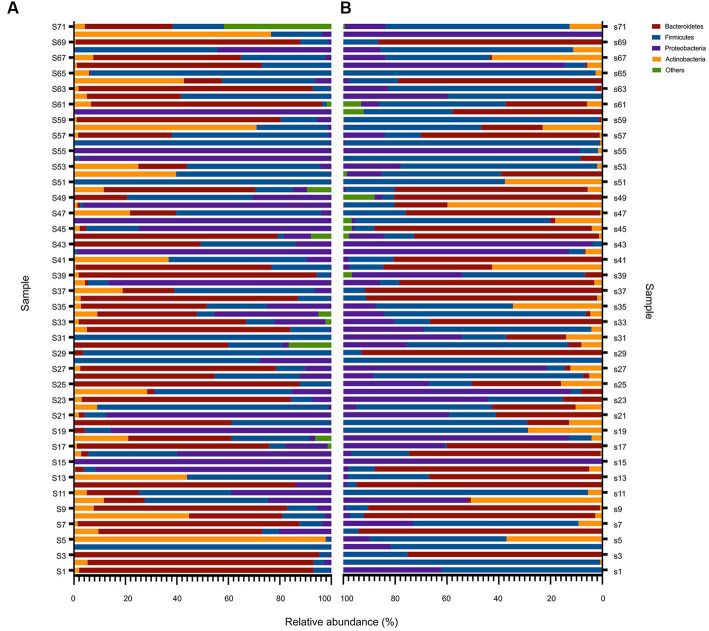
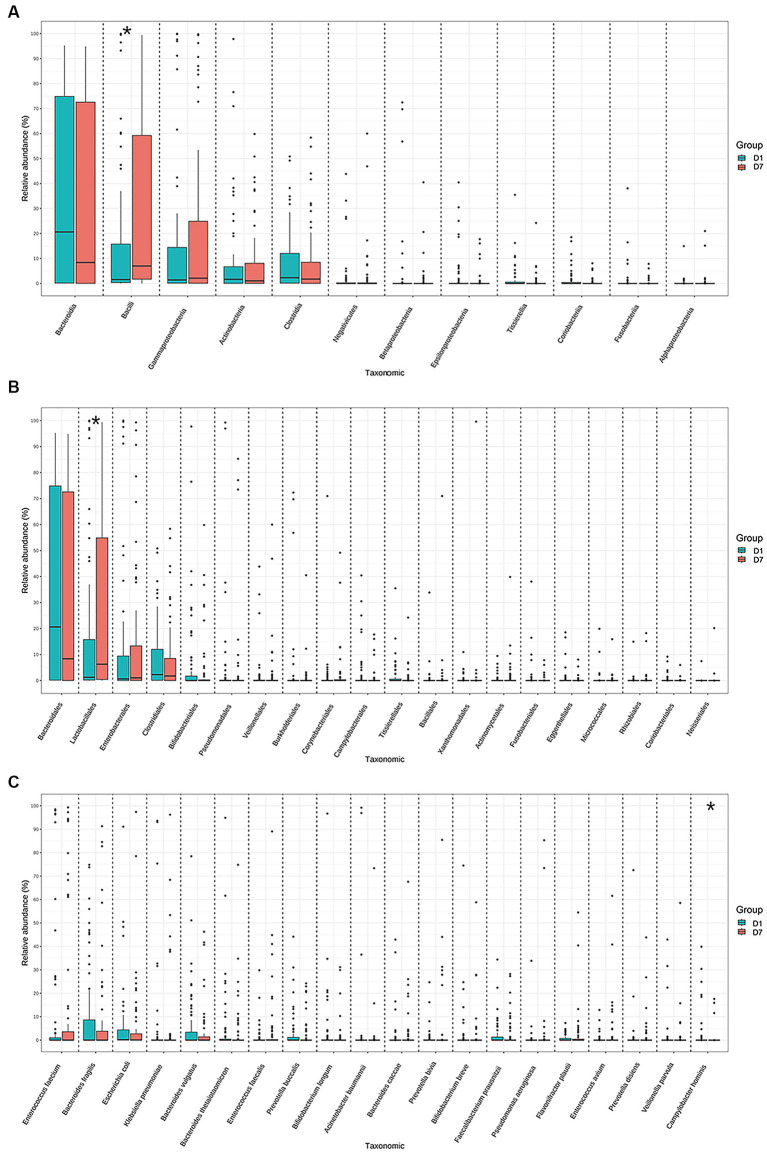
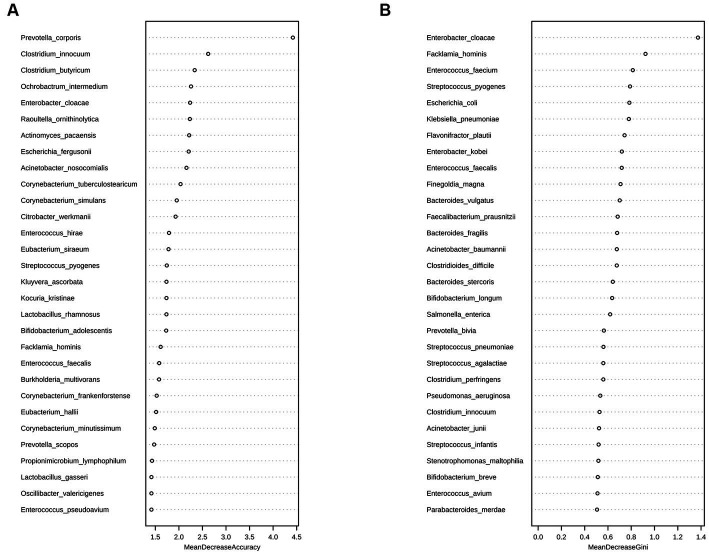
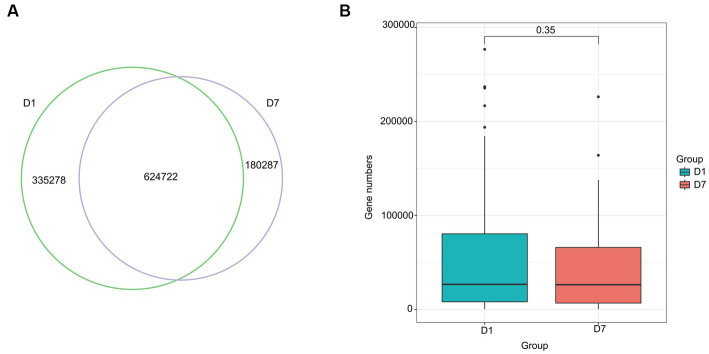
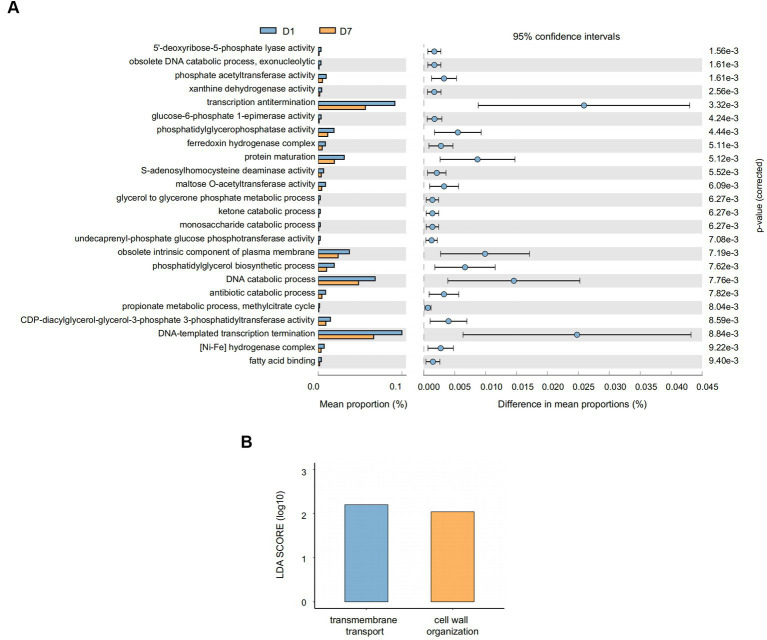
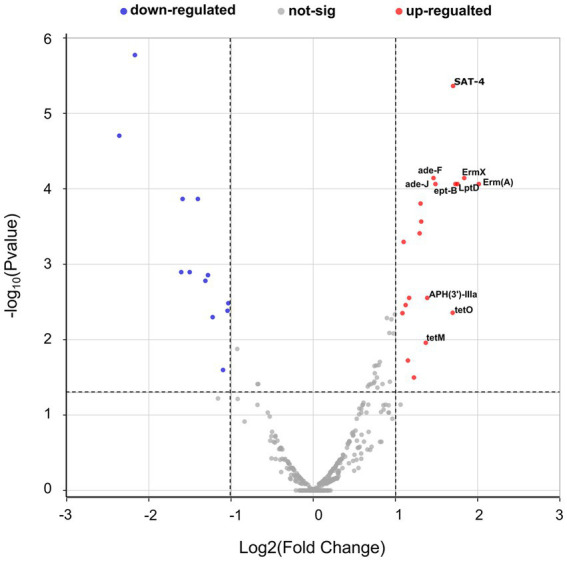
Results: After 7 days of PICU admission, a significant decrease was noted in the richness of the gut microbiota in critically ill children, while the bacterial diversity and the community structure between groups remained stable to some extent. The relative abundance of Bacilli and Lactobacillales was significantly higher, and that of Campylobacter hominis was significantly lower in the D7 group than in the D1 group. The random forest model revealed that Prevotella coporis and Enterobacter cloacae were bacterial biomarkers between groups. LEfSe revealed that two Gene Ontology entries, GO:0071555 (cell wall organization) and GO:005508 (transmembrane transport), changed significantly after the short-term treatment in the PICU. In addition, 30 KEGG pathways were mainly related to the activity of enzymes and proteins during the processes of metabolism, DNA catabolism and repair, and substance transport. Finally, 31 antimicrobial resistance genes had significantly different levels between the D7 and D1 groups. The top 10 up-regulated genes were Erm(A), ErmX, LptD, eptB, SAT-4, tetO, adeJ, adeF, APH(3')-IIIa, and tetM.
Conclusion: The composition, gene function, and resistance genes of gut microbiota of critically ill children can change significantly after short PICU treatments. Our findings provide a substantial basis for a better understanding of the structure and function of gut microbiota and their role in critical illnesses.
Keywords: children; critical illness; drug resistance genes; gut microbiota; infection.
Copyright © 2023 Xu, Kong, Li, Mao, Zhu, Zhu and Xu.
Conflict of interest statement
The authors declare that the research was conducted in the absence of any commercial or financial relationships that could be construed as a potential conflict of interest.
Figures

Similar articles
-
Disruption of the microbiota across multiple body sites in critically ill children.Microbiome. 2016 Dec 29;4(1):66. doi: 10.1186/s40168-016-0211-0. Microbiome. 2016. PMID: 28034303 Free PMC article.
-
Enteral feeding and the microbiome in critically ill children: a narrative review.Transl Pediatr. 2021 Oct;10(10):2778-2791. doi: 10.21037/tp-20-349. Transl Pediatr. 2021. PMID: 34765500 Free PMC article. Review.
-
Gut microbiota alterations in critically ill older patients: a multicenter study.BMC Geriatr. 2022 Apr 28;22(1):373. doi: 10.1186/s12877-022-02981-0. BMC Geriatr. 2022. PMID: 35484500 Free PMC article.
-
Comparative gut microbiota and resistome profiling of intensive care patients receiving selective digestive tract decontamination and healthy subjects.Microbiome. 2017 Aug 14;5(1):88. doi: 10.1186/s40168-017-0309-z. Microbiome. 2017. PMID: 28803549 Free PMC article.
-
Gut Microbiome-Based Therapeutics in Critically Ill Adult Patients-A Narrative Review.Nutrients. 2023 Nov 9;15(22):4734. doi: 10.3390/nu15224734. Nutrients. 2023. PMID: 38004128 Free PMC article. Review.
Cited by
-
The tongue coating microbiome is perturbed in atrial fibrillation and partly normalized after catheter ablation.Front Microbiol. 2025 Apr 30;16:1508089. doi: 10.3389/fmicb.2025.1508089. eCollection 2025. Front Microbiol. 2025. PMID: 40371119 Free PMC article.
-
Fecal carriage and molecular characterization of carbapenem-resistant Enterobacteriaceae from hospitalized children in a tertiary hospital of Shandong, China.Front Microbiol. 2025 Feb 18;16:1542207. doi: 10.3389/fmicb.2025.1542207. eCollection 2025. Front Microbiol. 2025. PMID: 40041867 Free PMC article.
-
Ketogenic diet in treating sepsis-related acquired weakness: is it friend or foe?Front Nutr. 2024 Nov 28;11:1484856. doi: 10.3389/fnut.2024.1484856. eCollection 2024. Front Nutr. 2024. PMID: 39668897 Free PMC article. Review.
-
Integrating sequencing methods with machine learning for antimicrobial susceptibility testing in pediatric infections: current advances and future insights.Front Microbiol. 2025 Mar 5;16:1528696. doi: 10.3389/fmicb.2025.1528696. eCollection 2025. Front Microbiol. 2025. PMID: 40109965 Free PMC article. Review.
-
The enteroendocrine axis and its effect on gastrointestinal function, nutrition, and inflammation.Curr Opin Crit Care. 2024 Aug 1;30(4):290-297. doi: 10.1097/MCC.0000000000001175. Epub 2024 Jun 13. Curr Opin Crit Care. 2024. PMID: 38872371 Free PMC article. Review.
References
-
- Andremont O., Armand-Lefevre L., Dupuis C., de Montmollin E., Ruckly S., Lucet J. C., et al. . (2020). Semi-quantitative cultures of throat and rectal swabs are efficient tests to predict ESBL-Enterobacterales ventilator-associated pneumonia in mechanically ventilated ESBL carriers. Intensive Care Med. 46, 1232–1242. doi: 10.1007/s00134-020-06029-y, PMID: - DOI - PMC - PubMed
LinkOut - more resources
Full Text Sources
Research Materials