. 2023 Nov 1:13:1266884.
doi: 10.3389/fcimb.2023.1266884. eCollection 2023.

Comparative proteome analysis revealed the differences in response to both Mycobacterium tuberculosis and Mycobacterium bovis infection of bovine alveolar macrophages

Affiliations

Comparative proteome analysis revealed the differences in response to both Mycobacterium tuberculosis and Mycobacterium bovis infection of bovine alveolar macrophages

Yurong Cai et al. Front Cell Infect Microbiol. .

Abstract

Tuberculosis (TB), attributed to the Mycobacterium tuberculosis complex, is one of the most serious zoonotic diseases worldwide. Nevertheless, the host mechanisms preferentially leveraged by Mycobacterium remain unclear. After infection, both Mycobacterium tuberculosis (MTB) and Mycobacterium bovis (MB) bacteria exhibit intimate interactions with host alveolar macrophages; however, the specific mechanisms underlying these macrophage responses remain ambiguous. In our study, we performed a comparative proteomic analysis of bovine alveolar macrophages (BAMs) infected with MTB or MB to elucidate the differential responses of BAMs to each pathogen at the protein level. Our findings revealed heightened TB infection susceptibility of BAMs that had been previously infected with MTB or MB. Moreover, we observed that both types of mycobacteria triggered significant changes in BAM energy metabolism. A variety of proteins and signalling pathways associated with autophagy and inflammation-related progression were highly activated in BAMs following MB infection. Additionally, proteins linked to energy metabolism were highly expressed in BAMs following MTB infection. In summary, we propose that BAMs may resist MTB and MB infections via different mechanisms. Our findings provide critical insights into TB pathogenesis, unveiling potential biomarkers to facilitate more effective TB treatment strategies. Additionally, our data lend support to the hypothesis that MTB may be transmitted via cross-species infection.

Keywords: Mycobacterium tuberculosis; autophagy; bovine tuberculosis; inflammatory response; resistance mechanism.


Conflict of interest statement

The authors declare that the research was conducted in the absence of any commercial or financial relationships that could be construed as a potential conflict of interest.

Figures

Figure 1
Figure 1
Evaluation of integral proteomic profiles from three treatments. (A) Principal component (PC) analysis of protein profiling data of MB-infected, MTB-infected and control BAM groups. Each replicate that received the same treatment is shown in the same plots (red: bovine; green: MB; and blue: MTB). PC1 of the integral proteomic data explained 36.6% of the variance, and PC2 explained 21.6% of the variance. (B) Correlation analysis of integral protein data from three treatment groups. The Pearson correlation value is shown for the cells.
Figure 2
Figure 2
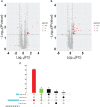
Identification of differentially expressed proteins in both MB vs. BAM and MTB vs. BAM pairwise comparison groups. (A, B) Volcano plots showing the potential MTB- (A) and MB-induced (B) metabolomic features in BAMs. Red points indicate significantly upregulated proteins between the two groups (Log1.5 FC < -1.0 or > 1.0; q-value < 0.05). The blue points show the significantly downregulated proteins between the two groups. The grey points show tentatively matched features with no significant differences. The horizontal and vertical dashed lines represent a P value = 0.05 and FC = 1.5, respectively. (C) Venn diagrams representing the overlapping identified differentially expressed proteins in both the MB vs. BAM and MTB vs. BAM pairwise comparison groups; the overlapping proteins were upregulated in any two groups and specifically differentially expressed in MB- and MTB-infected BAMs.
Figure 3
Figure 3
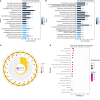
Functional annotation analysis of 9 upregulated proteins after MTB or MB infection. (A–C) GO categories enriched with bovine proteins. The proteins were categorised according to GO annotation terms, and the number of proteins enriched in the biological process (C), cellular component (A), and molecular function (B) categories is displayed. The number of proteins enriched in each GO category is displayed for each term. The colour of each column represents the significance of each enriched category. (D) The pathway enrichment analysis for these 9 significantly upregulated proteins in MB- and MTB-infected BAMs. The scatter plot shows the pathway impact and enrichment results for all 9 significantly upregulated proteins. Each point represents a different metabolic pathway. The various colour intensities indicates different levels of significance of the metabolic pathways from low (blue) to high (red). The different sizes of each point represent the number of proteins involved in the corresponding metabolic pathway. Moreover, the corresponding pathway name of each point is labelled.
Figure 4
Figure 4
Functional annotation analysis of the upregulated proteins that were activated only after MTB infection. (A) GO category analysis of the upregulated proteins associated with MTB infection. The proteins were categorised according to GO annotation terms, and the number of proteins enriched in cellular component (green) and molecular function (blue) categories is shown. The number of proteins in each GO category is displayed for each term. The colour of each column represents the significance of each enriched category. (B) Pathway enrichment analysis of upregulated proteins in MTB-infected BAM cells. The scatter plot shows the pathway impact and enrichment results for all significantly upregulated proteins. Each point represents a different metabolic pathway. The various colour intensities indicate different levels of significance of the metabolic pathways from low (blue) to high (red). The size of each point represents the number of proteins involved in each corresponding metabolic pathway.
Figure 5
Figure 5
Functional annotation analysis of significantly upregulated proteins associated with MB infection. (A, B) GO enrichment analysis for 51 upregulated proteins in BAMs after MB infection challenge. The proteins were categorised according to GO annotation terms, and the number of proteins in the cellular component (A), biological process and molecular function (B) categories is shown. The number of proteins involved in each GO category is displayed by enriched term. The colour of each column represents the significance of each enriched category. (C) Clustering analysis of proteins differentially expressed in the three treatment groups. Green indicates proteins with relatively low expression in the corresponding samples, whereas red indicates relatively high expression abundance. (D) The pathway enrichment results based on these MB-induced upregulated proteins in BAMs. The scatter plot shows the pathway impact and enrichment results for all 51 significantly upregulated proteins. Each point represents a different metabolic pathway. The various colour intensities indicate different levels of significance of the metabolic pathways from low (blue) to high (red). The number of proteins involved in each pathway is shown by the size of each corresponding point. (E) Functional classification of proteins as determined by eukaryotic orthologous group (KOG) analysis. The number of proteins in each KOG category is shown at the top of each column. J: translation, ribosomal structure and biogenesis; A: RNA processing and modification; K: transcription; L: replication, recombination and repair; B: chromatin structure and dynamics; D: cell cycle control, cell division, chromosome partitioning; Y: nuclear structure; V: Defence mechanisms; T: signal transduction mechanisms; M: cell wall/membrane/envelope biogenesis; N: cell motility; Z: cytoskeleton; W: extracellular structures; U: intracellular trafficking, secretion, and vesicular transport; O: posttranslational modification, protein turnover, chaperones; C: energy production and conversion; G: carbohydrate transport and metabolism; E: amino acid transport and metabolism; F: nucleotide transport and metabolism; H: coenzyme transport and metabolism; I: lipid transport and metabolism; P: inorganic ion transport and metabolism; Q: secondary metabolite biosynthesis, transport and catabolism; R: general function prediction only; S: function unknown.
Figure 6
Figure 6
Complex interaction and coexpression network of key MB-altered proteins. (A) Global protein interaction network analysis of significantly differentially expressed bovine proteins after MB infection enriched in key pathways and GO terms. All the key differentially expressed proteins were submitted to the STRING tool (http://string.embl.de/) and the protein–protein interaction network was thus predicted. (B) Coexpression network of significantly differentially expressed bovine proteins after MB infection that are enriched in key pathways and GO terms. The proteins shown in the red circle represent three downregulated proteins that were suppressed by MB infection in BAMs. The various colour intensities display the correlation level with the linked proteins from negative (blue) to positive (purple). (C) qRT–PCR verification of important defence- and autophagy-related proteins expression induced by MB infection. The relative expression levels are represented by the fold change of the value obtained via the 2-△△Ct method. (**P < 0.01).

References

    1. An M., Ryu D.-R., Won Park J., Ha Choi J., Park E.-M., Eun Lee K., et al. . (2017). ULK1 prevents cardiac dysfunction in obesity through autophagy-meditated regulation of lipid metabolism. Cardiovasc. Res. 113 (10), 1137–1147. doi: 10.1093/cvr/cvx064 - DOI - PubMed
    1. Athman J. J., Wang Y., McDonald D. J., Boom W. H., Harding C. V., Wearsch P. A.. (2015). Bacterial membrane vesicles mediate the release of mycobacterium tuberculosis lipoglycans and lipoproteins from infected macrophages. J. Immunol. (Baltimore Md. 1950) 195 (3), 1044–1053. doi: 10.4049/jimmunol.1402894 - DOI - PMC - PubMed
    1. Bach H., Papavinasasundaram K. G., Wong D., Hmama Z., Av-Gay Y.. (2008). Mycobacterium tuberculosis virulence is mediated by PtpA dephosphorylation of human vacuolar protein sorting 33B. Cell Host Microbe 3 (5), 316–322. doi: 10.1016/j.chom.2008.03.008 - DOI - PubMed
    1. Behr M. A., Gordon S. V. (2015). Why doesn't Mycobacterium tuberculosis spread in animals? Trends Microbiol. 23 (1), 1–2. doi: 10.1016/j.tim.2014.11.001 - DOI - PubMed
    1. Blázquez J., Espinosa de Los Monteros L. E., Samper S., Martín C., Guerrero A., Cobo J., et al. . (1997). Genetic characterization of multidrug-resistant Mycobacterium bovis strains from a hospital outbreak involving human immunodeficiency virus-positive patients. J. Clin. Microbiol. 35 (6), 1390–1393. doi: 10.1128/jcm.35.6.1390-1393.1997 - DOI - PMC - PubMed

Publication types