. 2023 Dec:68:102962.
doi: 10.1016/j.redox.2023.102962. Epub 2023 Nov 20.

Organic Selenium induces ferroptosis in pancreatic cancer cells

Affiliations

Organic Selenium induces ferroptosis in pancreatic cancer cells

Roberta Noè et al. Redox Biol. 2023 Dec.

Abstract

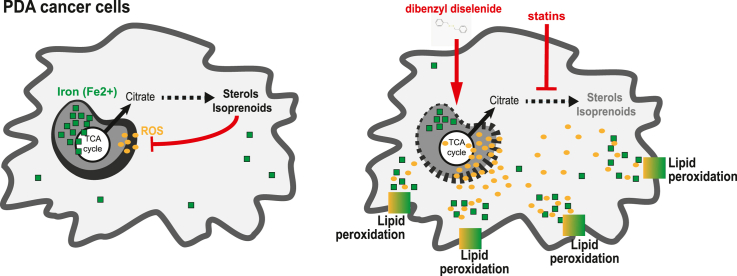
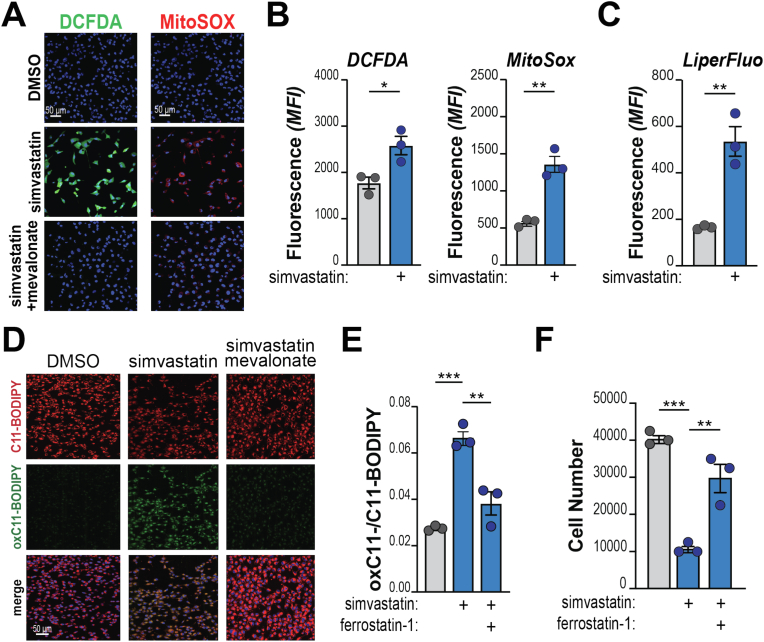
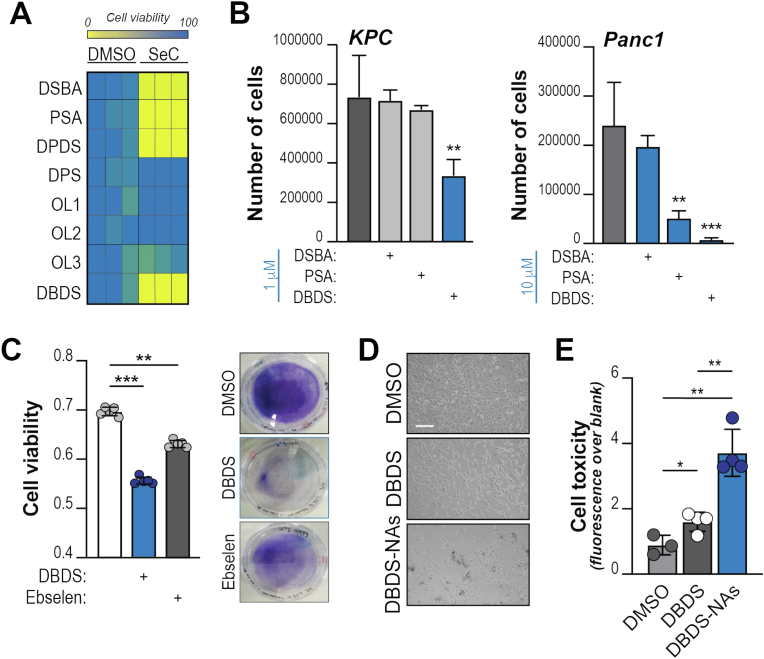
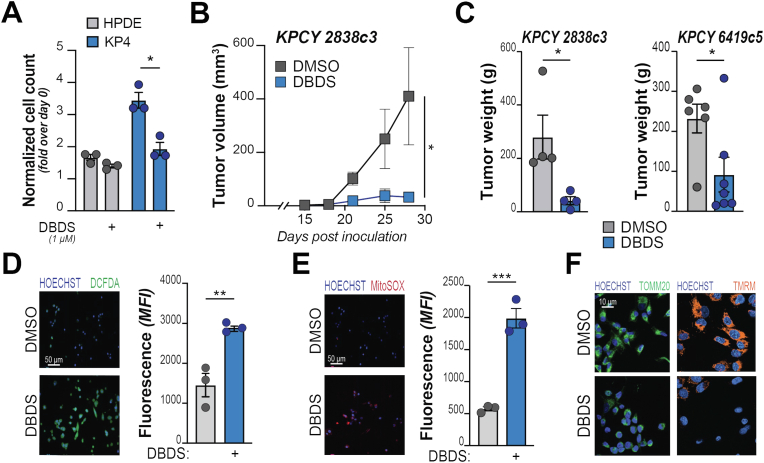
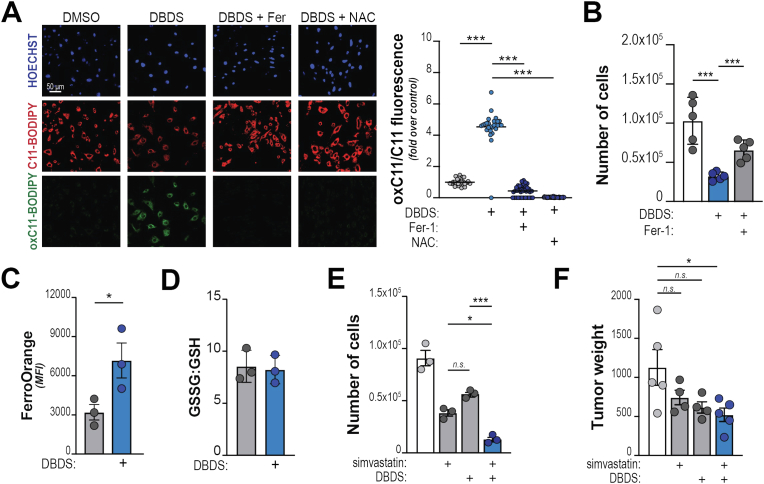
Pancreatic ductal adenocarcinoma (PDA) cells reprogram both mitochondrial and lysosomal functions to support growth. At the same time, this causes significant dishomeostasis of free radicals. While this is compensated by the upregulation of detoxification mechanisms, it also represents a potential vulnerability. Here we demonstrate that PDA cells are sensitive to the inhibition of the mevalonate pathway (MVP), which supports the biosynthesis of critical antioxidant intermediates and protect from ferroptosis. We attacked the susceptibility of PDA cells to ferroptotic death with selenorganic compounds, including dibenzyl diselenide (DBDS) that exhibits potent pro-oxidant properties and inhibits tumor growth in vitro and in vivo. DBDS treatment induces the mobilization of iron from mitochondria enabling uncontrolled lipid peroxidation. Finally, we showed that DBDS and statins act synergistically to promote ferroptosis and provide evidence that combined treatment is a viable strategy to combat PDA.

Keywords: Dibenzyl diselenide (DBDS); Ferroptosis; Mevalonate pathway (MVP); Pancreatic cancer; Selenorganic compounds.


Conflict of interest statement

Declaration of competing interest None.

Figures

Image 1
Graphical abstract
Fig. 1
Fig. 1
Inhibition of the mevalonate pathway triggers oxidative stress and ferroptosis in PDA. A, KP4 cells were treated with simvastatin (20 μM) w/or w/o supplementation with mevalonate (500 μM) for 2 h and stained for the detection of cytoplasmic (DCFDA, green) or mitochondrial (MitoSOX, red) ROS. Nuclei counterstained with HOECHST. Representative images (quantification in Suppl. Fig. 1). B–C, Flow cytometry analysis of KP4 treated with simvastatin (20 μM) showing enhanced ROS (B) and lipid peroxides (C) levels. D, KP4 cells were treated with simvastatin (20 μM) w/or w/o supplementation with mevalonate (500 μM) and incubated with C11-BODIPY after 1 h. Representative images of split channels (red: reduced C11; green: oxidized C11) and merge. E-F, KP4 cells were treated with simvastatin (20 μM) and/or Ferrostatin-1 (2 μM) and stained with C11-BODIPY (E). Graph shows the ratio between oxidized and reduced C11, quantified by flow cytometry (ratio of mean fluorescence intensity (MFI) for each sample). In F, cells were counted after 2 days. For all panels, experiments are representative of 2 independent biological repeats. Dots denote biological replicates. Bars show mean, ±SD (*, P < 0.05; **, P < 0.01; ***, P < 0.001; calculated over vehicle-treated cells unless otherwise indicated). (For interpretation of the references to color in this figure legend, the reader is referred to the Web version of this article.)
Fig. 2
Fig. 2
Dibenzyl diselenide is an anti-neoplastic compound.A, Indicated selenocompounds (SeC) were administered to KPC cells (100 μM). The heatmap shows percentage of growth relative to vehicle (DMSO)-treated cells (for each treatment, 100 %). DSBA: 2′,2′-diselanediyldibenzoic acid; PSA: phenylseleninic acid; DPDS: diphenyl diselenide; DPS: diphenylselenide; OL1: patented compound 1; OL2: patented compound 2; OL3: patented compound 3; DBDS: dibenzyl diselenide. B, KPC or Panc1 cells were treated with indicated compounds (1 μM and 10 μM, respectively) and counted after 3 days. C, KPC cells were treated with indicated compounds and stained with Crystal Violet after 2 days. Right, representative images of culture plates after staining. Left, quantification of solubilized dye; cell viability expressed as absorbance (blank subtracted). D, KPC cells were treated with DBDS or DBDS-loaded NAs (for both, final drug concentration: 1 μM). Representative images after 3 days. Scale bar: 100 μm. E, KPC cells were treated as in D and CellTox® assay was performed at endpoint. Experiments are representative of 2 independent biological repeats. Dots denote experimental replicates. For B-E, bars show mean, ±SD (*, P < 0.05; **, P < 0.01; ***, P < 0.001; calculated over vehicle-treated cells unless otherwise indicated). (For interpretation of the references to color in this figure legend, the reader is referred to the Web version of this article.)
Fig. 3
Fig. 3
DBDS elicits oxidative stress and inhibits tumor growth. A, Indicated cell lines (non-transformed: grey bars; PDA: blue bars) were treated with DBDS (1 μM) and counted after 2 days. Bars show increase of cell number (over cells counted at day 0 – pre-treatment). B–C, KPCY-derived tumor cell clones (2838c3 or 6419c5) were implanted subcutaneously into immune-competent C57BL/6J mice and treated with either DBDS (1 mg/kg) or vehicle (DMSO 1 %), three times per week after tumors became palpable (day 15 after inoculation). Tumor size (B) was monitored during the experiment; tumor weight (C) documented at end point. D-E, PDA cells were treated with DBDS (10 μM) and stained for the detection of cytoplasmic (DCFDA, in D) or mitochondrial (MitoSOX, in E) ROS. For each panel, representative images are shown on the left; FACS quantification on the right. F, KP4 cells were treated with DBDS (10 μM) and mitochondrial network morphology (green, left panels, showing outer membrane protein TOMM20) or polarization (orange, right panels, showing emission of TMRM) assessed by imaging. For A, C, D, E bars show mean, ±SD; dots denote biological replicates. For B, squares indicate mean ± SD at indicated time points. For all panels, *, P < 0.05; **, P < 0.01; ***, P < 0.001; calculated over vehicle-treated cells unless otherwise indicated. (For interpretation of the references to color in this figure legend, the reader is referred to the Web version of this article.)
Fig. 4
Fig. 4
DBDS is a ferroptosis inducer. A, KP4 cells were treated with DBDS (10 μM) w/or w/o supplementation with Ferrostatin-1 (Fer-1; 2 μM) or N-acetyl-cysteine (NAC; 10 μM) and incubated with C11-BODIPY for 15. Left, representative images. Right, quantification of red-to-green (indicative of lipid peroxidation) fluorescence shift. B, KP4 cells were treated with DBDS (5 μM) w/or w/o Ferrostatin-1 (2 μM) and counted after 2 days. C-D, KP4 cells were treated with DBDS (10 μM). C shows whole-cell iron abundance, quantified by flow cytometry (FerroOrange staining); D shows relative levels of GSH and GSSG levels. E, KP4 cells were treated with simvastatin (5 μM) and/or DBDS (1 μM) and cell viability examined after 2 days. F, 6419c5 cells were implanted subcutaneously into immune-competent C57BL/6J mice and treated with either DBDS (100 μg/kg) or simvastatin (10 mg/kg), or both, and tumor weight recorded at end point. For B, C, D, E, F, bars show mean, ±SD. For A, lines show mean, ±95 % CI. For all panels, dots denote experimental replicates. (*, P < 0.05; **, P < 0.01; ***, P < 0.001). (For interpretation of the references to color in this figure legend, the reader is referred to the Web version of this article.)

References

    1. Cheung E.C., Vousden K.H. The role of ROS in tumour development and progression. Nat. Rev. Cancer. 2022;22:280–297. doi: 10.1038/s41568-021-00435-0. - DOI - PubMed
    1. He D., Feng H., Sundberg B., Yang J., Powers J., Christian A.H., Wilkinson J.E., Monnin C., Avizonis D., Thomas C.J., Friedman R.A., Kluger M.D., Hollingsworth M.A., Grandgenett P.M., Klute K.A., Toste F.D., Chang C.J., Chio I.I.C. Methionine oxidation activates pyruvate kinase M2 to promote pancreatic cancer metastasis. Mol. Cell. 2022;82:3045–3060. doi: 10.1016/j.molcel.2022.06.005. e11. - DOI - PMC - PubMed
    1. Bar-Peled L., Kemper E.K., Suciu R.M., V Vinogradova E., Backus K.M., Horning B.D., Paul T.A., Ichu T.-A., Svensson R.U., Olucha J., Chang M.W., Kok B.P., Zhu Z., Ihle N.T., Dix M.M., Jiang P., Hayward M.M., Saez E., Shaw R.J., Cravatt B.F. Chemical proteomics identifies druggable vulnerabilities in a genetically defined cancer. Cell. 2017;171:696–709.e23. doi: 10.1016/j.cell.2017.08.051. - DOI - PMC - PubMed
    1. Nieborowska-Skorska M., Kopinski P.K., Ray R., Hoser G., Ngaba D., Flis S., Cramer K., Reddy M.M., Koptyra M., Penserga T., Glodkowska-Mrowka E., Bolton E., Holyoake T.L., Eaves C.J., Cerny-Reiterer S., Valent P., Hochhaus A., Hughes T.P., van der Kuip H., Sattler M., Wiktor-Jedrzejczak W., Richardson C., Dorrance A., Stoklosa T., Williams D.A., Skorski T. Rac2-MRC-cIII–generated ROS cause genomic instability in chronic myeloid leukemia stem cells and primitive progenitors. Blood. 2012;119:4253–4263. doi: 10.1182/blood-2011-10-385658. - DOI - PMC - PubMed
    1. Romani P., Nirchio N., Arboit M., Barbieri V., Tosi A., Michielin F., Shibuya S., Benoist T., Wu D., Hindmarch C.C.T., Giomo M., Urciuolo A., Giamogante F., Roveri A., Chakravarty P., Montagner M., Calì T., Elvassore N., Archer S.L., De Coppi P., Rosato A., Martello G., Dupont S. Mitochondrial fission links ECM mechanotransduction to metabolic redox homeostasis and metastatic chemotherapy resistance. Nat. Cell Biol. 2022;24:168–180. doi: 10.1038/s41556-022-00843-w. - DOI - PMC - PubMed

Substances