. 2023 Dec 7;186(25):5536-5553.e22.
doi: 10.1016/j.cell.2023.11.002. Epub 2023 Nov 28.

Early cellular mechanisms of type I interferon-driven susceptibility to tuberculosis

Affiliations

Early cellular mechanisms of type I interferon-driven susceptibility to tuberculosis

Dmitri I Kotov et al. Cell. .

Abstract

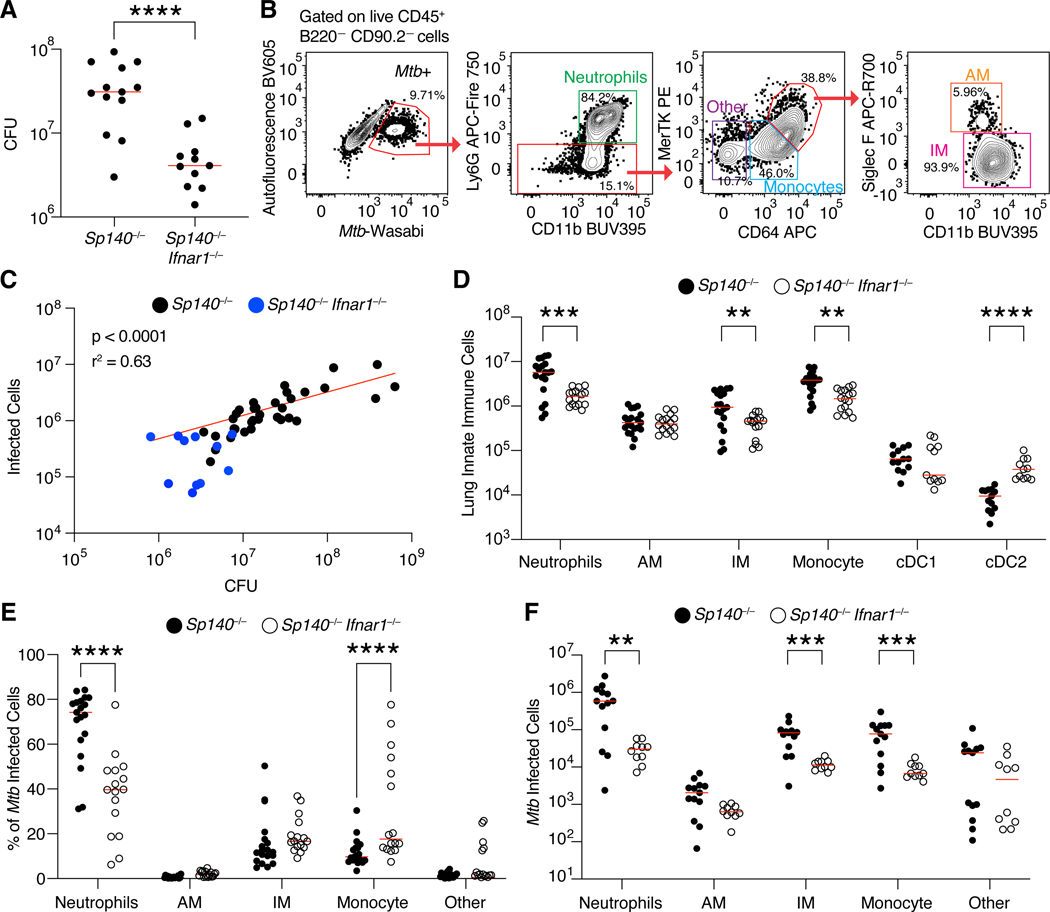
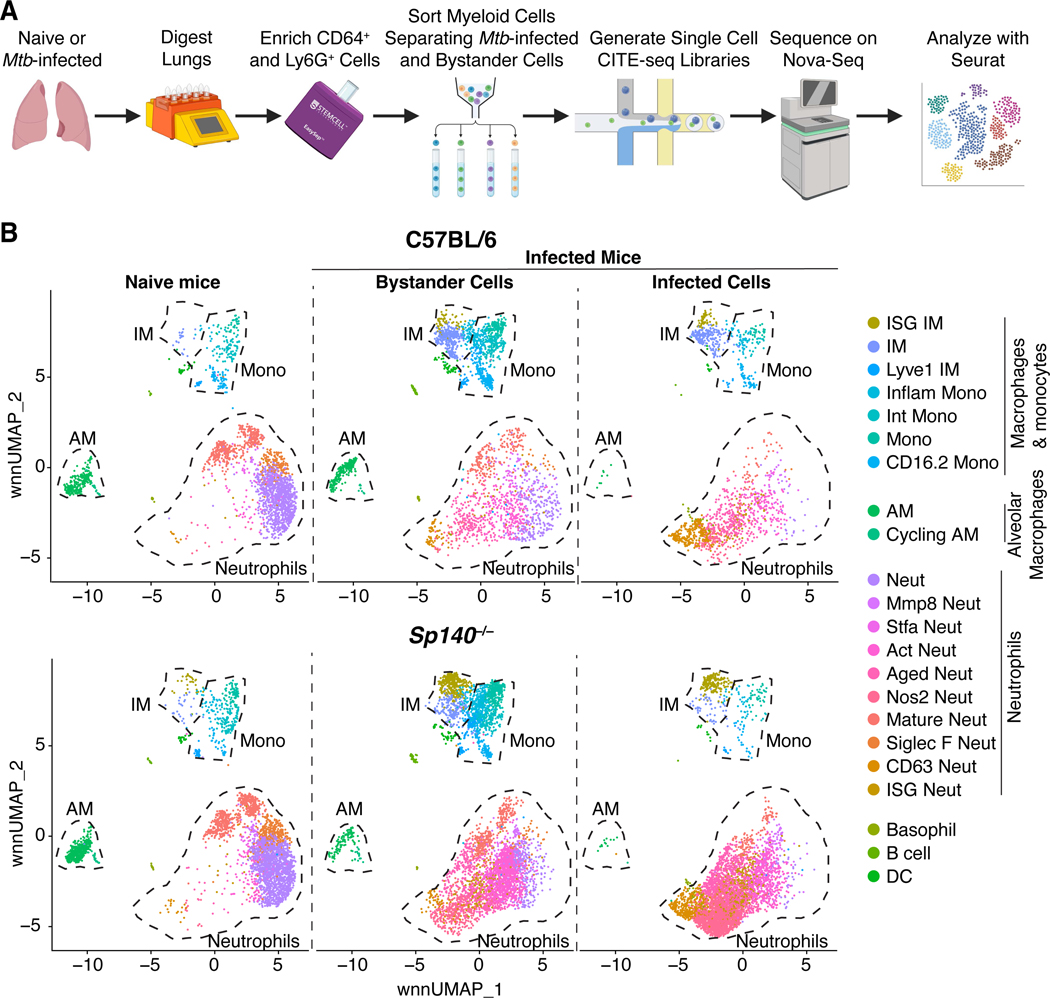
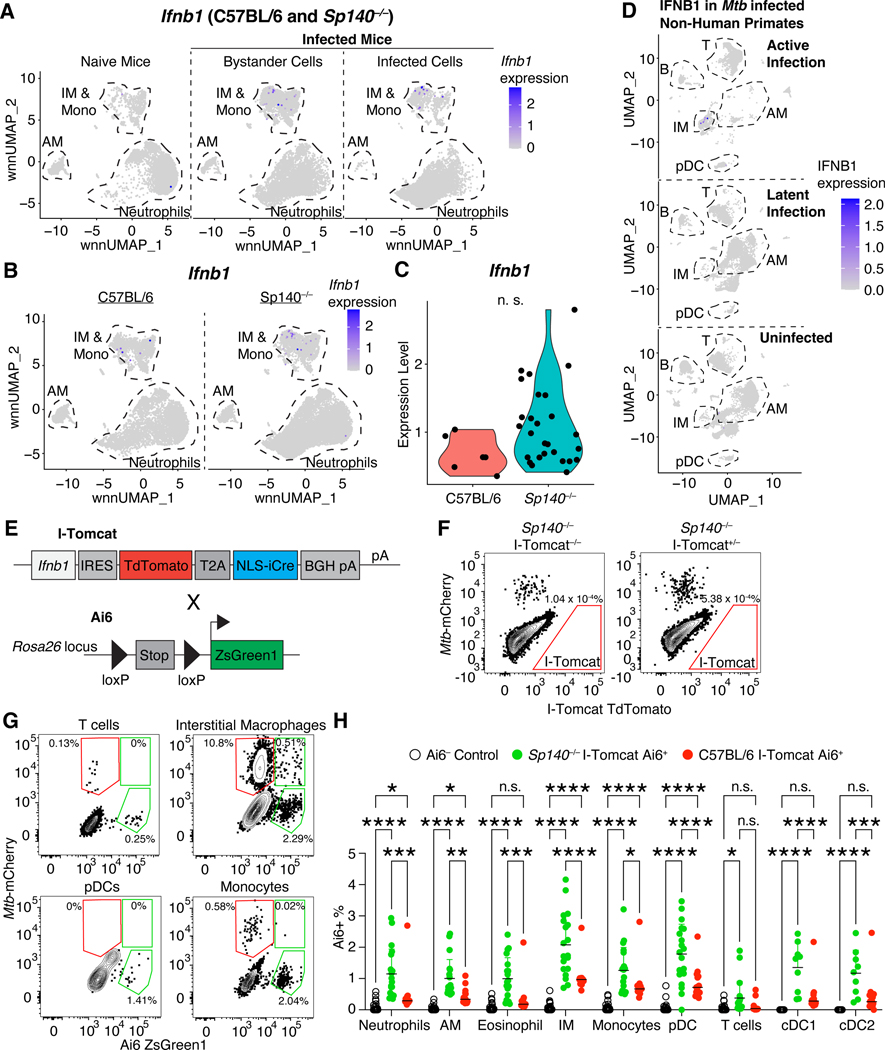
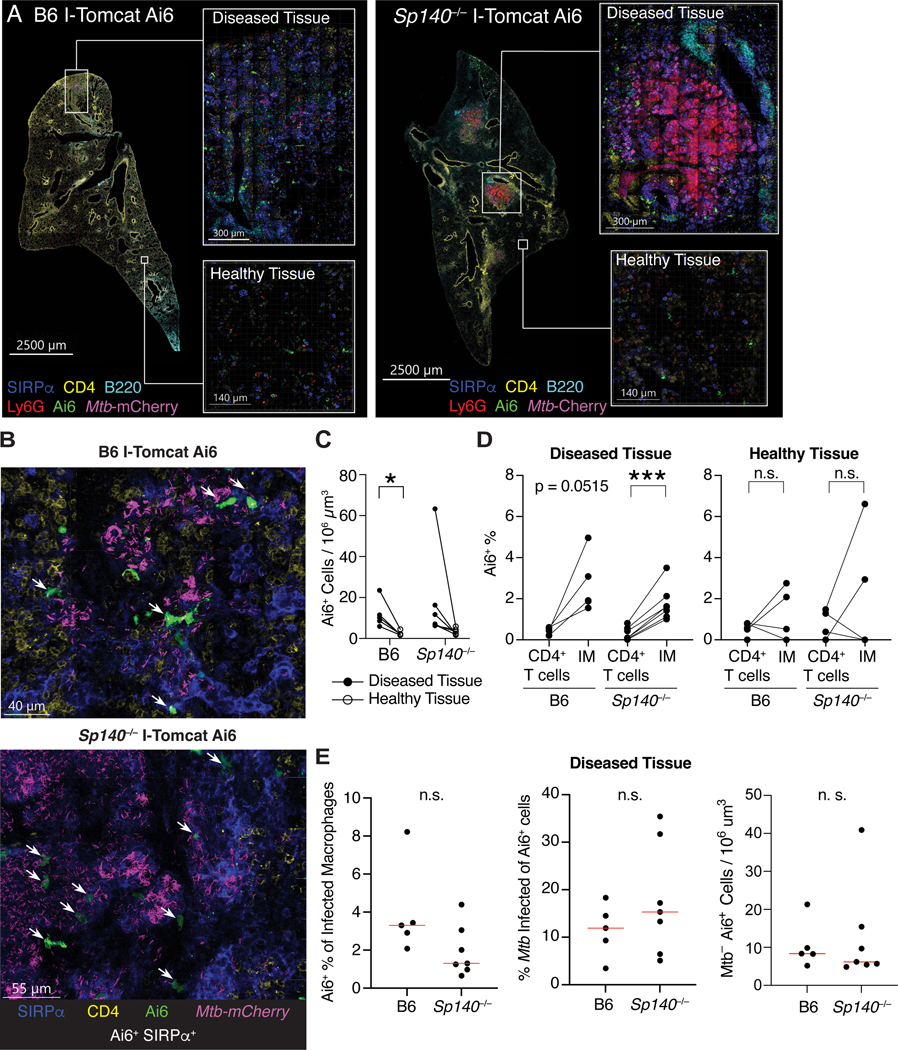
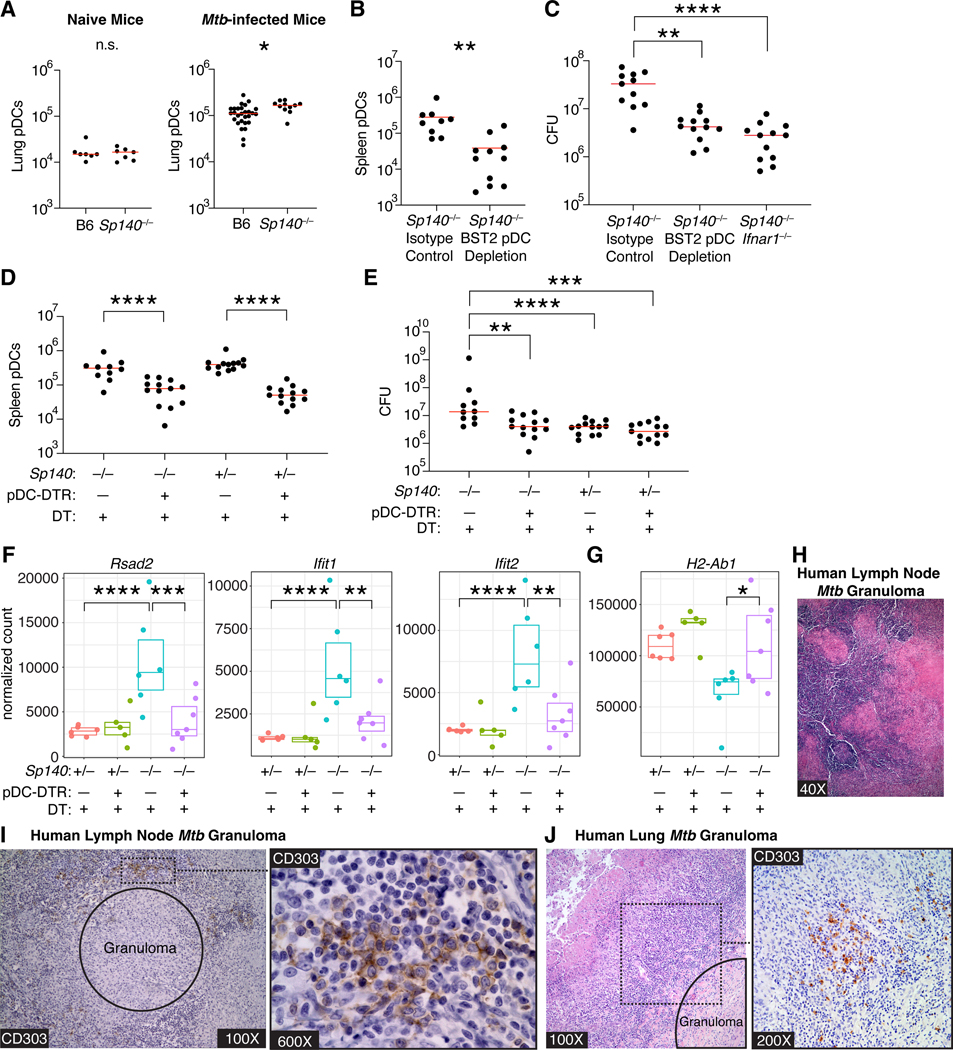
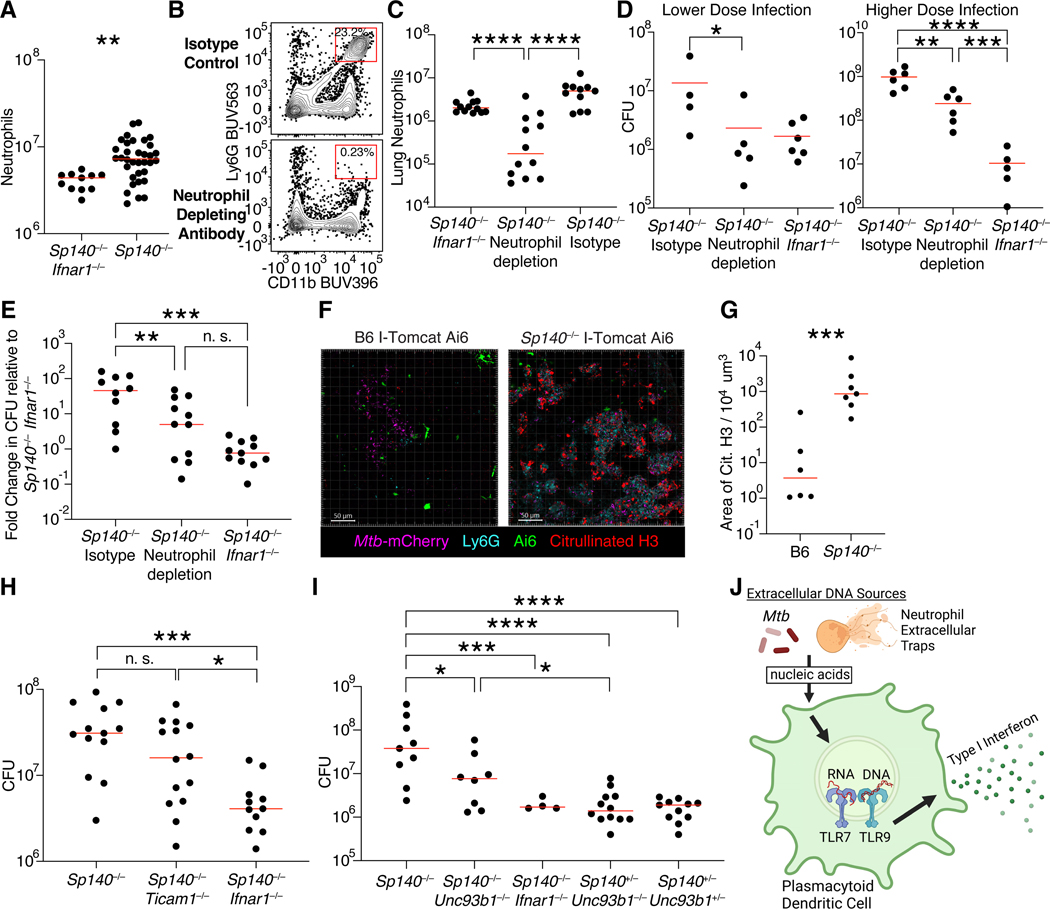
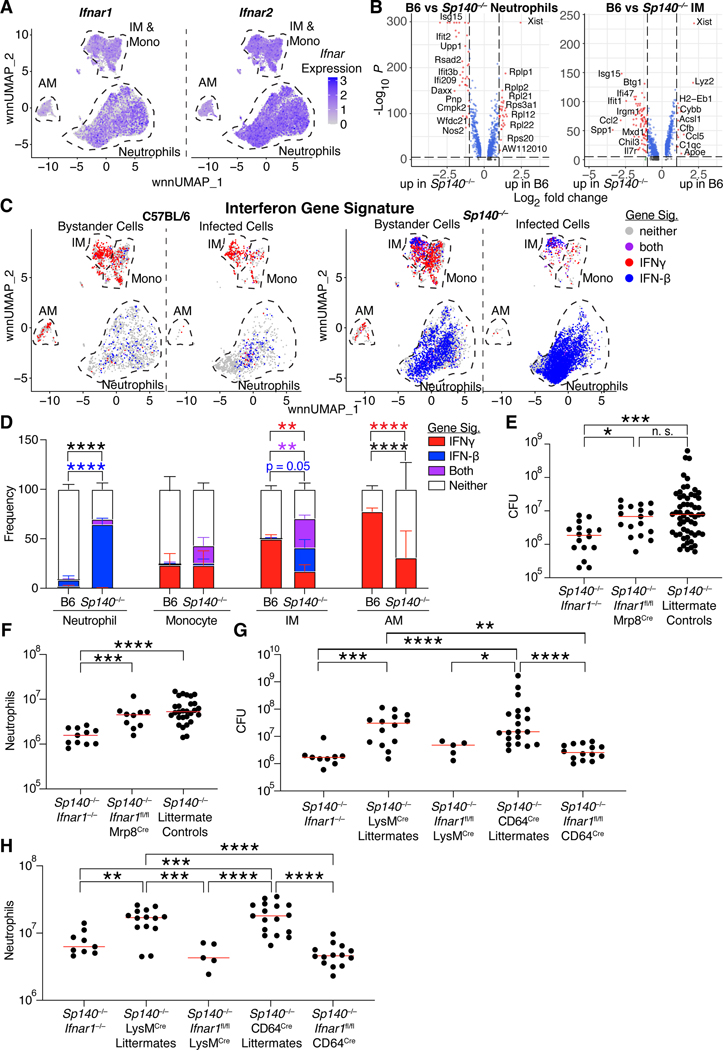
Mycobacterium tuberculosis (Mtb) causes 1.6 million deaths annually. Active tuberculosis correlates with a neutrophil-driven type I interferon (IFN) signature, but the cellular mechanisms underlying tuberculosis pathogenesis remain poorly understood. We found that interstitial macrophages (IMs) and plasmacytoid dendritic cells (pDCs) are dominant producers of type I IFN during Mtb infection in mice and non-human primates, and pDCs localize near human Mtb granulomas. Depletion of pDCs reduces Mtb burdens, implicating pDCs in tuberculosis pathogenesis. During IFN-driven disease, we observe abundant DNA-containing neutrophil extracellular traps (NETs) described to activate pDCs. Cell-type-specific disruption of the type I IFN receptor suggests that IFNs act on IMs to inhibit Mtb control. Single-cell RNA sequencing (scRNA-seq) indicates that type I IFN-responsive cells are defective in their response to IFNγ, a cytokine critical for Mtb control. We propose that pDC-derived type I IFNs act on IMs to permit bacterial replication, driving further neutrophil recruitment and active tuberculosis disease.

Keywords: Mycobacterium tuberculosis; innate immunology; interstitial macrophages; lung; mice; neutrophil extracellular traps; neutrophils; plasmacytoid dendritic cells; type I interferons.


Conflict of interest statement

Declaration of interests R.E.V. consults for Ventus Therapeutics, Tempest Therapeutics, and X-biotix Therapeutics.

Figures

Figure 1.
Figure 1.. Myeloid cells are the dominant Mtb harboring cells in Sp140−/− and Sp140−/− Ifnar1−/− mice.
(A) Colony forming units (CFU) of Mtb in the lungs of Sp140−/− (n = 13) and Sp140−/− Ifnar1−/− (n = 11) mice. (B) Representative flow cytometry plots of an Mtb-infected Sp140−/− mouse lung gated on live CD45+B220CD90.2 cells to identify Mtb-infected cells, subset into neutrophils (green; Ly6G+ CD11b+), other cells (purple; Ly6G−CD64−MerTK−), monocytes (blue; Ly6G−CD64+MerTKlow), alveolar macrophages (AMs; orange; Ly6G− CD64+MerTKhighSiglec F+), and interstitial macrophages (IMs; pink; Ly6G−CD64+MerTKhighSiglec F−). (C) Correlation between infected cell numbers identified by flow cytometry of total lung digests to CFU from the same infected lung (black; Sp140−/− and blue; Sp140−/−Ifnar1−/− combined; n = 45). Red line indicates a nonlinear regression. (D) Number of innate immune cells by cell type in Mtb-infected Sp140−/− (n = 19; closed circles) and Sp140−/−Ifnar1−/− lungs (n = 16; open circles). (E) Frequency and (F) number of immune cell populations of Mtb-infected cells in Sp140−/− (n = 12–19; closed circles) and Sp140−/− Ifnar1−/− mice (n = 10–15; open circles). Lungs were analyzed 24–26 days after Mtb infection. The bars in (A), (D), (E), and (F) represent the median. Pooled data from two or three independent experiments are shown. A linear regression performed on log transformed data was used to calculate significance and R2 for (C). An unpaired t test was used to determine significance for (A), a two-way ANOVA with Sidak’s multiple comparisons test was used to calculate significance for (D), (E), and (F). **p < 0.01, ***p < 0.001, ****p < 0.0001.
Figure 2.
Figure 2.. Single cell RNA-sequencing analysis of B6 and Sp140−/− myeloid cells from Mtb-infected and naïve lungs.
CITE-seq was used to integrate transcriptomic and protein expression of single cells, as detailed in Supplementary Fig. 1. (A) Model of the processing steps involved in generating the scRNA-seq dataset. (B) Unbiased clustering of myeloid cells in B6 and Sp140−/− Mtb-infected and naïve lungs (n = 10 lungs; n= 20,272 cells) distinguishing cells from naïve mice, the bystander cells from Mtb-infected mice, and the Mtb-infected cells from Mtb-infected mice. Lungs were analyzed 25 days after Mtb-Wasabi infection.
Figure 3.
Figure 3.. Bystander pDCs, IMs, and monocytes are the primary IFN-β producers in mice and non-human primates.
(A) Ifnb1 expression in myeloid cells from naïve mice, bystander myeloid cells from infected mice, and Mtb-infected myeloid cells from infected mice (B6 and Sp140−/− combined). (B) Ifnb1 expression in myeloid cells (combined infected and bystander) from B6 and Sp140−/− mice. (C) Ifnb1 expression in B6 and Sp140−/− cells that express Ifnb1. (D) Analysis of GSE149758 scRNA-seq data from Esaulova E., et al. 2021 depicting IFNB1 expression in cells from non-human primates with active Mtb infection, latent Mtb infection, or that are uninfected. (E) Schematic representation of the genetic structure of I-Tomcat mice and Ai6 mice. (F) Representative flow cytometry plot of TdTomato expression in immune cells. (G) Representative flow cytometry plots of ZsGreen expression and Mtb-mCherry detection in T cells, IMs, pDCs, and monocytes. (H) Frequency of Ai6 expressing cells in lung immune cells from Ai6− control (n = 34; open circles), Sp140−/− I-Tomcat Ai6 (n = 19; green circles), and I-Tomcat Ai6 (n = 15; red circles) mice. The bars in (H) represent the median. Pooled data from four independent experiments are shown in (H). Lungs were analyzed 25 days after Mtb infection. Statistical significance in (C) was calculated by non-parametric Wilcoxon rank sum test with Bonferroni correction and in (H) by one-way ANOVA with Tukey’s multiple comparison test. *p < 0.05, **p < 0.01, ***p < 0.001, ****p < 0.0001.
Figure 4.
Figure 4.. Cells producing IFN-β are enriched in diseased tissue, but only a minority harbor Mtb.
(A) Representative images of Mtb-infected I-Tomcat Ai6 and Sp140−/− I-Tomcat Ai6 lung sections stained for SIRPɑ (dark blue), CD4 (yellow), B220 (teal), Ly6G (red), Ai6 (green), and Mtb-expressed mCherry (magenta). Inset images depict higher magnification of diseased and healthy tissue for both genotypes. (B) Representative images of Ai6+ cell localization near Mtb in the diseased portions of I-Tomcat Ai6 and Sp140−/− I-Tomcat Ai6 lungs. Sections were stained with SIRPɑ (dark blue), CD4 (yellow), Ai6 (green), and Mtb-expressed mCherry (magenta). White arrows indicate cells co-expressing Ai6 and SIRPɑ. (C) Number of Ai6+ cells per 106 um3 in diseased (closed circle) and healthy tissue (open circle) from B6 (n = 5) and Sp140−/− (n = 7) Mtb-infected mouse lungs. (D) Image quantification of the frequency of Ai6 expression in CD4+ T cells and SIRPɑ+ IMs in the diseased and healthy tissue of B6 I-Tomcat Ai6 (n = 5) and Sp140−/− I-Tomcat Ai6 (n = 7) lungs. (E) Image quantification of the frequency of Ai6 expression among Mtb-infected macrophages, frequency of Mtb infection among Ai6+ cells, and number of uninfected Ai6+ cells for B6 I-Tomcat Ai6 (n = 5) and Sp140−/− I-Tomcat Ai6 (n = 7) lungs. All samples were analyzed 25 days after Mtb infection. Pooled data from two independent experiments are shown in (C), (D), and (E). Statistical significance in (C), (D) and (E) was calculated with a paired or unpaired t test. *p < 0.05, ***p < 0.001.
Figure 5.
Figure 5.. pDC depletion reduces Mtb burdens in Sp140−/− mice, and pDCs are present in the lymphocytic cuff surrounding granulomas in Mtb-infected human lymph nodes and lungs.
(A) Number of lung pDCs in B6 and Sp140−/− mice in naïve (n = 7) and Mtb-infected mice (n = 11–28). (B) Number of splenic pDCs and (C) bacterial burden in Sp140−/− mice that received isotype or pDC depleting anti-BST2 antibody from days 12–24 post-infection (n = 9–12). (D) Number of splenic pDCs, (E) bacterial burden, (F) lung expression of Rsad2, Ifit1, and Ifit2 as representative type I IFN-stimulated genes, and (G) lung expression of H2-Ab1 as a representative type II IFN-stimulated gene in Sp140−/− pDC-DTR mice or Sp140−/− mice controls that received DT from days 12 to 24 after infection (n = 10–13 for (D) and (E); n = 5–7 for (F) and (G)). (H) Representative hematoxylin and eosin or (I) anti-CD303 (brown) and hematoxylin staining on serial sections of Mtb-infected human lymph nodes (n = 8). (J) Representative hematoxylin and eosin and anti-CD303 (brown) and hematoxylin staining on serial sections of Mtb-infected human lung samples (n = 8). Mouse lungs were harvested 25 days post-infection. The bars in (A), (B), (C), (D), and (E) represent the median. Pooled data from two independent experiments are shown in (A), (B), (C), (D), and (E). Statistical significance was calculated by one-way ANOVA with Tukey’s multiple comparison test for (C), (D), and (E) and by an unpaired t test for (A) and (B). *p < 0.05, **p < 0.01, ***p < 0.001, ****p < 0.0001.
Figure 6.
Figure 6.. Role of neutrophils, neutrophil extracellular traps (NETs) and endosomal TLRs during type I IFN-driven Mtb pathogenesis.
(A) Quantification of lung neutrophils in Mtb-infected Sp140−/− (n = 34) and Sp140−/− Ifnar1−/− (n = 11) mice. (B) Representative flow cytometry plot and (C) quantification of lung neutrophils (n = 10–11) as well as (D) bacterial burden after lower (n = 4–6) or higher dose (n = 5–6) infection and (E) combined normalized bacterial burden (n = 10–11) in Sp140−/− mice that received isotype or neutrophil depleting anti-Ly6G clone 1A8 antibody from days 12 to 24 post-infection. (F) Representative images and (G) quantification of NET production based on citrullinated H3 staining in the diseased portions of I-Tomcat Ai6 and Sp140−/− I-Tomcat Ai6 lungs. Sections were stained with citrullinated H3 (red), Ai6 (green), Ly6G (teal), and Mtb-expressed mCherry (magenta) (n = 6–7). (H) Lung bacterial burden in Mtb-infected Sp140−/− (n = 13), Sp140−/− Ticam1−/− (Ticam1 encodes TRIF; n = 14), and Sp140−/− Ifnar1−/− mice (n = 11). (I) Lung bacterial burden in Mtb-infected Sp140−/− (n = 9), Sp140−/− Unc93b1−/− (n = 8), Sp140−/− Ifnar1−/− (n = 4), Sp140+/− Unc93b1−/− mice (n = 12), and Sp140+/− Unc93b1+/− mice (n = 11). (J) Model of potential extracellular DNA sources stimulating pDC production of type I IFNs through endosomal TLR signaling. The bars in (A), (C), (D), (E), (G), (H), and (I) represent the median. Lungs were analyzed 25 days after Mtb infection. Statistical significance was calculated by one-way ANOVA with Tukey’s multiple comparison test for (E), (H), and (I), by one-tailed unpaired t test for (D), and by two-tailed unpaired t test for (A) and (G). *p < 0.05, **p < 0.01, ***p < 0.001, ****p < 0.0001.
Figure 7.
Figure 7.. Macrophage recognition of type I IFN drives Mtb susceptibility of Sp140−/− mice.
(A) Ifnar1 and Ifnar2 mRNA expression in innate immune cells from Mtb-infected lungs (B6 and Sp140−/− combined). (B) Differentially expressed genes comparing B6 and Sp140−/− neutrophils and IMs, with higher log fold change indicating greater expression in B6. (C) Bystander, and Mtb-infected lung myeloid cells from B6 and Sp140−/− mice classified by their responsiveness to IFNγ (red), type I IFN (blue), both (purple), or neither (grey). (D) Graph of neutrophils, monocytes, IMs, and AMs frequencies from Mtb-infected B6 (n = 3) and Sp140−/− (n = 3) lungs that are responsive to IFNγ (red), type I IFN (blue), both (purple), or neither (white). (E) Lung bacterial burden and (F) neutrophils in Mtb-infected Sp140−/− Ifnar1−/− (n = 16), Sp140−/− Ifnar1fl/fl Mrp8cre (n = 18), and Sp140−/− littermate control (n = 57) mice. (G) Lung bacterial burden and (H) neutrophils in Mtb-infected Sp140−/− Ifnar1−/− (n = 9), Sp140−/− LysMcre littermate control (n = 14), Sp140−/− Ifnar1fl/fl LysMcre (n = 5), Sp140−/− CD64cre littermate control (n = 20), and Sp140−/− Ifnar1fl/fl CD64cre (n = 14) mice. The bars in (E-H) represent the median. Lungs were analyzed 24–26 days after Mtb infection. Pooled data from two-three independent experiments are shown. Statistical significance in (B) was calculated by non-parametric Wilcoxon rank sum test with Bonferroni correction, by one-way ANOVA with Tukey’s multiple comparison test for (E-H), and by two-way ANOVA with Tukey’s multiple comparisons test in (D). *p < 0.05, **p < 0.01, ***p < 0.001, ****p < 0.0001.

References

    1. WHO (2021). Global tuberculosis report 2021. https://www.who.int/publications-detail-redirect/9789240037021.
    1. Katelaris AL, Jackson C, Southern J, Gupta RK, Drobniewski F, Lalvani A, Lipman M, Mangtani P, and Abubakar I. (2020). Effectiveness of BCG Vaccination Against Mycobacterium tuberculosis Infection in Adults: A Cross-sectional Analysis of a UK-Based Cohort. J. Infect. Dis 221, 146–155. 10.1093/infdis/jiz430. - DOI - PubMed
    1. Cooper AM, Dalton DK, Stewart TA, Griffin JP, Russell DG, and Orme IM (1993). Disseminated tuberculosis in interferon gamma gene-disrupted mice. J. Exp. Med 178, 2243–2247. 10.1084/jem.178.6.2243. - DOI - PMC - PubMed
    1. Flynn JL, Goldstein MM, Chan J, Triebold KJ, Pfeffer K, Lowenstein CJ, Schreiber R, Mak TW, and Bloom BR (1995). Tumor necrosis factor-alpha is required in the protective immune response against Mycobacterium tuberculosis in mice. Immunity 2, 561–572. 10.1016/1074-7613(95)90001-2. - DOI - PubMed
    1. Flynn JL, Chan J, Triebold KJ, Dalton DK, Stewart TA, and Bloom BR (1993). An essential role for interferon gamma in resistance to Mycobacterium tuberculosis infection. J. Exp. Med 178, 2249–2254. 10.1084/jem.178.6.2249. - DOI - PMC - PubMed

Publication types